


– Major spikes and gains of over +30% for many altcoins this week.
– A pullback and retest should be expected.
Cardano (ADA)
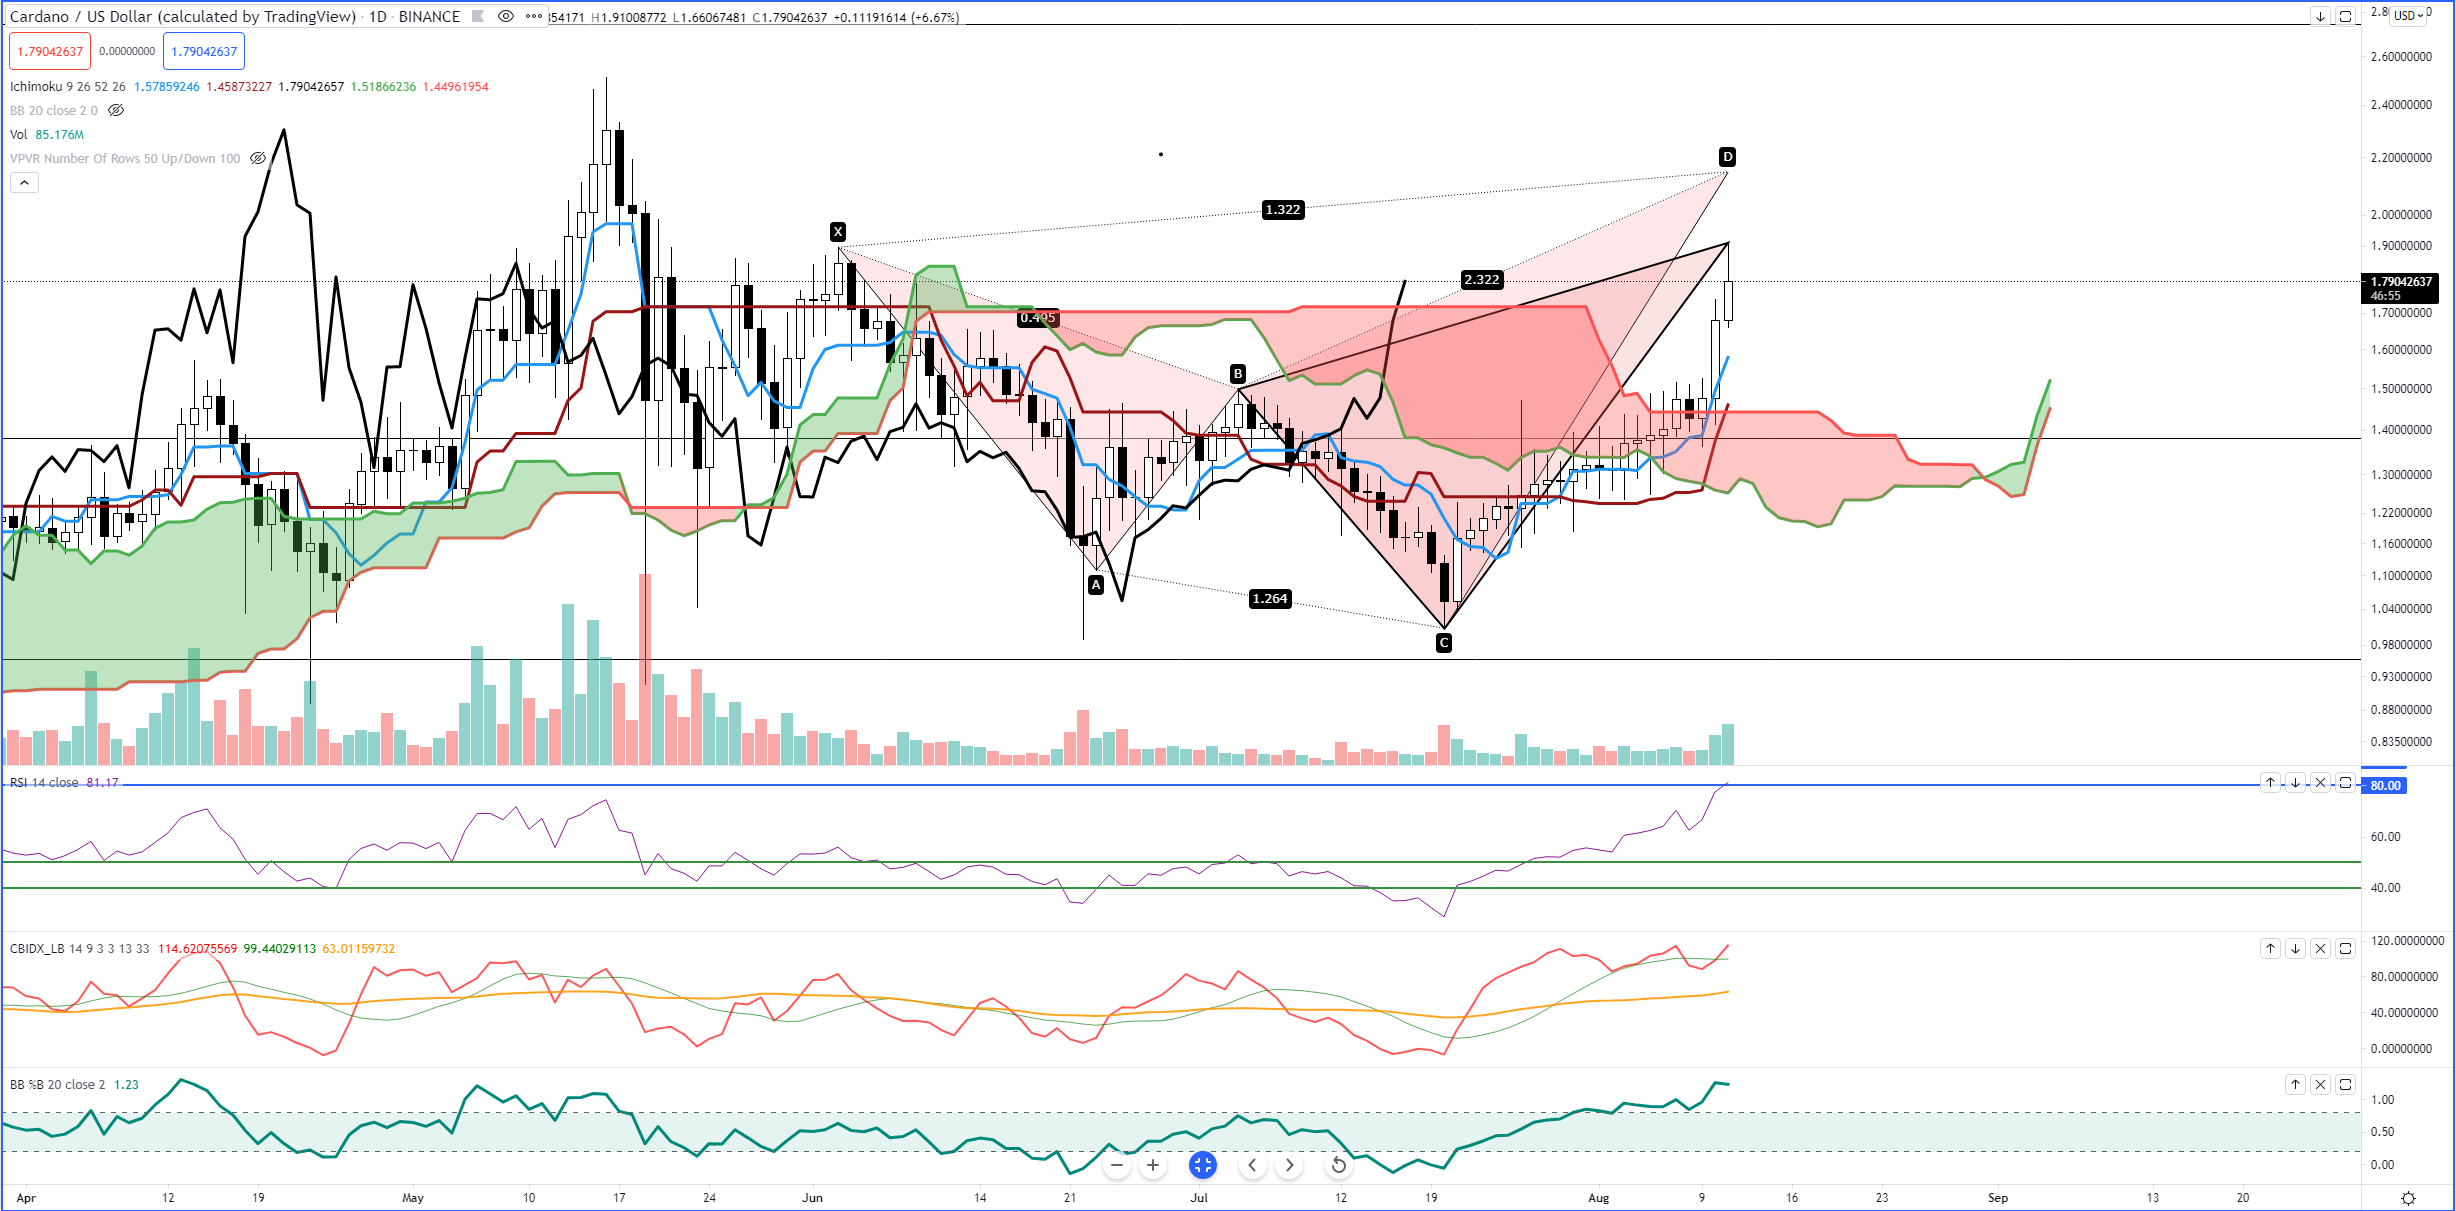
Above: Cardano (ADAUSD)
Cardano’s has been up over 30% at one point this week. At the time of writing this article (1900 EST), Cardano is off a little from its intra-week highs, but still up +21.24%. The image above is Cardano’s daily chart and the odd geometric pattern you see is a harmonic pattern known as Bearish Shark . Without going into a ton of detail, know that the Bearish Shark has an extremely high positive expectancy rate of reversing the current trending move and generating a near immediate corrective move or trend change. The last point in the pattern labeled ‘D’ is also known as the PRZ (Potential Reversal Zone). For the Bearish Shark Pattern, this means that Cardano’s top could be anywhere between $1.90 and $2.04. There are projected profit target zones with this pattern as well. The two profit target levels are at $1.61 and $1.37. Consequently, both of those profit levels coincide with the current daily Tenkan-Sen (at $1.57) and both the daily Kijun-Sen and Senkou Span B ($1.45 and $1.44, respectively). I am looking to add to my positions if Cardano reaches either of the two profit zones and support is confirmed.
The likelihood of a short term top being found here is strong. The %B is at a historical resistance level, the Composite Index is a historical resistance level, and the RSI is currently overbought on the RSI with bull market levels on the RSI. I do want to point out that the RSI no the daily chart is the highest its been since February 28th, 2021.
Bitcoin (BTC)
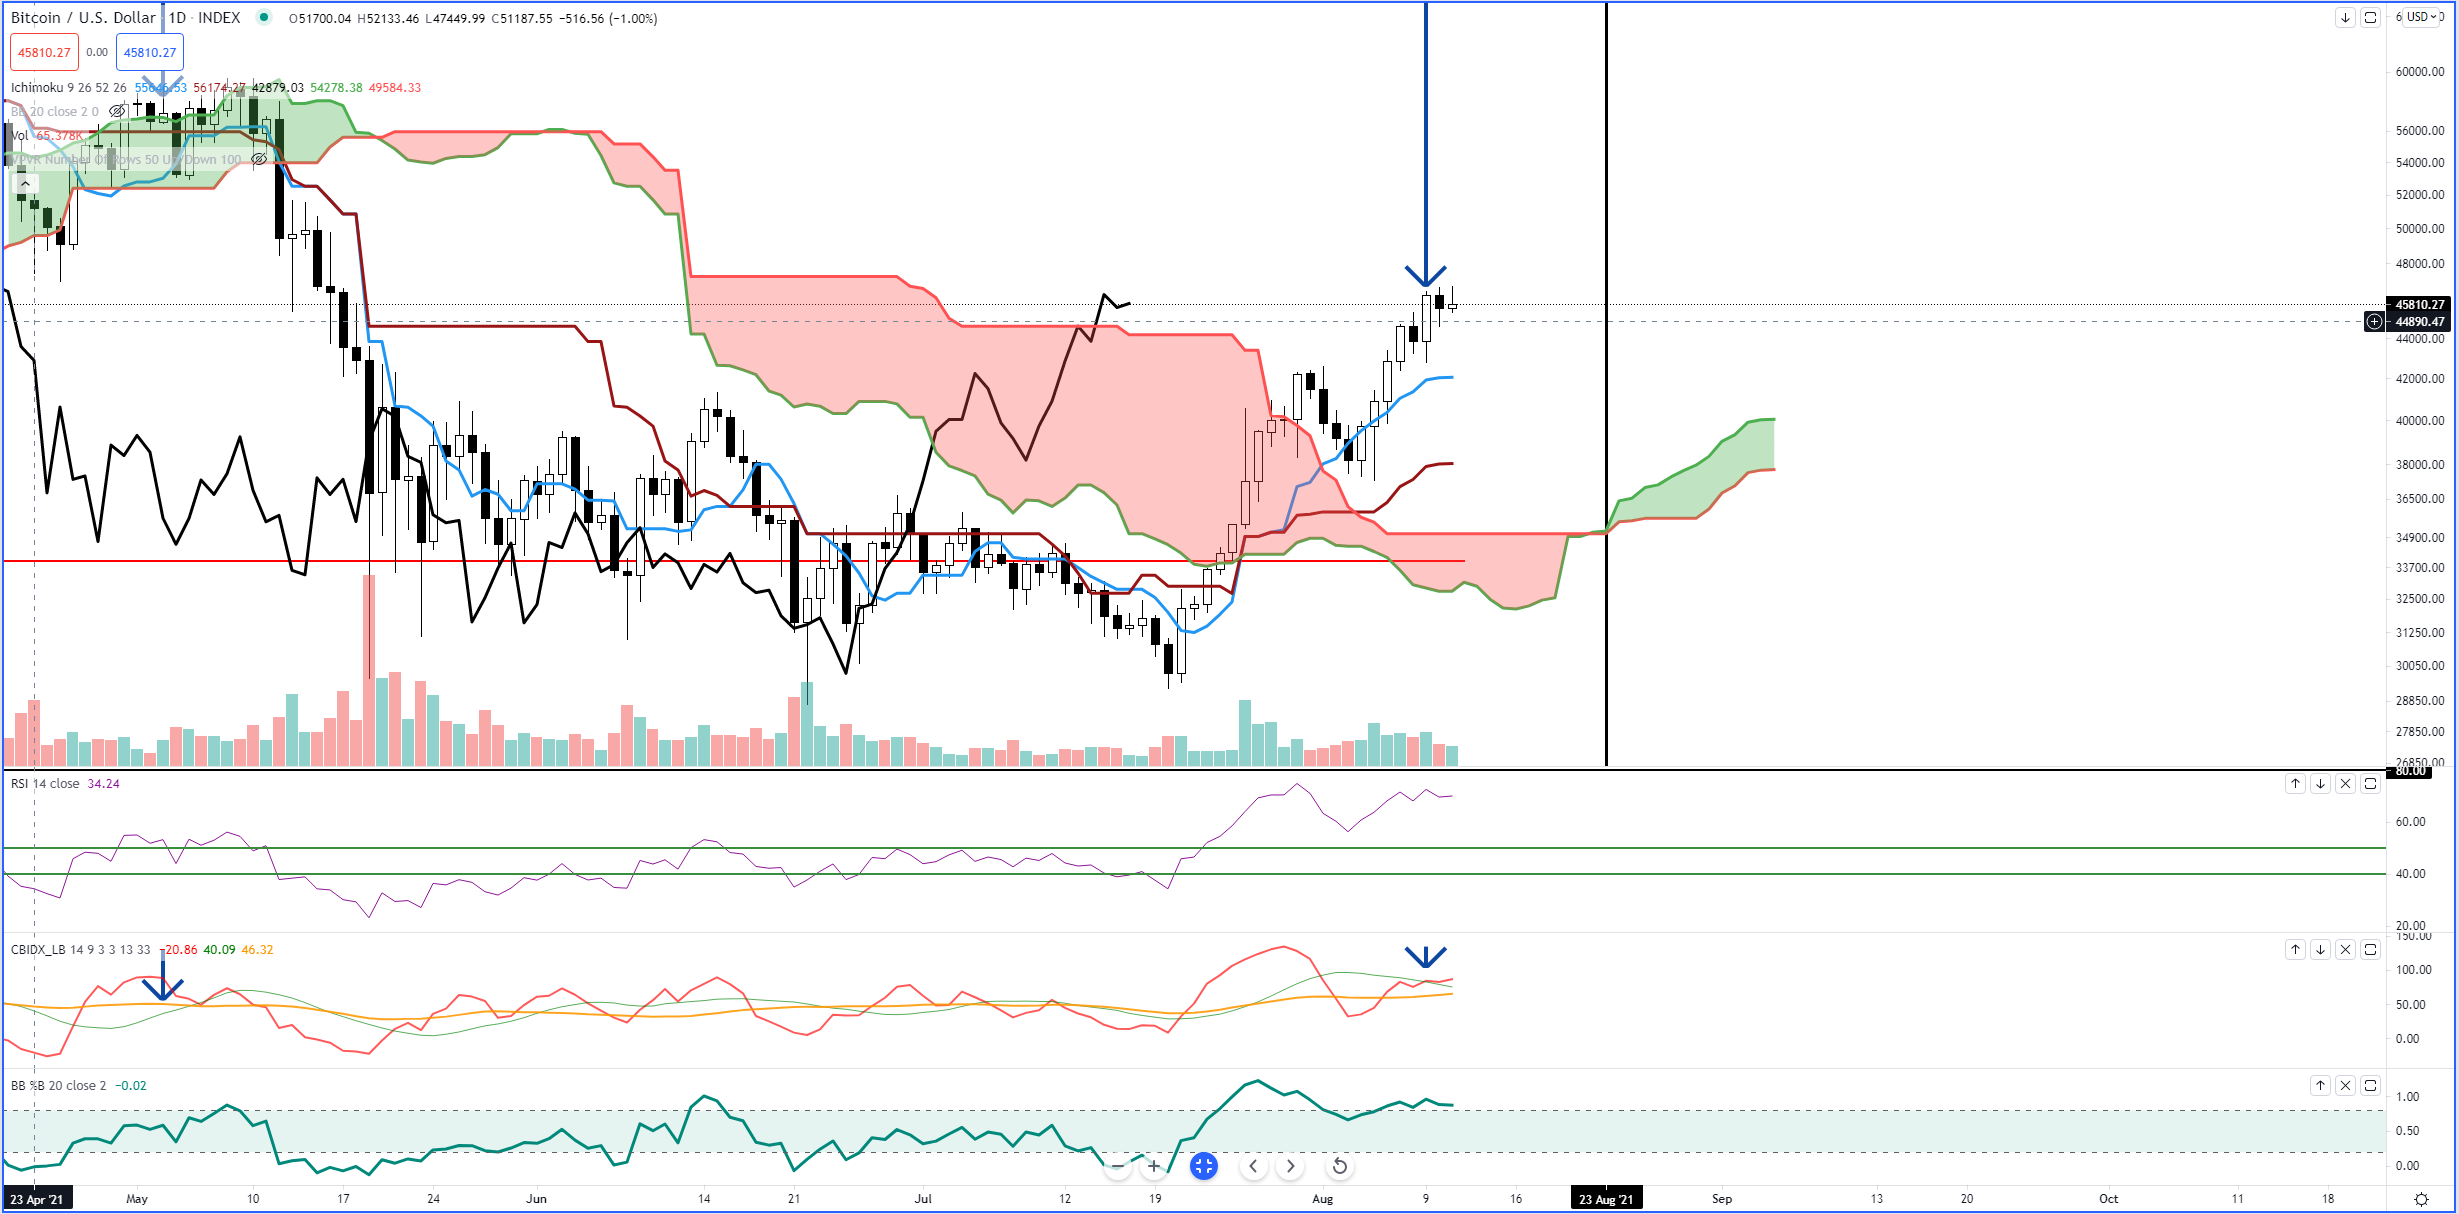
 Above: Bitcoin (BTCUSD)
Bitcoin looks like it could be encountering a topping point here. Volume has dipped since the start of the week and there’s some clear signs of bullish dip buying slowing down and drying up. There is a noticeable gap between the current close and Tenkan-Sen on Bitcoin’s daily chart – as well as a sizeable (but not horrible) gap between the close and the Kijun-Sen. If there’s one thing that never seems to remain a condition for very long in the Ichimoku system, it’s a large gap between the close and the Tenkan-Sen. Price is very, very sensitive to the Tenkan-Sen and they don’t often like to move far away from one another. A likely move here for Bitcoin would be a return to the daily Tenkan-Sen at $42,250 to test as support. There is a possibility that it may not retrace that far. The Lagging Span has two consecutive (three if today closes above the Cloud) closes above the Cloud on the daily chart, so its entirely probable that the top of the Cloud (Senkou Span B) could hold as support at $45,800. This scenario seems very likely, especially when you look at Bitcoin’s RSI: it’s not yet overbought. The Composite Index is sitting fairly neutral to slightly bullish and the %B remains stable above the 0.8 level. In summary, near term support if Bitcoin drops is at $45,800, $42,250 and the Kijun-Sen at $38,000.
Advertisement
Save money on your currency transfers with TorFX, voted International Money Transfer Provider of the Year 2016 – 2020. Their goal is to connect clients with ultra competitive exchange rates and a uniquely dedicated service whether they choose to trade online or over the telephone.
Find out more here.


