Notice: Function _load_textdomain_just_in_time was called incorrectly. Translation loading for the updraftplus domain was triggered too early. This is usually an indicator for some code in the plugin or theme running too early. Translations should be loaded at the init action or later. Please see Debugging in WordPress for more information. (This message was added in version 6.7.0.) in /home/aonyeani76/cryptocurrencypanther/wp-includes/functions.php on line 6131
Notice: Function _load_textdomain_just_in_time was called incorrectly. Translation loading for the hustle domain was triggered too early. This is usually an indicator for some code in the plugin or theme running too early. Translations should be loaded at the init action or later. Please see Debugging in WordPress for more information. (This message was added in version 6.7.0.) in /home/aonyeani76/cryptocurrencypanther/wp-includes/functions.php on line 6131
Notice: Function _load_textdomain_just_in_time was called incorrectly. Translation loading for the wpforms-lite domain was triggered too early. This is usually an indicator for some code in the plugin or theme running too early. Translations should be loaded at the init action or later. Please see Debugging in WordPress for more information. (This message was added in version 6.7.0.) in /home/aonyeani76/cryptocurrencypanther/wp-includes/functions.php on line 6131 Market – Cryptocurrencypanther
https://cryptocurrencypanther.com
Latest Crypto NewsSun, 19 Apr 2026 11:03:04 +0000en-US
hourly
1 https://wordpress.org/?v=6.9.4https://cryptocurrencypanther.com/wp-content/uploads/2021/07/cropped-Cryptocurrency-e1626714913653-32x32.pngMarket – Cryptocurrencypanther
https://cryptocurrencypanther.com
3232SuperTrend Flips Bullish On XRP Daily Chart — But Key $1.55 Resistance Awaits
https://cryptocurrencypanther.com/2026/04/19/supertrend-flips-bullish-on-xrp-daily-chart-but-key-1-55-resistance-awaits/
https://cryptocurrencypanther.com/2026/04/19/supertrend-flips-bullish-on-xrp-daily-chart-but-key-1-55-resistance-awaits/#respondSun, 19 Apr 2026 11:03:04 +0000https://cryptocurrencypanther.com/2026/04/19/supertrend-flips-bullish-on-xrp-daily-chart-but-key-1-55-resistance-awaits/
The XRP market has recorded a major positive development, as the SuperTrend flashed its first buy signal on the daily chart in over three months. This event indicates the altcoin’s short-term prospects are looking positive amid the broader market volatility driven by an unstable geopolitical scene.
XRP Bulls Set Course For Encounter With $1.55 Barrier
In an X post on April 18, renowned analyst Ali Martinez shares a bullish outlook for the XRP market, highlighting the resistance level and a price target. This analysis follows the SuperTrend indicator, which has turned bullish on the XRP daily chart for the first time since Jan 17.
The SuperTrend indicator is a trend-following technical analysis tool that helps traders identify the current market direction (an uptrend or a downtrend) and potential entry/exit points.
For the first time since Jan. 17, the SuperTrend indicator has flipped bullish on the daily chart. After months of "sell" pressure, we are officially seeing a buy signal that anticipates a major comeback in XRP's trend.
XRP’s last significant and sustained price rally came in early January when the altcoin reached a local peak of $2.42. Since then, prices have traded as low as $1.10 and are presently consolidating between $1.30 – $1.55, in line with broader market movements. However, the recent signal from the SuperTrend indicator suggests this period of sustained selling pressure could have ended.
According to Martinez, the trend shift can only be validated if XRP breaks the key price resistance level at $1.55, which has held consistently and effectively in recent weeks. The analyst describes this future encounter as a “true test” of XRP’s bullish intentions, noting that a clear, decisive break above this level should trigger a subsequent relief rally. In this case, the cryptocurrency is tipped to trade as high as $1.90, provided the SuperTrend indicator provides a trailing support floor. Based on present market prices, Martinez’s analysis suggests the XRP market could notch a possible 32% gain in the coming weeks.
XRP Price Overview
At the time of writing, XRP trades at $1.43, after prices dipped by 2.43% in the last day. Meanwhile, daily trading volume is down 40.55% to $2.69 billion. XRP’s latest price decline follows instability in the geopolitical landscape tied to the ongoing US-Iran War. The Middle East nation had initially granted commercial ships access to the Strait of Hormuz for the remainder of its ongoing ceasefire with the Western power.
However, on Saturday, Iran soon nullified that position, declaring the Strait of Hormuz closed again, citing the US’s continuous blockade of its shipping ports. On the other hand, US President Donald Trump has stated that the US naval blockade must remain in full force until both nations reach an agreement.
Global financial markets continue to weather a storm amid these choking geopolitical tensions, especially considering the broader impact of the recent rise in oil and energy prices. Following Iran’s latest announcement, the total crypto market cap is now down 2.00% to $2.56 trillion.
]]>https://cryptocurrencypanther.com/2026/04/19/supertrend-flips-bullish-on-xrp-daily-chart-but-key-1-55-resistance-awaits/feed/0Pundit Says This Chart Paints The Clearest Macro Picture For XRP
https://cryptocurrencypanther.com/2026/04/17/pundit-says-this-chart-paints-the-clearest-macro-picture-for-xrp/
https://cryptocurrencypanther.com/2026/04/17/pundit-says-this-chart-paints-the-clearest-macro-picture-for-xrp/#respondFri, 17 Apr 2026 14:17:11 +0000https://cryptocurrencypanther.com/2026/04/17/pundit-says-this-chart-paints-the-clearest-macro-picture-for-xrp/
Crypto analyst Mattsby has highlighted the best chart for market participants seeking the clearest macro picture for XRP. He also provided a bullish outlook for the altcoin, noting that a key resistance is now flipping into support.
This Chart Paints The Best Macro Picture For XRP
In an X post, Mattsby urged market participants to zoom out to the 2-month chart and add the 20SMA if they want to see the clear, well-defined macro trend for XRP. He noted that history shows that XRP has bullish momentum and room to run higher whenever it is above the 20SMA. On the other hand, the altcoin could be preparing for a potentially long, painful consolidation before the next big leg, as long as it remains below this level.
The analyst noted that XRP has been trading this key moving average since November 2024 and that what was once resistance is now flipping into solid support. He explained that this is why he is staying bullish on the altcoin despite the current price action. Mattsby added that support is holding and that the macro trend is intact.
Crypto analyst Chart Nerd also provided a bullish outlook for XRP. In an X post, he stated that after months of sustained pressure, multiple timeframes suggest bullish relief is on the table for XRP. He highlighted $1.54 and $1.87 as levels the altcoin could reclaim during this relief rally. He also noted that $1.560 is the immediate resistance that XRP could face on this rally to the upside. It is worth noting that XRP is already seeing a relief rally, bouncing alongside Bitcoin and the broader crypto market.
XRP Still Trapped Below A Key Resistance
In an X post, crypto analyst CasiTrades warned that XRP remains trapped below resistance, noting the altcoin has been ranging below $1.6 for over 68 days. In line with this, she declared that nothing has changed on the macro plan for XRP. It is worth noting that the analyst is currently bearish, predicting further crashes for the altcoin.
Related Reading
CasiTrades stated that, at the moment, there is a wait for XRP to do one of two things. The first could be a move down to the macro support levels at $1.09 and $0.87. Meanwhile, the second could be a break and hold above $1.65, which will flip the market bullish. Until then, she noted that the current price action is just continued chop, with XRP stuck in a tight range between $1.28 and $1.39. The analyst added that she expects continuation toward the lower supports once XRP breaks below $1.28.
At the time of writing, the XRP price is trading at around $1.43, up over 2% in the last 24 hours, according to data from CoinMarketCap.
XRP trading at $1.43 on the 1D chart | Source: XRPUSDT on Tradingview.com
Featured image from Sketchfab, chart from Tradingview.com
]]>https://cryptocurrencypanther.com/2026/04/17/pundit-says-this-chart-paints-the-clearest-macro-picture-for-xrp/feed/0Former Treasury Secretary Warns of US Bond Market Stress
https://cryptocurrencypanther.com/2026/04/17/former-treasury-secretary-warns-of-us-bond-market-stress/
https://cryptocurrencypanther.com/2026/04/17/former-treasury-secretary-warns-of-us-bond-market-stress/#respondFri, 17 Apr 2026 13:15:49 +0000https://cryptocurrencypanther.com/2026/04/17/former-treasury-secretary-warns-of-us-bond-market-stress/
Henry Paulson, who served as Treasury Secretary from 2006 to 2009 and architected the $700Bn TARP stabilization during the 2008 financial crisis, warned on Bloomberg Television’s Wall Street Week that the US Treasury market faces the risk of a “vicious” crash, calling for a “break-the-glass” emergency contingency plan to be prepared for immediate deployment.
His proposed measures include closing tax loopholes, overhauling Social Security, and restructuring healthcare spending – a scope that signals Paulson views the fiscal trajectory as a structural problem, not a cyclical one. US national debt stood at approximately $38.9Bn as of mid-April 2026, with the debt-to-GDP ratio near 100% and the peacetime deficit running at a record 7% of GDP.
What I’m watching tonight:
“Panic: The Untold Story of the 2008 Financial Crisis”
HBO / Vice production
Third time watching it.
A FANTASTIC perspective into the inside baseball between the Secretary of Treasury (Henry Paulson), Federal Reserve Bank of NY President (Tim…
We suspect Paulson’s intervention carries a weight distinct from the steady stream of deficit warnings that have circulated since the post-COVID fiscal expansion. A figure of his institutional standing – with direct experience managing a systemic liquidity crisis – invoking emergency language in a public forum is a signal of a different category than analyst commentary.
For crypto markets specifically, the more consequential question is not whether Paulson’s forecast proves accurate, but whether his warning accelerates the repricing of sovereign credibility risk that has already begun to appear in yield curve dynamics – and which transmission channel carries that repricing into digital asset valuations.
Treasury Yield Stress, Dollar Credibility, and the Liquidity Transmission Channel
The mechanism functions as follows: when a sovereign borrower of the US government’s scale runs a 7% peacetime deficit against a 100% debt-to-GDP ratio, the marginal buyer of Treasuries begins demanding additional yield to compensate for duration risk and fiscal sustainability concerns.
That demand is independent of Federal Reserve policy. JPMorgan Chase CEO Jamie Dimon articulated the dynamic directly, warning that rising Treasury yields could force higher borrowing costs for the government and mortgage markets, regardless of Fed action, driven purely by investor demand for risk compensation in an environment of outsized issuance.
The transmission chain operates as follows: elevated auction supply without commensurate foreign or domestic demand pushes yields higher at the long end; higher long-end yields tighten real financial conditions across the economy; tighter real conditions reduce the present value of risk assets while simultaneously elevating the opportunity cost of holding non-yielding assets, Bitcoin foremost among them.
The 2022 episode remains the cleanest empirical reference: Fed rate hikes produced a 65% collapse in Bitcoin’s price as capital rotated out of risk assets and into suddenly competitive fixed income. A Treasury market stress event that drove yields higher through credibility erosion rather than Fed action would transmit through an identical channel, at potentially greater speed.
Photo: Henry Paulson
Paulson’s warning arrives alongside criticism from American Enterprise Institute analysts who have described current budget policy as “grossly irresponsible” and noted that bond markets are monitoring fiscal decisions with increasing vigilance. Treasury Secretary Scott Bessent has publicly dismissed such alarms, stating on CBS News in June 2025 that Dimon’s track record of failing to act on warnings undermines the credibility of the current concern. That disagreement between the sitting Treasury secretary and a former one, with senior bank leadership aligned with the latter, is itself a signal worth pricing.
Bitcoin, Safe-Haven Rotation, and the Real Yield Compression Trade
The crypto transmission from a Treasury stress event is not uniform – it depends critically on which regime dominates as stress escalates. Two competing channels operate here, and they do not point in the same direction at the same time.
In a rising-yield regime driven by orderly fiscal concern, the transmission is negative for Bitcoin. Higher real yields increase the opportunity cost of holding a non-yielding asset, institutional risk appetite contracts, and capital rotates toward fixed income as it did in 2022. Bitcoin’s correlation with gold has strengthened in recent macro cycles, but that correlation breaks down when real yields rise sharply – gold holds better than Bitcoin in those environments because its safe-haven bid is more established among traditional allocators.
In a credibility-crisis regime – where the concern shifts from fiscal sustainability to dollar debasement and Treasury market dysfunction – the transmission reverses. Historically, dollar weakness driven by sovereign credibility losses has produced a safe-haven bid for hard assets, and Bitcoin’s fixed supply schedule positions it alongside gold as a debasement hedge.
The bull case for crypto in a Paulson-scenario-realized world is precisely this channel: institutional capital, having lost confidence in the real return of long-duration Treasuries, rotates toward assets with no counterparty risk and no inflationary dilution mechanism.
Disclaimer: Coinspeaker is committed to providing unbiased and transparent reporting. This article aims to deliver accurate and timely information but should not be taken as financial or investment advice. Since market conditions can change rapidly, we encourage you to verify information on your own and consult with a professional before making any decisions based on this content.
Daniel Frances is a technical writer and Web3 educator specializing in macroeconomics and DeFi mechanics. A crypto native since 2017, Daniel leverages his background in on-chain analytics to author evidence-based reports and deep-dive guides. He holds certifications from The Blockchain Council, and is dedicated to providing “information gain” that cuts through market hype to find real-world blockchain utility.
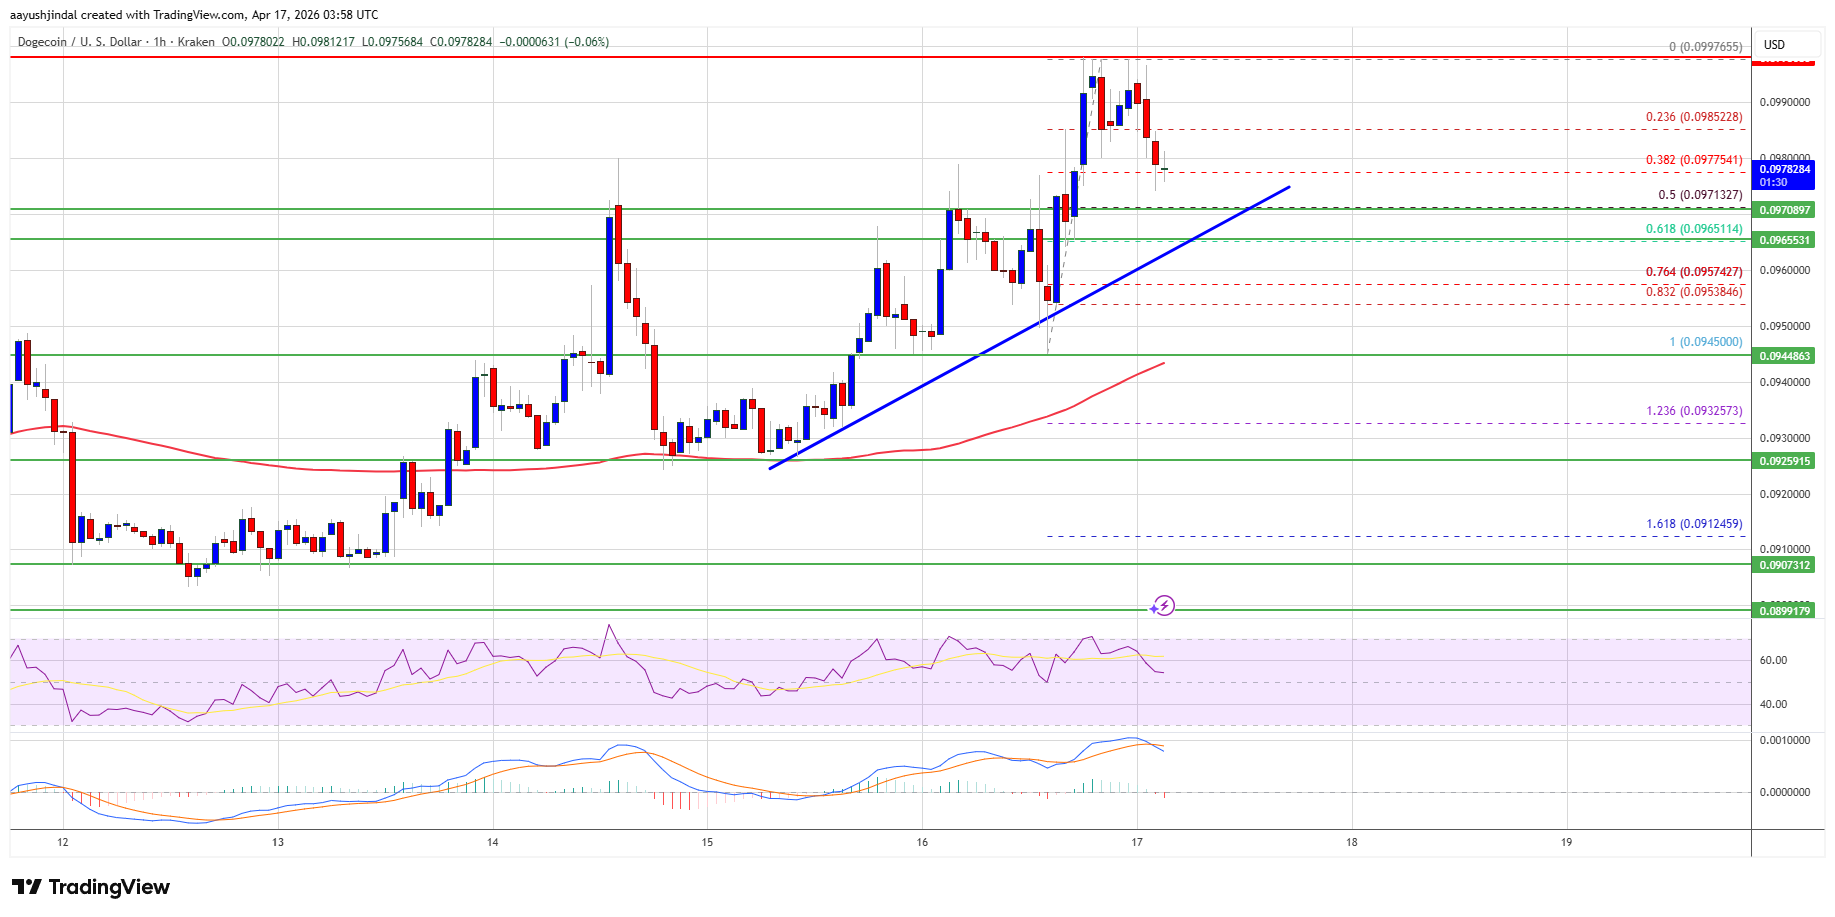
Dogecoin started a decent increase above $0.0950 against the US Dollar. DOGE is now consolidating and might aim for an upside break above $0.10.
DOGE price started a fresh increase above $0.0950 and $0.0975.
The price is trading above the $0.0965 level and the 100-hourly simple moving average.
There is a bullish trend line forming with support at $0.0970 on the hourly chart of the DOGE/USD pair (data source from Kraken).
The price could aim for a fresh increase if it remains stable above $0.0950.
Dogecoin Price Aims Higher
Dogecoin price started a fresh increase after it settled above $0.0950, like Bitcoin and Ethereum. DOGE climbed above the $0.09650 resistance to enter a positive zone.
The bulls were able to push the price above $0.0980. A high was formed at $0.0997 and the price is now correcting some gains. There was a move below the 23.6% Fib retracement level of the upward move from the $0.0945 swing low to the $0.0997 high.
Dogecoin price is now trading above the $0.0965 level and the 100-hourly simple moving average. There is also a bullish trend line forming with support at $0.0970 on the hourly chart of the DOGE/USD pair.
If there is another increase, immediate resistance on the upside is near the $0.0990 level. The first major resistance for the bulls could be near the $0.0995 level.
The next major resistance is near the $0.10 level. A close above the $0.10 resistance might send the price toward $0.1120. Any more gains might send the price toward $0.1150. The next major stop for the bulls might be $0.120.
Another Decline In DOGE?
If DOGE’s price fails to climb above the $0.10 level, it could start a downside correction. Initial support on the downside is near the $0.0970 level and the trend line. The next major support is near the $0.0965 level or the 61.8% Fib retracement level of the upward move from the $0.0945 swing low to the $0.0997 high.
The main support sits at $0.0945. If there is a downside break below the $0.0945 support, the price could decline further. In the stated case, the price might slide toward the $0.0905 level or even $0.090 in the near term.
Technical Indicators
Hourly MACD – The MACD for DOGE/USD is now losing momentum in the bullish zone.
Hourly RSI (Relative Strength Index) – The RSI for DOGE/USD is now above the 50 level.
Pi Network’s PI token holds steady at $0.1730, up 4.5% from the previous day.
The Pi Core Team’s upgrade to enable smart contracts, with a deadline set for April 27, is a potential catalyst.
Pi Network’s PI token has managed to hold steady around $0.1770 as of Friday, adding a 4.5% gain from the previous day.
The Pi Core Team (PCT) is driving momentum with the impending upgrade to the mainnet, which will enable smart contract functionality—expected to be a key catalyst for price movement.
PI rallies ahead of the Protocol 22 upgrade
PI is up 4.5% in the last 24 hours, outperforming the broader cryptocurrency market. The rally comes after the Pi Core Team announced that April 27 is the final deadline for all mainnet nodes to complete necessary steps for remaining connected to the network, as part of the Stellar Protocol version 22 upgrade.
While this upgrade will cause a brief 15-minute downtime during internal data transfer, it lays the groundwork for future improvements. Additionally, the full upgrade to version 26 is slated for June 22, ahead of Pi2Day on June 28.
Will PI rally higher in the near term?
The PI/USD 4-hour chart is bearish and efficient, trading above the $0.1770 level. However, Pi Network remains in a bearish posture, with the token still trading below the 50-, 100-, and 200-day Exponential Moving Averages (EMAs).
The immediate resistance level is marked at $0.1785, corresponding to the 50-day EMA, followed by stronger resistance at $0.1865 (100-day EMA) and $0.2334 (200-day EMA).
However, momentum indicators present mixed signals. The Relative Strength Index (RSI) at 71 is above the neutral 50 line, and is heading into the overbought region.
The Moving Average Convergence Divergence (MACD) crossing above its signal line indicates growing bullish momentum.
On the downside, key support is found at $0.1556, near the February 23 low, with further weakness potentially exposing $0.1310 if the market slips below this level.
]]>https://cryptocurrencypanther.com/2026/04/17/pi-steadies-at-0-1770-amid-core-teams-mainnet-upgrade-plans/feed/0Ethereum Price Capped at $2,400, Momentum Fails to Push Higher
https://cryptocurrencypanther.com/2026/04/17/ethereum-price-capped-at-2400-momentum-fails-to-push-higher/
https://cryptocurrencypanther.com/2026/04/17/ethereum-price-capped-at-2400-momentum-fails-to-push-higher/#respondFri, 17 Apr 2026 06:06:51 +0000https://cryptocurrencypanther.com/2026/04/17/ethereum-price-capped-at-2400-momentum-fails-to-push-higher/
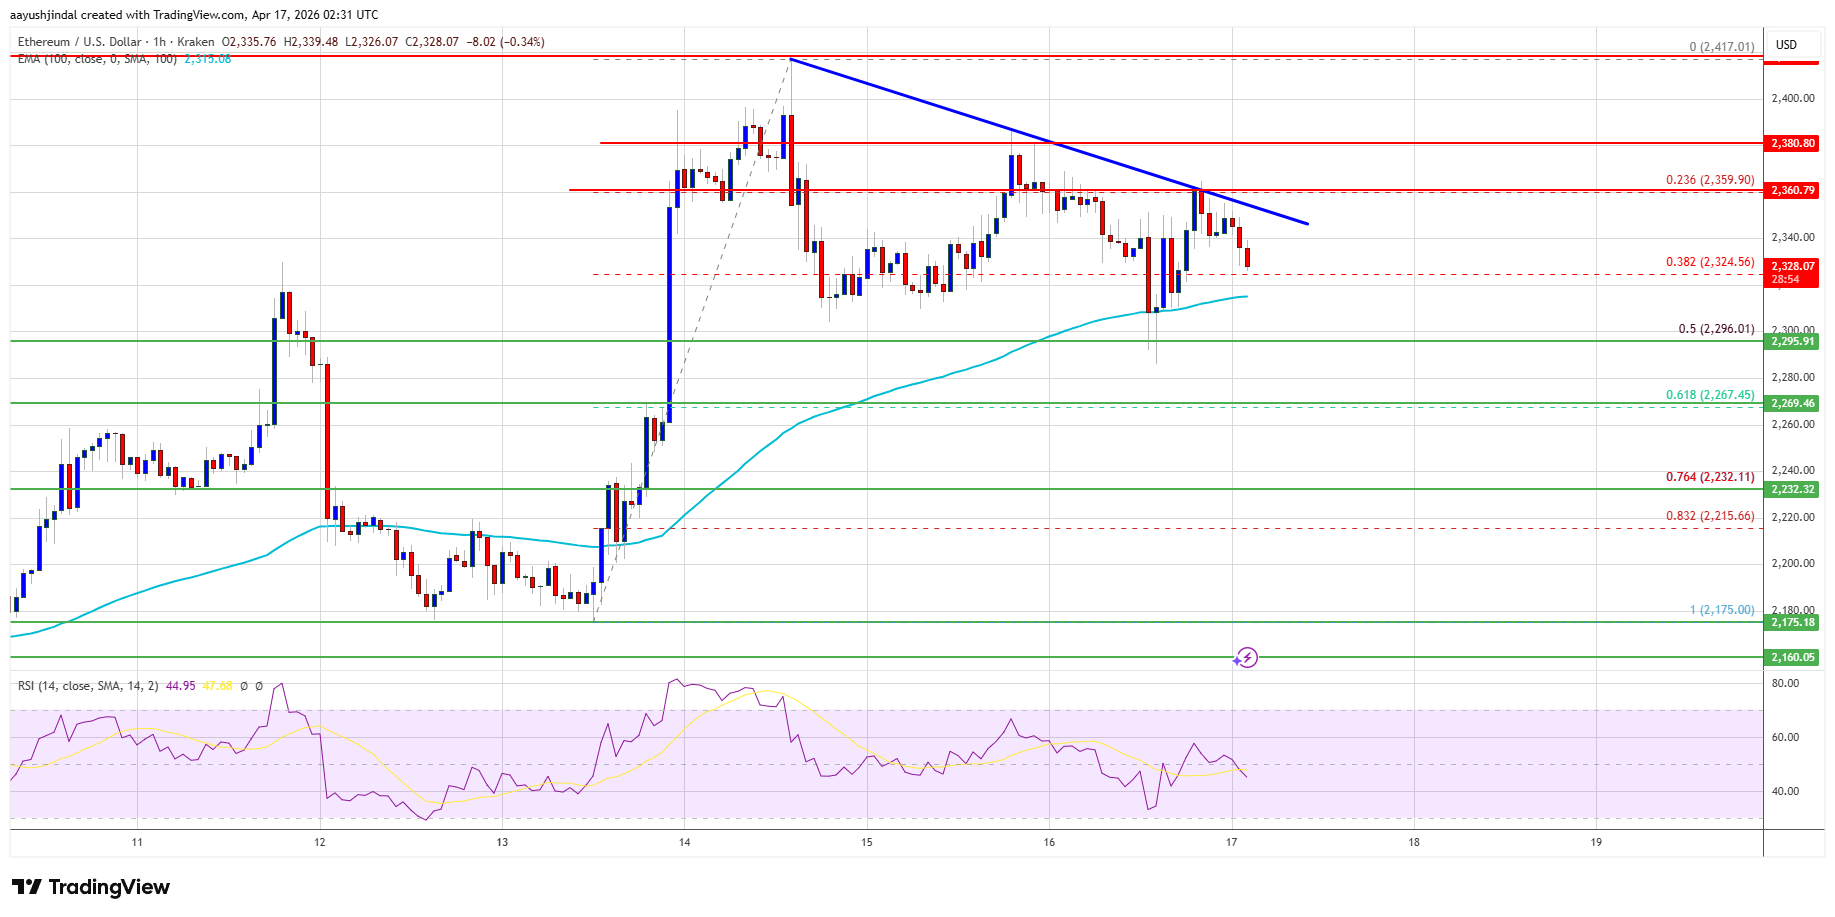
Ethereum price started a downside correction after it failed near $2,400. ETH is now consolidating and might aim for more gains if it clears $2,360.
Ethereum started a downside correction below the $2,350 zone.
The price is trading above $2,300 and the 100-hourly Simple Moving Average.
There is a bearish trend line forming with resistance at $2,360 on the hourly chart of ETH/USD (data feed via Kraken).
The pair could continue to move up if it stays above the $2,295 zone.
Ethereum Price Aims Key Upside Break
Ethereum price managed to stay above the $2,250 support and started a fresh increase, like Bitcoin. ETH price gained pace for a move above $2,320 and $2,350.
However, the bears were active near $2,400. The last swing high was formed at $2,417 before there was a downside correction. The price dipped below the $2,320 level. The price even tested the 50% Fib retracement level of the upward move from the $2,180 swing low to the $2,417 high.
Ethereum price is now trading above $2,300 and the 100-hourly Simple Moving Average. If the bulls remain in action above $2,295, the price could attempt another increase.
Immediate resistance is seen near the $2,360 level. There is also a bearish trend line forming with resistance at $2,360 on the hourly chart of ETH/USD. The first key resistance is near the $2,380 level. The next major resistance is near the $2,420 level. A clear move above the $2,420 resistance might send the price toward the $2,450 resistance. An upside break above the $2,450 region might call for more gains in the coming days. In the stated case, Ether could rise toward the $2,500 resistance zone or even $2,550 in the near term.
Another Decline In ETH?
If Ethereum fails to clear the $2,360 resistance, it could start a downside correction. Initial support on the downside is near the $2,295 level. The first major support sits near the $2,265 zone or the 61.8% Fib retracement level of the upward move from the $2,180 swing low to the $2,417 high.
A clear move below the $2,265 support might push the price toward the $2,220 support. Any more losses might send the price toward the $2,200 region. The main support could be $2,150.
Technical Indicators
Hourly MACD – The MACD for ETH/USD is losing momentum in the bullish zone.
Hourly RSI – The RSI for ETH/USD is now below the 50 zone.
]]>https://cryptocurrencypanther.com/2026/04/17/ethereum-price-capped-at-2400-momentum-fails-to-push-higher/feed/0XRP Price Surges Above Key Level, Bulls Take Full Control
https://cryptocurrencypanther.com/2026/04/17/xrp-price-surges-above-key-level-bulls-take-full-control/
https://cryptocurrencypanther.com/2026/04/17/xrp-price-surges-above-key-level-bulls-take-full-control/#respondFri, 17 Apr 2026 05:04:46 +0000https://cryptocurrencypanther.com/2026/04/17/xrp-price-surges-above-key-level-bulls-take-full-control/
Aayush Jindal, a luminary in the world of financial markets, whose expertise spans over 15 illustrious years in the realms of Forex and cryptocurrency trading. Renowned for his unparalleled proficiency in providing technical analysis, Aayush is a trusted advisor and senior market expert to investors worldwide, guiding them through the intricate landscapes of modern finance with his keen insights and astute chart analysis.
From a young age, Aayush exhibited a natural aptitude for deciphering complex systems and unraveling patterns. Fueled by an insatiable curiosity for understanding market dynamics, he embarked on a journey that would lead him to become one of the foremost authorities in the fields of Forex and crypto trading. With a meticulous eye for detail and an unwavering commitment to excellence, Aayush honed his craft over the years, mastering the art of technical analysis and chart interpretation. As a software engineer, Aayush harnesses the power of technology to optimize trading strategies and develop innovative solutions for navigating the volatile waters of financial markets. His background in software engineering has equipped him with a unique skill set, enabling him to leverage cutting-edge tools and algorithms to gain a competitive edge in an ever-evolving landscape.
In addition to his roles in finance and technology, Aayush serves as the director of a prestigious IT company, where he spearheads initiatives aimed at driving digital innovation and transformation. Under his visionary leadership, the company has flourished, cementing its position as a leader in the tech industry and paving the way for groundbreaking advancements in software development and IT solutions.
Despite his demanding professional commitments, Aayush is a firm believer in the importance of work-life balance. An avid traveler and adventurer, he finds solace in exploring new destinations, immersing himself in different cultures, and forging lasting memories along the way. Whether he’s trekking through the Himalayas, diving in the azure waters of the Maldives, or experiencing the vibrant energy of bustling metropolises, Aayush embraces every opportunity to broaden his horizons and create unforgettable experiences.
Aayush’s journey to success is marked by a relentless pursuit of excellence and a steadfast commitment to continuous learning and growth. His academic achievements are a testament to his dedication and passion for excellence, having completed his software engineering with honors and excelling in every department.
At his core, Aayush is driven by a profound passion for analyzing markets and uncovering profitable opportunities amidst volatility. Whether he’s poring over price charts, identifying key support and resistance levels, or providing insightful analysis to his clients and followers, Aayush’s unwavering dedication to his craft sets him apart as a true industry leader and a beacon of inspiration to aspiring traders around the globe.
In a world where uncertainty reigns supreme, Aayush Jindal stands as a guiding light, illuminating the path to financial success with his unparalleled expertise, unwavering integrity, and boundless enthusiasm for the markets.
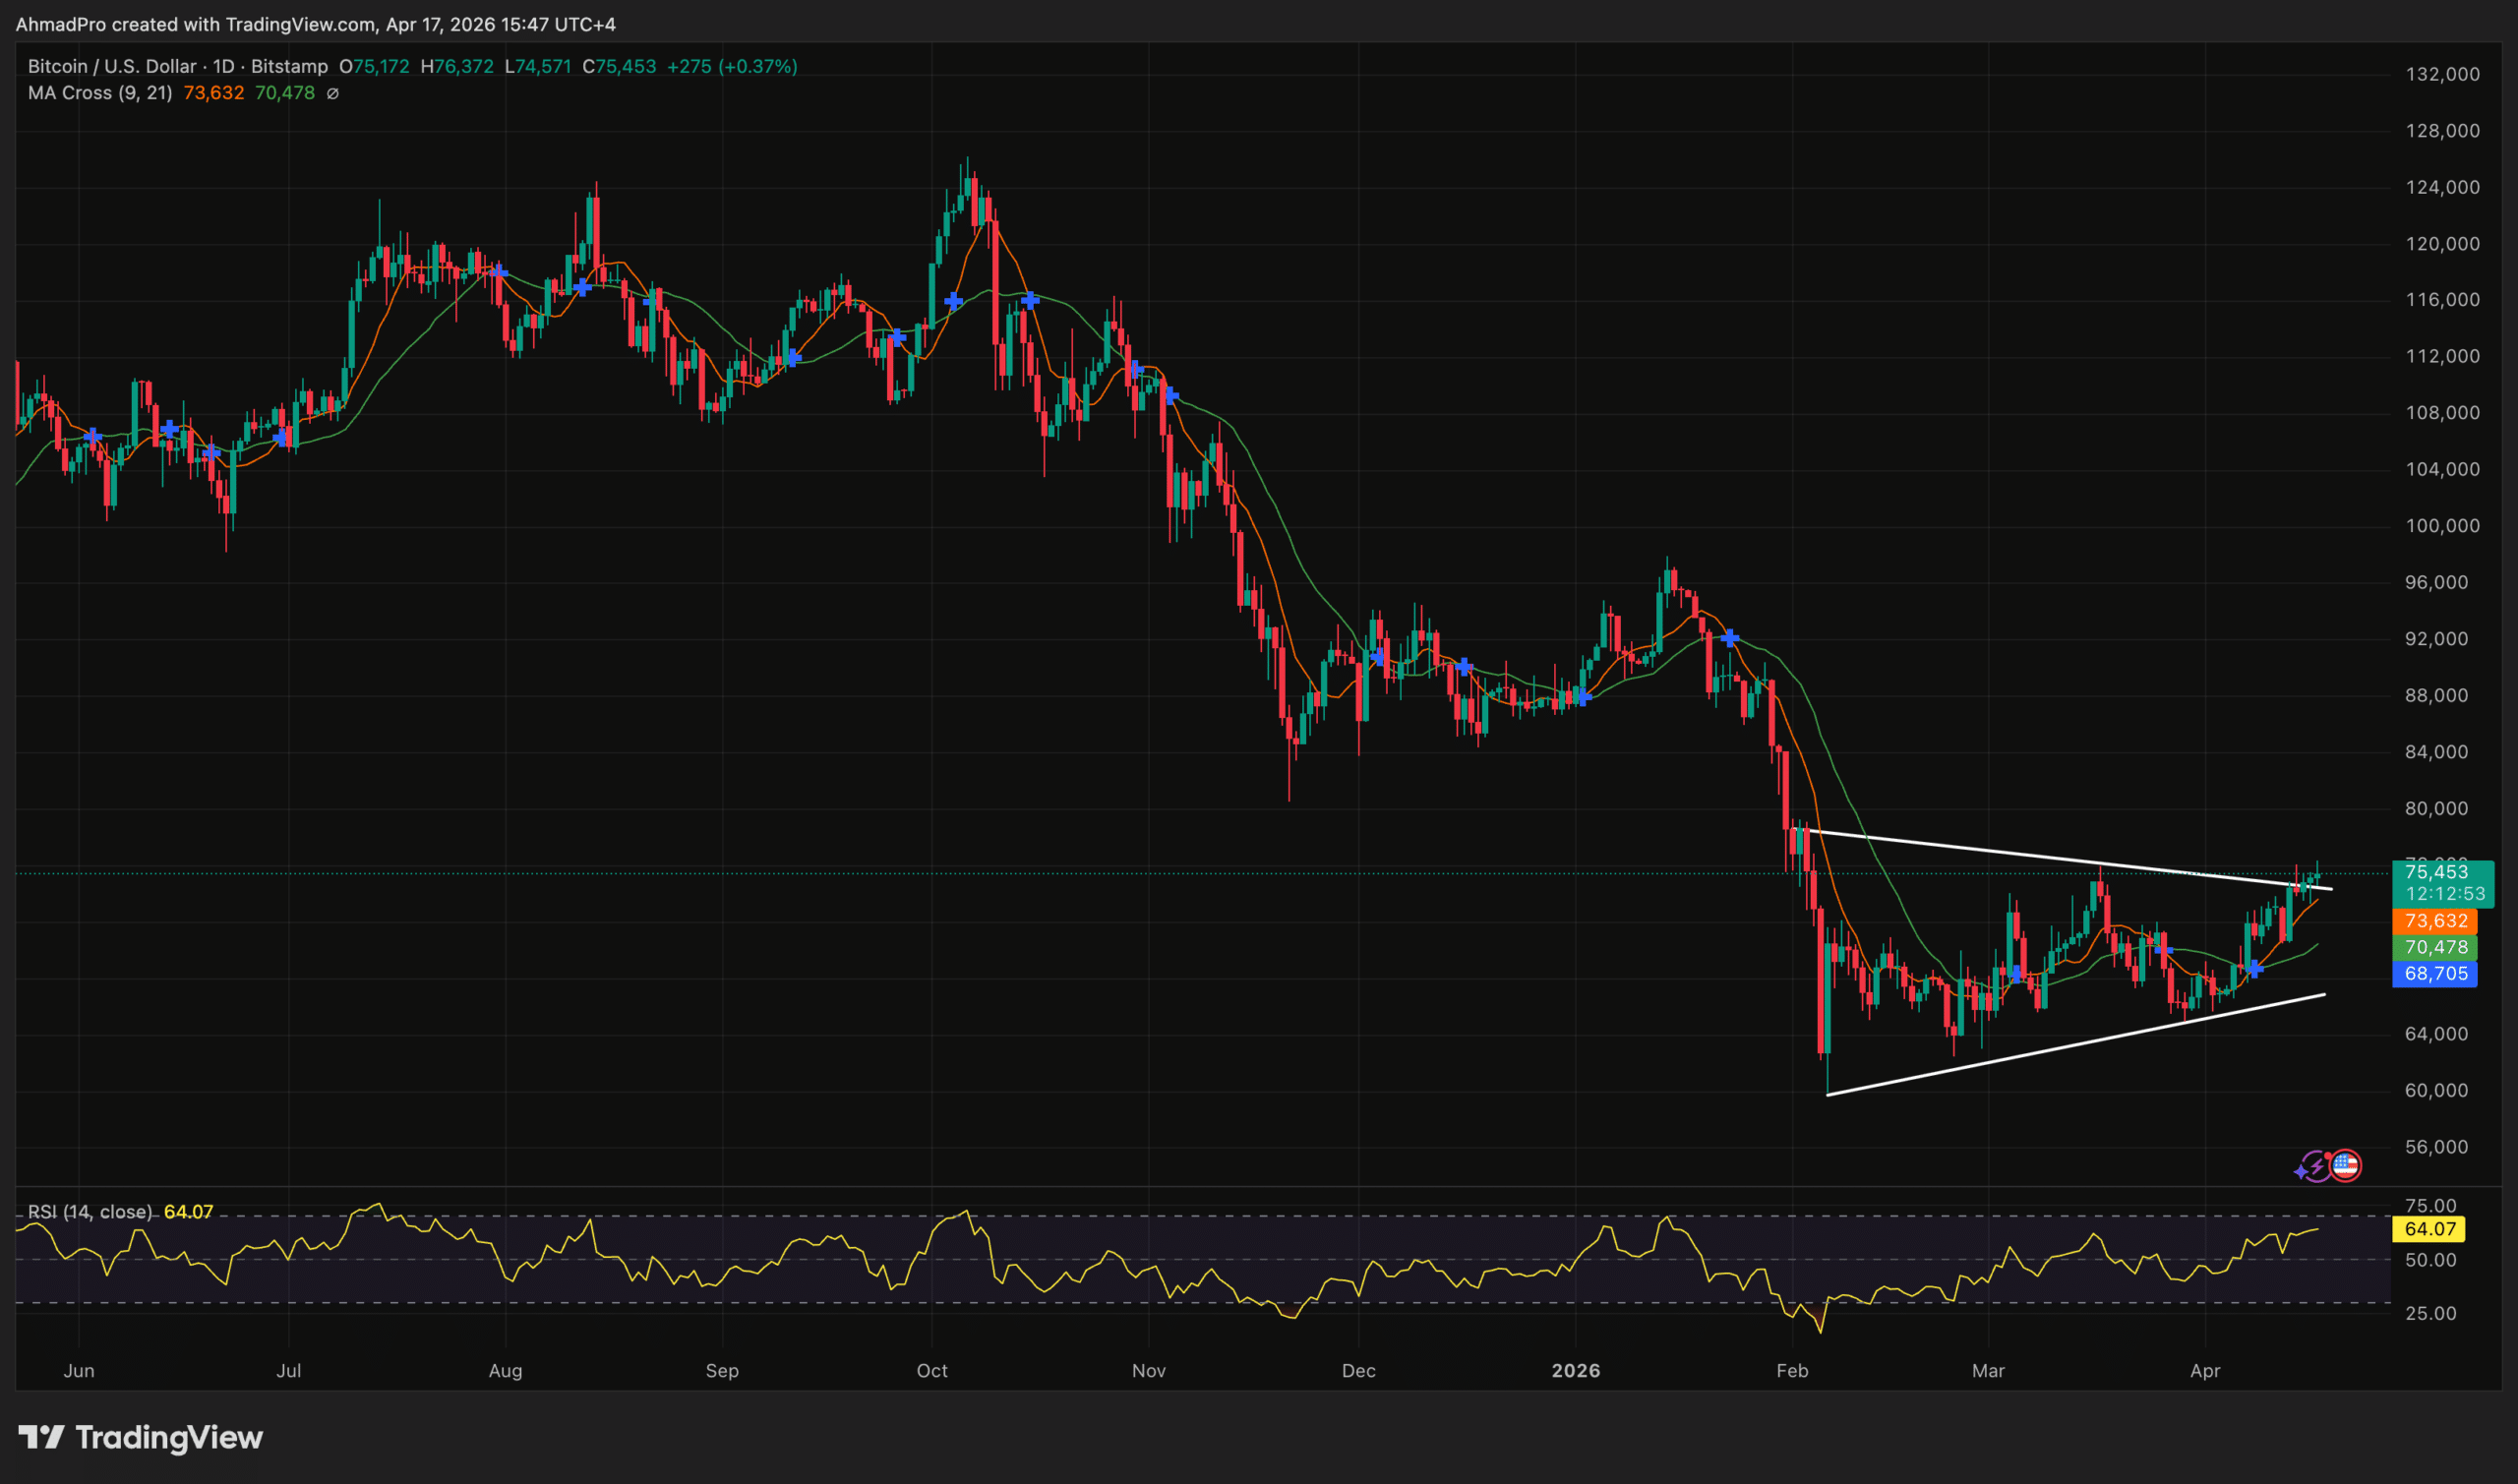
Bitcoin price started a fresh increase and cleared the $74,650 zone. BTC is consolidating and might aim for more gains above the $75,500 level.
Bitcoin managed to stay above $73,500 and started a fresh increase.
The price is trading above $74,200 and the 100 hourly simple moving average.
There was a break above a bearish trend line with resistance at $74,800 on the hourly chart of the BTC/USD pair (data feed from Kraken).
The pair might extend gains if it stays above the $73,650 and $73,300 levels.
Bitcoin Price Eyes Upside Break
Bitcoin price found support near $73,200 and started a fresh increase. BTC gained pace for a move above the $73,650 and $74,000 resistance levels.
There was a break above a bearish trend line with resistance at $74,800 on the hourly chart of the BTC/USD pair. A high was formed at $75,500, and the price is now correcting gains. There was a move below the 23.6% Fib retracement level of the upward move from the $73,310 swing low to the $75,500 high.
Bitcoin is now trading above $74,200 and the 100 hourly simple moving average. If the price remains stable above $73,800, it could attempt a fresh increase. Immediate resistance is near the $75,000 level. The first key resistance is near the $75,500 level. A close above the $75,500 resistance might send the price further higher. In the stated case, the price could rise and test the $76,200 resistance. Any more gains might send the price toward the $77,400 level. The next barrier for the bulls could be $78,000.
Another Drop In BTC?
If Bitcoin fails to rise above the $75,000 resistance zone, it could start another decline. Immediate support is near the $74,150 level and the 61.8% Fib retracement level of the upward move from the $73,310 swing low to the $75,500 high. The first major support is near the $73,650 level.
The next support is now near the $73,300 zone. Any more losses might send the price toward the $72,000 support in the near term. The main support now sits at $71,200, below which BTC might struggle to recover in the near term.
Technical indicators:
Hourly MACD – The MACD is now losing pace in the bullish zone.
Hourly RSI (Relative Strength Index) – The RSI for BTC/USD is now below the 50 level.
Major Support Levels – $73,650, followed by $73,300.
]]>https://cryptocurrencypanther.com/2026/04/17/bitcoin-price-builds-strength-75k-break-could-trigger-surge/feed/0XRP Locked In Range, But Here’s What Happening Underneath
https://cryptocurrencypanther.com/2026/04/16/xrp-locked-in-range-but-heres-what-happening-underneath/
https://cryptocurrencypanther.com/2026/04/16/xrp-locked-in-range-but-heres-what-happening-underneath/#respondThu, 16 Apr 2026 23:59:47 +0000https://cryptocurrencypanther.com/2026/04/16/xrp-locked-in-range-but-heres-what-happening-underneath/
XRP may appear stuck in a frustrating range, but beneath the surface, important signals are beginning to take shape. As prices compress and key levels hold, shifting momentum and developing patterns suggest that a larger move could be building just out of sight.
68 Days Of Consolidation: XRP Still Stuck Below Resistance
XRP continues to navigate a period of significant stagnation, now marking its 68th consecutive day ranging below a primary resistance level. According to analyst CasiTrades, while the daily price action may feel volatile to some, the overarching macro perspective remains unchanged. The asset is currently caught in a prolonged phase of sideways movement, designed to test the patience of investors before a decisive trend is established.
Two potential macro scenarios currently dictate the path forward for XRP. To flip the market bullish, the asset needs to achieve a clean break and hold above the $1.65 level, which aligns with the .618 Fibonacci retracement. Conversely, if the market loses its current footing, the analyst is watching for a deeper correction into macro support zones located at $1.09 and $0.87, representing the .786 and .854 levels, respectively.
On a more local timeframe, XRP is effectively trapped within a very tight corridor that is generating significant market chop. A floor of support defines this immediate range at $1.28 and a ceiling of resistance at $1.39.
A critical pivot point to watch is the $1.28 local support. CasiTrades suggests that if this level fails to hold, the market should expect a swift continuation toward the deeper macro supports mentioned previously. Until then, the current environment remains a test of discipline, with the analyst maintaining that the broader plan is simply waiting for the inevitable breakout.
Bullish Divergence Indicates Momentum Shift
In a recent XRP update, analyst JD highlighted the formation of a potential bullish divergence developing alongside a falling wedge pattern, two technical signals that often point toward a possible trend reversal. The structure suggests that despite the ongoing consolidation, underlying momentum may be quietly shifting in favor of the bulls.
According to JD, a confirmed breakout from the falling wedge, particularly if supported by a surge in volume, could act as a strong catalyst for upside expansion. In that scenario, price is expected to move toward the updated green box target zone, where significant profit-taking is planned, similar to the move toward $3.37.
On the flip side, if XRP breaks out and taps into the pink box zone, it could present a high-conviction accumulation opportunity. Such a move would likely be used to build larger positions, positioning for a potential breakout and sustained rally once the broader structure resolves.
]]>https://cryptocurrencypanther.com/2026/04/16/xrp-locked-in-range-but-heres-what-happening-underneath/feed/0XRP Price Upside Rejected, Momentum Shifts Back to Sellers
https://cryptocurrencypanther.com/2026/04/16/xrp-price-upside-rejected-momentum-shifts-back-to-sellers/
https://cryptocurrencypanther.com/2026/04/16/xrp-price-upside-rejected-momentum-shifts-back-to-sellers/#respondThu, 16 Apr 2026 16:52:08 +0000https://cryptocurrencypanther.com/2026/04/16/xrp-price-upside-rejected-momentum-shifts-back-to-sellers/
Aayush Jindal, a luminary in the world of financial markets, whose expertise spans over 15 illustrious years in the realms of Forex and cryptocurrency trading. Renowned for his unparalleled proficiency in providing technical analysis, Aayush is a trusted advisor and senior market expert to investors worldwide, guiding them through the intricate landscapes of modern finance with his keen insights and astute chart analysis.
From a young age, Aayush exhibited a natural aptitude for deciphering complex systems and unraveling patterns. Fueled by an insatiable curiosity for understanding market dynamics, he embarked on a journey that would lead him to become one of the foremost authorities in the fields of Forex and crypto trading. With a meticulous eye for detail and an unwavering commitment to excellence, Aayush honed his craft over the years, mastering the art of technical analysis and chart interpretation. As a software engineer, Aayush harnesses the power of technology to optimize trading strategies and develop innovative solutions for navigating the volatile waters of financial markets. His background in software engineering has equipped him with a unique skill set, enabling him to leverage cutting-edge tools and algorithms to gain a competitive edge in an ever-evolving landscape.
In addition to his roles in finance and technology, Aayush serves as the director of a prestigious IT company, where he spearheads initiatives aimed at driving digital innovation and transformation. Under his visionary leadership, the company has flourished, cementing its position as a leader in the tech industry and paving the way for groundbreaking advancements in software development and IT solutions.
Despite his demanding professional commitments, Aayush is a firm believer in the importance of work-life balance. An avid traveler and adventurer, he finds solace in exploring new destinations, immersing himself in different cultures, and forging lasting memories along the way. Whether he’s trekking through the Himalayas, diving in the azure waters of the Maldives, or experiencing the vibrant energy of bustling metropolises, Aayush embraces every opportunity to broaden his horizons and create unforgettable experiences.
Aayush’s journey to success is marked by a relentless pursuit of excellence and a steadfast commitment to continuous learning and growth. His academic achievements are a testament to his dedication and passion for excellence, having completed his software engineering with honors and excelling in every department.
At his core, Aayush is driven by a profound passion for analyzing markets and uncovering profitable opportunities amidst volatility. Whether he’s poring over price charts, identifying key support and resistance levels, or providing insightful analysis to his clients and followers, Aayush’s unwavering dedication to his craft sets him apart as a true industry leader and a beacon of inspiration to aspiring traders around the globe.
In a world where uncertainty reigns supreme, Aayush Jindal stands as a guiding light, illuminating the path to financial success with his unparalleled expertise, unwavering integrity, and boundless enthusiasm for the markets.