Forget Shiba Inu: This Best Crypto Presale Could Turn $1.2K Into $120K Before SHIB Recovers openPR.com
Source link ]]>

- Bitcoin nears record $124K after strong September and Uptober surge.
- Institutional ETF inflows and corporate buys fuel bullish momentum.
- Analysts project $160K–$200K if demand growth continues in Q4.
Bitcoin (BTC) has stormed into the final quarter of 2025 with the kind of momentum that traders had hoped for, breaking through the $120,000 barrier and reigniting talk of fresh all-time highs.
The rally comes on the heels of a surprisingly strong September and is already being described as the early stages of what could be a historic “Uptober.”
With BTC now hovering just a few percentage points below its record high of $124,128 set in August, analysts and on-chain observers say the conditions are aligning for a drive toward $200,000 before year’s end.
Seasonal surge takes hold
September closed above $114,000, up about 5% for the month, bucking the usual trend of weakness and building a foundation for October’s breakout.
Historically, whenever September has ended in the green, the fourth quarter has delivered outsized gains, with years like 2015, 2016, 2023, and 2024 producing average rallies above 50%.
That pattern, coupled with October’s average gain of 21.8% and November’s 10.8%, has cemented “Uptober” as more than a slogan for crypto traders.
Already this month, Bitcoin has climbed nearly 10% in a week, extending a year-to-date gain of about 27%.
The proximity to its all-time high adds to the sense of inevitability that new records are within reach if demand continues to hold.
Institutions are driving BTC demand
Behind the price action, institutional activity is setting the tone.
US spot Bitcoin ETFs have pulled in billions in inflows since early September, including more than $600 million for two consecutive days and $2.25 billion over the past week.

BlackRock’s IBIT ETF has emerged as the centre of this demand, with its options open interest topping $38 billion and even surpassing Deribit, traditionally the largest derivatives venue.
Corporations are also reinforcing the bullish trend. Strategy, formerly MicroStrategy, now controls 3.2% of Bitcoin’s total supply after adding more than 11,000 coins in recent weeks.
The steady accumulation reduces exchange supply and signals confidence from long-term holders.
This kind of sustained buying creates an upward pressure that is difficult for the market to ignore.
Bitcoin technical breakout confirms the momentum
The technical picture is equally supportive. Bitcoin has decisively broken above $119,500, a resistance level that capped prices through late September.
Indicators such as the MACD and RSI are flashing bullish signals, while the price continues to trade above short-term moving averages.

Eyes are on $124,600 as the next test, with Fibonacci extensions pointing toward $128,000–$130,000 as near-term targets.
However, the bigger story is what lies beyond. JPMorgan’s latest analysis compares Bitcoin with gold and suggests a theoretical fair value of $165,000 if adoption trends converge.
Citi has also issued a 12-month target of $181,000, and Standard Chartered has gone even further, projecting that institutional flows could push Bitcoin to $200,000 by year-end.
CryptoQuant’s bull score index hovers around 40–50, the same levels seen before major breakouts in 2020 and 2024, and the firm believes Bitcoin could reach between $160,000 and $200,000 this quarter if demand persists.
The US government’s shutdown has also shaken confidence in traditional markets, pushing investors toward hard assets like Bitcoin and gold.
$200k within sight
The mix of seasonal strength, institutional inflows, technical momentum, and macro uncertainty is creating conditions unlike any Bitcoin has faced before.
With the asset just shy of its all-time high and liquidity pouring in, analysts argue that $200,000 is no longer a bold outlier but a realistic scenario if buying pressure continues through the quarter.
For now, the key question is whether Bitcoin can sustain closes above $120,000 and break decisively past $124,000.
If it does, “Uptober” may prove to be the spark that propels the world’s largest cryptocurrency into its most explosive rally yet.
Bitcoin ETF products recorded more than $2.2 billion in weekly inflows, building on the momentum of previous weeks. In light of this, the BTC Price rallied above $120,000 for the first time since August. Bitcoin ETF Inflows Hit Record $2.2 Billion Inflow According to SoSoValue data, Bitcoin ETFs recorded $2.2 billion in inflows this week,
The post Bitcoin ETFs Record $2.2B Weekly Inflows as BTC Price Surges Past $120K appeared first on CoinGape.
]]>Billionaire hedge fund manager Ray Dalio has touted Bitcoin as “alternative money” as it continues to gain global adoption. This comes as BTC’s profit-taking surges past $3.7 billion amid its new rally past $120,000. Ray Dalio Labels Bitcoin an “Alternative Money” In a recent interview, Ray Dalio described Bitcoin as an “alternative money.” He noted
The post Billionaire Ray Dalio Calls Bitcoin “Alternative Money” as BTC Profit-Taking Tops $3.7B Amid $120K Rally appeared first on CoinGape.
]]>
- Bitcoin hits $112k, fueled by institutional buying.
- Strategy added 196 BTC, increasing its holdings to 640,031 BTC.
- Analysts see potential for $120,000 but warn of volatility risks.
Bitcoin (BTC) has surged to $112k, fueled by renewed institutional interest and a significant acquisition by Strategy, the world’s largest corporate Bitcoin holder.
Strategy acquires 196 BTC, holdings hit 640,031
Strategy, formerly MicroStrategy, has announced the acquisition of 196 Bitcoin for an undisclosed amount, bringing its total holdings to 640,031 BTC, according to a Form 8-K filing.
Strategy has acquired 196 BTC for ~$22.1 million at ~$113,048 per bitcoin. As of 9/28/2025, we hodl 640,031 $BTC acquired for ~$47.35 billion at ~$73,983 per bitcoin. $MSTR $STRC $STRK $STRF $STRD https://t.co/NnmLONBsRK
— Michael Saylor (@saylor) September 29, 2025
The purchase, funded through the company’s ATM offering programs, outlines Strategy’s position as the leading corporate Bitcoin treasury, with holdings valued at approximately $71.7 billion based on current market prices.
The acquisition follows a pattern of consistent buying, with Strategy adding 850 BTC on September 22, 2025, and 525 BTC on September 15, 2025, at an average price of $114,562 per BTC.
Michael Saylor, the Executive Chairman, has a strategy of leveraging equity and debt financing to accumulate BTC which has solidified the company’s role as a Bitcoin-backed treasury model.
This latest purchase concurs with Bitcoin’s price climbing to $112,500, reflecting a 2.9% increase from $109,525.50 three days prior.
Analysts on BTC price outlook
Analysts are cautiously optimistic about Bitcoin’s price trajectory following its climb to $112,000.
The surge aligns with the Strategy’s aggressive accumulation and broader market momentum, but opinions vary on future movements.
Analysts have projected BTC could reach $150k-$200k in 2025, and institutional adoption and macroeconomic factors are seen as key tailwinds. However, some say volatility means bears may not be done yet.
QCP analysts shared their outlook
“After a volatile September, $BTC is still up more than 3% on the month. Options markets show conviction slowly returning, but the 115k level remains the hurdle to clear for a renewed uptrend.”
Bitcoin at ‘Buy’ for dip level?
According to QCP analysts, the crypto market is showing “signs of recovery” following the carnage seen the previous week. The shakeout that saw BTC trade to under $109k may nonetheless offer a buy-the-dip opportunity.
“Despite sizable ETF outflows, particularly on Friday, spot managed to hold sideways through the weekend. This points to quarter-end basis unwinds as a key driver of redemptions, with markets absorbing the selling pressure more smoothly than expected,” QCP wrote. “With spot rebounding, this week’s ETF flows could set the tone for institutional demand heading into a seasonally bullish month.”
Strategy’s consistent buying is seen as a bullish signal, with potential U.S. policies on digital assets influencing long-term price stability.
If bulls rally, Bitcoin’s ability to break past $117k will be crucial. The level marks a sizable supply wall area and will b pivotal for a breakout above $118k and retest of the $120k mark.
Key takeaways
- BTC is down by less than 1% in the last 24 hours and trading around $117k.
- The coin could target the $120k psychological level next, following a recent bullish momentum
Fed rate cut pushes BTC above $117k as bullish trend resumes
The cryptocurrency market performed excellently this week, with Bitcoin bouncing back from its Monday low of $114k to trade above $117k. The positive performance was due to macroeconomic factors, especially the Fed rate cut on Wednesday.
The rate cut allowed Bitcoin to hit the $117k level, with bulls now targeting another high around $120k in the near term. Analysts believe that the rate cut will push liquidity into the crypto market.
In an email with Coinjournal, Sergei Gorev, Head of Risk at YouHodler, stated that the Fed’s rate cut is quite an important factor for the market.
“This is a positive development for the financial and crypto markets. Cheaper money pushes the quotes higher and higher. As long as liquidity prevails in the markets, the cryptocurrency market will feel quite confident. We will soon see new historical quotes for BTC, which will also support other coins. In addition, the approval of all new altcoin ETFs will also boost inflows into some cryptocurrencies soon.”
Bitcoin bulls target $120,000
The BTC/USD 4-hour chart is bullish and efficient after Bitcoin’s price surged past its 50-day Exponential Moving Average (EMA) on September 10. It found support around the $116k level earlier this week before rallying past the $117k on Wednesday.
BTC has been consolidating around $117k over the past 24 hours, but could be set to rally higher in the near term. The RSI of 57 shows that the bulls are still in control, with the Moving Average Convergence (MACD) indicator on the same chart displaying a bullish crossover since September 6th.

If the bullish trend continues, BTC could extend its current rally towards the psychological level of $120,000. An extended bullish run would allow it to hit the $125k mark and set a new all-time high in the process.
However, if the market corrects and closes below the $116k support level, BTC could face selling pressure and extend its decline towards the next major support and TLQ zone at $113,924.
The post Bitcoin price forecast: BTC eyes $120k despite slight resistance appeared first on CoinJournal.
]]>Bitcoin options traders remain optimistic about Bitcoin reclaiming $120K after the FOMC meeting, despite broader uncertainty and volatility in markets. The crypto market awaits the Fed Interest Rate Decision and the FOMC Economic Projection release due later today for cues on market direction. Bitcoin Options Bulls Target $120K Strike Price After FOMC Meeting Bitcoin options
The post Will Bitcoin Reclaim $120K as Options Bulls Target $125K Highs Post-FOMC? appeared first on CoinGape.
]]>Bitcoin price is again rising above the $115,500 zone. BTC is now consolidating and might aim for a move toward the $120,000 resistance zone.
- Bitcoin started a fresh increase above the $115,500 zone.
- The price is trading above $115,500 and the 100 hourly Simple moving average.
- There is a key bullish trend line forming with support at $115,600 on the hourly chart of the BTC/USD pair (data feed from Kraken).
- The pair might start another increase if it clears the $117,500 resistance zone.
Bitcoin Price Aims Higher
Bitcoin price found support near the $112,200 zone and started a fresh increase. BTC was able to climb above the $113,500 and $114,800 resistance levels.
The price even cleared the $115,500 resistance to move into a positive zone. Finally, the price tested the $117,500 resistance zone. A high was formed at $117,643 and the price is now consolidating gains above the 23.6% Fib retracement level of the upward move from the $112,629 swing low to the $116,643 high.
Bitcoin is now trading above $115,000 and the 100 hourly Simple moving average. There is also a key bullish trend line forming with support at $115,600 on the hourly chart of the BTC/USD pair.
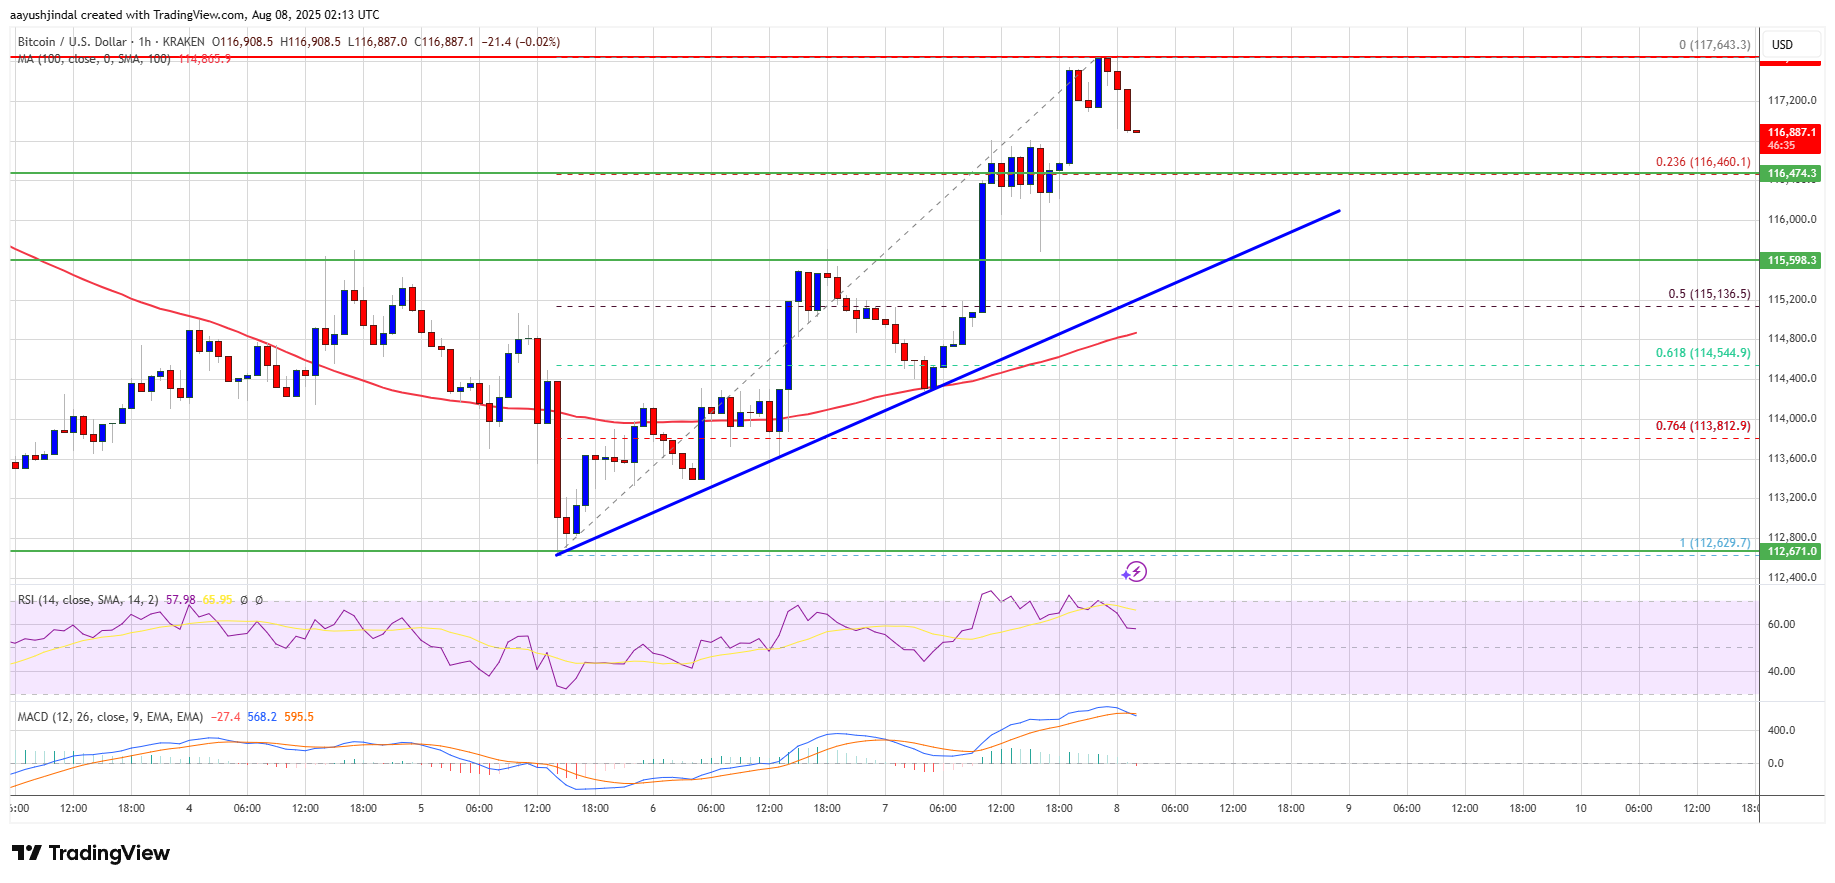
Immediate resistance on the upside is near the $117,200 level. The first key resistance is near the $117,500 level. The next resistance could be $118,250. A close above the $118,250 resistance might send the price further higher. In the stated case, the price could rise and test the $119,200 resistance level. Any more gains might send the price toward the $120,000 level. The main target could be $121,500.
Another Drop In BTC?
If Bitcoin fails to rise above the $117,500 resistance zone, it could start another decline. Immediate support is near the $116,450 level. The first major support is near the $115,600 level and the trend line.
The next support is now near the $114,550 zone or the 61.8% Fib retracement level of the upward move from the $112,629 swing low to the $116,643 high. Any more losses might send the price toward the $113,800 support in the near term. The main support sits at $112,500, below which BTC might continue to move down.
Technical indicators:
Hourly MACD – The MACD is now losing pace in the bullish zone.
Hourly RSI (Relative Strength Index) – The RSI for BTC/USD is now above the 50 level.
Major Support Levels – $115,600, followed by $114,550.
Major Resistance Levels – $117,500 and $118,250.

- The crypto rally has stalled, with Bitcoin struggling to challenge the $120K level as institutional investors take profit.
- Institutional ETF inflows into Bitcoin have plunged by 80% this week to just $496 million, a sign of cooling demand.
- Market focus is now shifting to Ether (ETH), with its capital flows seen as the key to the market’s next move.
The powerful cryptocurrency rally is showing signs of fatigue, with Bitcoin struggling to challenge the $120,000 mark and key indicators pointing to a significant pullback from institutional investors.
As the market enters a tense consolidation phase, observers say the focus is now shifting to Ether (ETH) and whether it has the strength to bring fresh capital back into the fold and reignite the bullish momentum.
After briefly touching new all-time highs last week, the crypto market has entered a period of consolidation, and the underlying data is revealing some cracks in the bullish facade.
Glassnode data highlights a dramatic cooling of institutional interest, with inflows into spot Bitcoin ETFs plunging by a staggering 80% this week to just $496 million.
This was accompanied by a sharp decline in ETF trading volume, which fell to $18.7 billion.
Bitcoin’s spot market sentiment is also showing signs of weakening.
The Relative Strength Index (RSI)—a popular technical indicator used to measure whether an asset is overbought or oversold—has been retreating sharply, underscoring a move away from previously overbought levels.
Taken together, these signals point to a clear, albeit perhaps temporary, institutional withdrawal from the market, raising questions about the potential for further downside.
A tense derivatives market: hedging and profit-taking on the rise
Trading firm QCP Capital has noted similar tensions in the derivatives market.
While funding rates for perpetual futures remain elevated at above 15%, suggesting that some traders are still maintaining aggressive long positions, recent flows indicate that large, sophisticated players are actively taking profits and hedging against potential downside.
QCP, in its recent note, pointed out that a major ETH call fly (a complex options strategy) was recently unwound, while sizeable BTC put options were bought for protection.
This is not the kind of market activity that typically supports a fresh leg up in a rally.
Despite these cautionary signals, QCP remains broadly constructive on the market’s outlook.
“Momentum, narrative strength, and macro tailwinds are still on our side,” the firm wrote in a recent update. “Hodlers and institutions will likely buy the dip, as we saw on Friday.”
The Ethereum litmus test: consolidation, capitulation, or the next leg up?
Market maker Enflux, however, isn’t sounding the alarm just yet. The firm views the current market conditions as a period of healthy consolidation, not a sign of impending capitulation.
They note that spot and perpetual futures markets are essentially treading water, not bleeding out.
The key to what comes next, according to Enflux, lies with Ethereum.
“How institutional ETH flows evolve, and whether capital re-engages with alts, would likely guide the next leg of market structure,” the firm said in a note to CoinDesk.
Ethereum now finds itself at the center of these diverging perspectives.
If institutional investors, who have been stepping back from Bitcoin, decide to rotate their capital back into the crypto market through ETH, it could reignite the altcoin cycle and lift the entire market.
If not, this period of consolidation could harden into something more prolonged and painful.
For now, the rally has paused. Glassnode sees fragility in the current market structure. Enflux sees neutrality. QCP sees a hedged optimism.
But all seem to agree that the next major breakout—or breakdown—will likely be sparked by how capital flows into and out of Ethereum materialize in the coming days and weeks.
Broader market snapshot
-
BTC: Bitcoin is trading at $118,000, consolidating between channel support at $114,000 and resistance near its all-time high of $123,000.
-
A recent liquidity sweep below $116,000 and renewed supply from a reactivated whale wallet have stalled its bullish momentum, according to CoinDesk’s market insights bot.
-
ETH: Ethereum is trading at $3,783, holding a bullish inverse head-and-shoulders pattern that technically targets the $4,300 level.
-
However, neutral funding rates near multi-year resistance suggest trader caution, even as institutional accumulation continues.
-
Gold: Gold fell to a near three-week low, with spot prices down 0.7% to $3,313.57.
-
A recent US-EU trade deal has boosted risk sentiment and temporarily reduced the demand for safe-haven assets ahead of a busy week for corporate earnings and a key US Federal Reserve meeting.
-
Nikkei 225: Asian markets opened lower, with Japan’s Nikkei 225 down 0.61% as traders adopted a wait-and-see mode to determine if more regional trade deals can be struck.
-
S&P 500: The S&P 500 ended Monday’s session nearly flat, as the positive news of a US-EU trade deal failed to ignite a significant new rally in U.S. equities.


Key takeaways
- BTC dips below $118k as altcoins record huge losses.
- The leading cryptocurrency could drop below the $116k support level if bearish sentiment grows stronger.
Bitcoin stagnates around $117k as altcoins bleed
The cryptocurrency market has been bearish over the last 24 hours after enjoying a bullish trend over the last couple of days. Bitcoin, the leading cryptocurrency by market cap, is down by less than 1% in the last 24 hours and now trades around $117k.
However, altcoins recorded heavy losses as they undergo a correction. XRP is down 11% and risks dropping below $3.0 while Ether could drop below $3,500 after losing 3% of its value.
Solana, BNB, TRX, ADA, and Dogecoin are all trading in the red. The bearish performance saw the total crypto market cap decline by 2.6% to now stand at $3.85 trillion. This comes a few days after the total crypto market cap hit a record high of $4 trillion.
BTC risks dropping below $116k if selling pressure increases
The BTC/USD 4-hour chart is bullish and efficient, suggesting that the bulls are still in control despite signs of weakness. The technical indicators remain bullish but have slowed down over the past few days.
The pair is currently consolidating and could either expand to the upside to a new all-time high or face a correction downward. BTC could likely retest the $116k support and TLQ level over the next few hours. The TLQ level could serve as a liquidity to push BTC’s price higher. However, failure to defend this level could see BTC drop lower.

The MACD lines are in the neutral zone, suggesting that the market is consolidating. The RSI of 51 also shows that buyers are losing control of the market.
If the bulls fail to defend the $116k support level, BTC could experience a sharp decline towards the next support at $112k. However, if the TLQ at $116k serves as a springboard, it would push BTC above the $120k resistance and towards a new all-time high.
