
- GRASS price drops as $80M tokens are unlocked.
- 181M tokens unlocked, raising dilution and sell-off fears.
- Technical analysis shows weak momentum but hints at a possible rebound.
The GRASS price is under heavy pressure as the market braces for a massive GRASS token unlock event.
With 181 million new tokens — worth more than $80 million — set to flood the market today at 1:30 PM UTC, investors are watching closely to see whether this move signals a deeper downturn or a short-lived shakeout before recovery.
Built on Solana, the Grass network powers a decentralised data infrastructure where users share idle bandwidth to support AI and web-scraping applications.
But despite its strong fundamentals, the latest unlock threatens to overshadow its long-term potential with short-term volatility.
GRASS price struggles under selling pressure
Over the past 24 hours, the GRASS price has fallen by 2.9% to trade near $0.41, underperforming the broader crypto market, which slipped only 0.56%.
The token is now down more than 50% in the past 30 days, reflecting rising investor anxiety ahead of the unlock.
Notably, the upcoming token release will increase the circulating supply by nearly 58%, from 243 million to roughly 424 million tokens.
This surge in available coins raises significant dilution concerns, particularly in a market already grappling with low liquidity.
Unfortunately, data shows that trading volume has dropped by more than 25% over the past week, suggesting thin demand to absorb the incoming supply.
Historically, token unlocks of this magnitude have triggered immediate price declines of 10–30% or more, as early investors and contributors take profits.
GRASS’s decline of nearly 50% over the last month fits that trend, reinforcing the perception that the market has been pricing in the unlock for weeks.
The token unlock has overshadowed Grass’s funding optimism
Earlier this month, Grass secured a $10 million funding round led by Polychain Capital and Tribe Capital to expand its decentralised AI data network.
The investment validated the project’s DePIN model and its 8.5 million active users, but market reaction was subdued.
Instead of fueling a rally, the news coincided with a 6% drop in GRASS’s value as investors focused on the looming unlock.
Part of the concern stems from the nature of the funding, which included token allocations that may add to near-term selling pressure.
As a result, even fundamentally positive developments are being viewed through a bearish lens, with traders preferring to stay on the sidelines until the post-unlock price action stabilises.
Technical outlook hints at fragile stability
Technically, GRASS remains in a pronounced downtrend.
The token trades below all major moving averages, with its 7-day SMA near $0.4266 and 30-day SMA at $0.6243.
Momentum indicators confirm weakness — RSI sits around 35, signalling oversold conditions, while MACD is attempting a modest bullish crossover.
Chart patterns point to a large descending triangle formation, with GRASS hovering close to its lower boundary.
The next major support lies at $0.3126, marking the 2024 low, while resistance is seen near $0.4694 and more prominently at $0.9 — the key point of control (POC) on the Volume Profile indicator.
A breakout above this zone could mark the beginning of a recovery phase, but until volume returns, upside potential remains limited.
Interestingly, Bitcoin’s strength over the weekend triggered a brief wave of optimism, sending GRASS higher on a large green volume candle.
However, follow-through buying has been muted, suggesting that traders are still cautious ahead of the unlock.
What to expect after the GRASS token unlock?
The immediate aftermath of the GRASS token unlock will determine whether this event deepens the sell-off or serves as a reset for future growth.
If selling pressure spikes, GRASS could test new lows below $0.31.
However, if buyers absorb the new supply and RSI begins to recover, a short-term rebound toward resistance near $0.47 may follow.
While GRASS’ fundamentals, anchored in decentralised AI data infrastructure, remain solid, the market’s focus is squarely on supply dynamics and investor sentiment for now.
As the flood of tokens hits exchanges, GRASS will need a compelling proof of demand to convince traders that the worst is behind it.
BDAG Tops $18.1M; Outcasts Cardano & Polygon Prediction 2024 Crypto Reporter
Source link ]]>
On-chain data shows Ethereum has observed a large exchange outflow recently, a sign that buying may be going on in the market.
Ethereum Exchange Supply Hits Lowest In 5.5 Years After $181 Million Outflow
According to data from the on-chain analytics firm Santiment, ETH has just witnessed its largest exchange outflow day since August 21st. The indicator of interest here is the “supply on exchanges,” which keeps track of the total amount of Ethereum that’s currently sitting in the wallets of all centralized exchanges.
When the value of the metric goes down, it means that a net number of coins is exiting these platforms currently. Generally, investors take their coins off these central entities toward self-custodial wallets when they plan to hold onto them for extended periods, so this kind of trend can be a sign that HODLing is happening in the market.
On the other hand, the indicator’s value rising implies deposits are moving toward the exchanges right now. Investors may make such transfers for a variety of purposes, one of which could be selling, so such a trend can sometimes be a signal that a price correction could be coming soon.
There is also a counterpart indicator to the supply on exchanges: the “supply outside of exchanges,” which is pretty self-explanatory; it measures the total amount of supply sitting inside self-custodial wallets.
Now, here is a chart that shows the trend in the Ethereum supply on exchanges, as well as in the supply outside of these platforms, over the past few months:
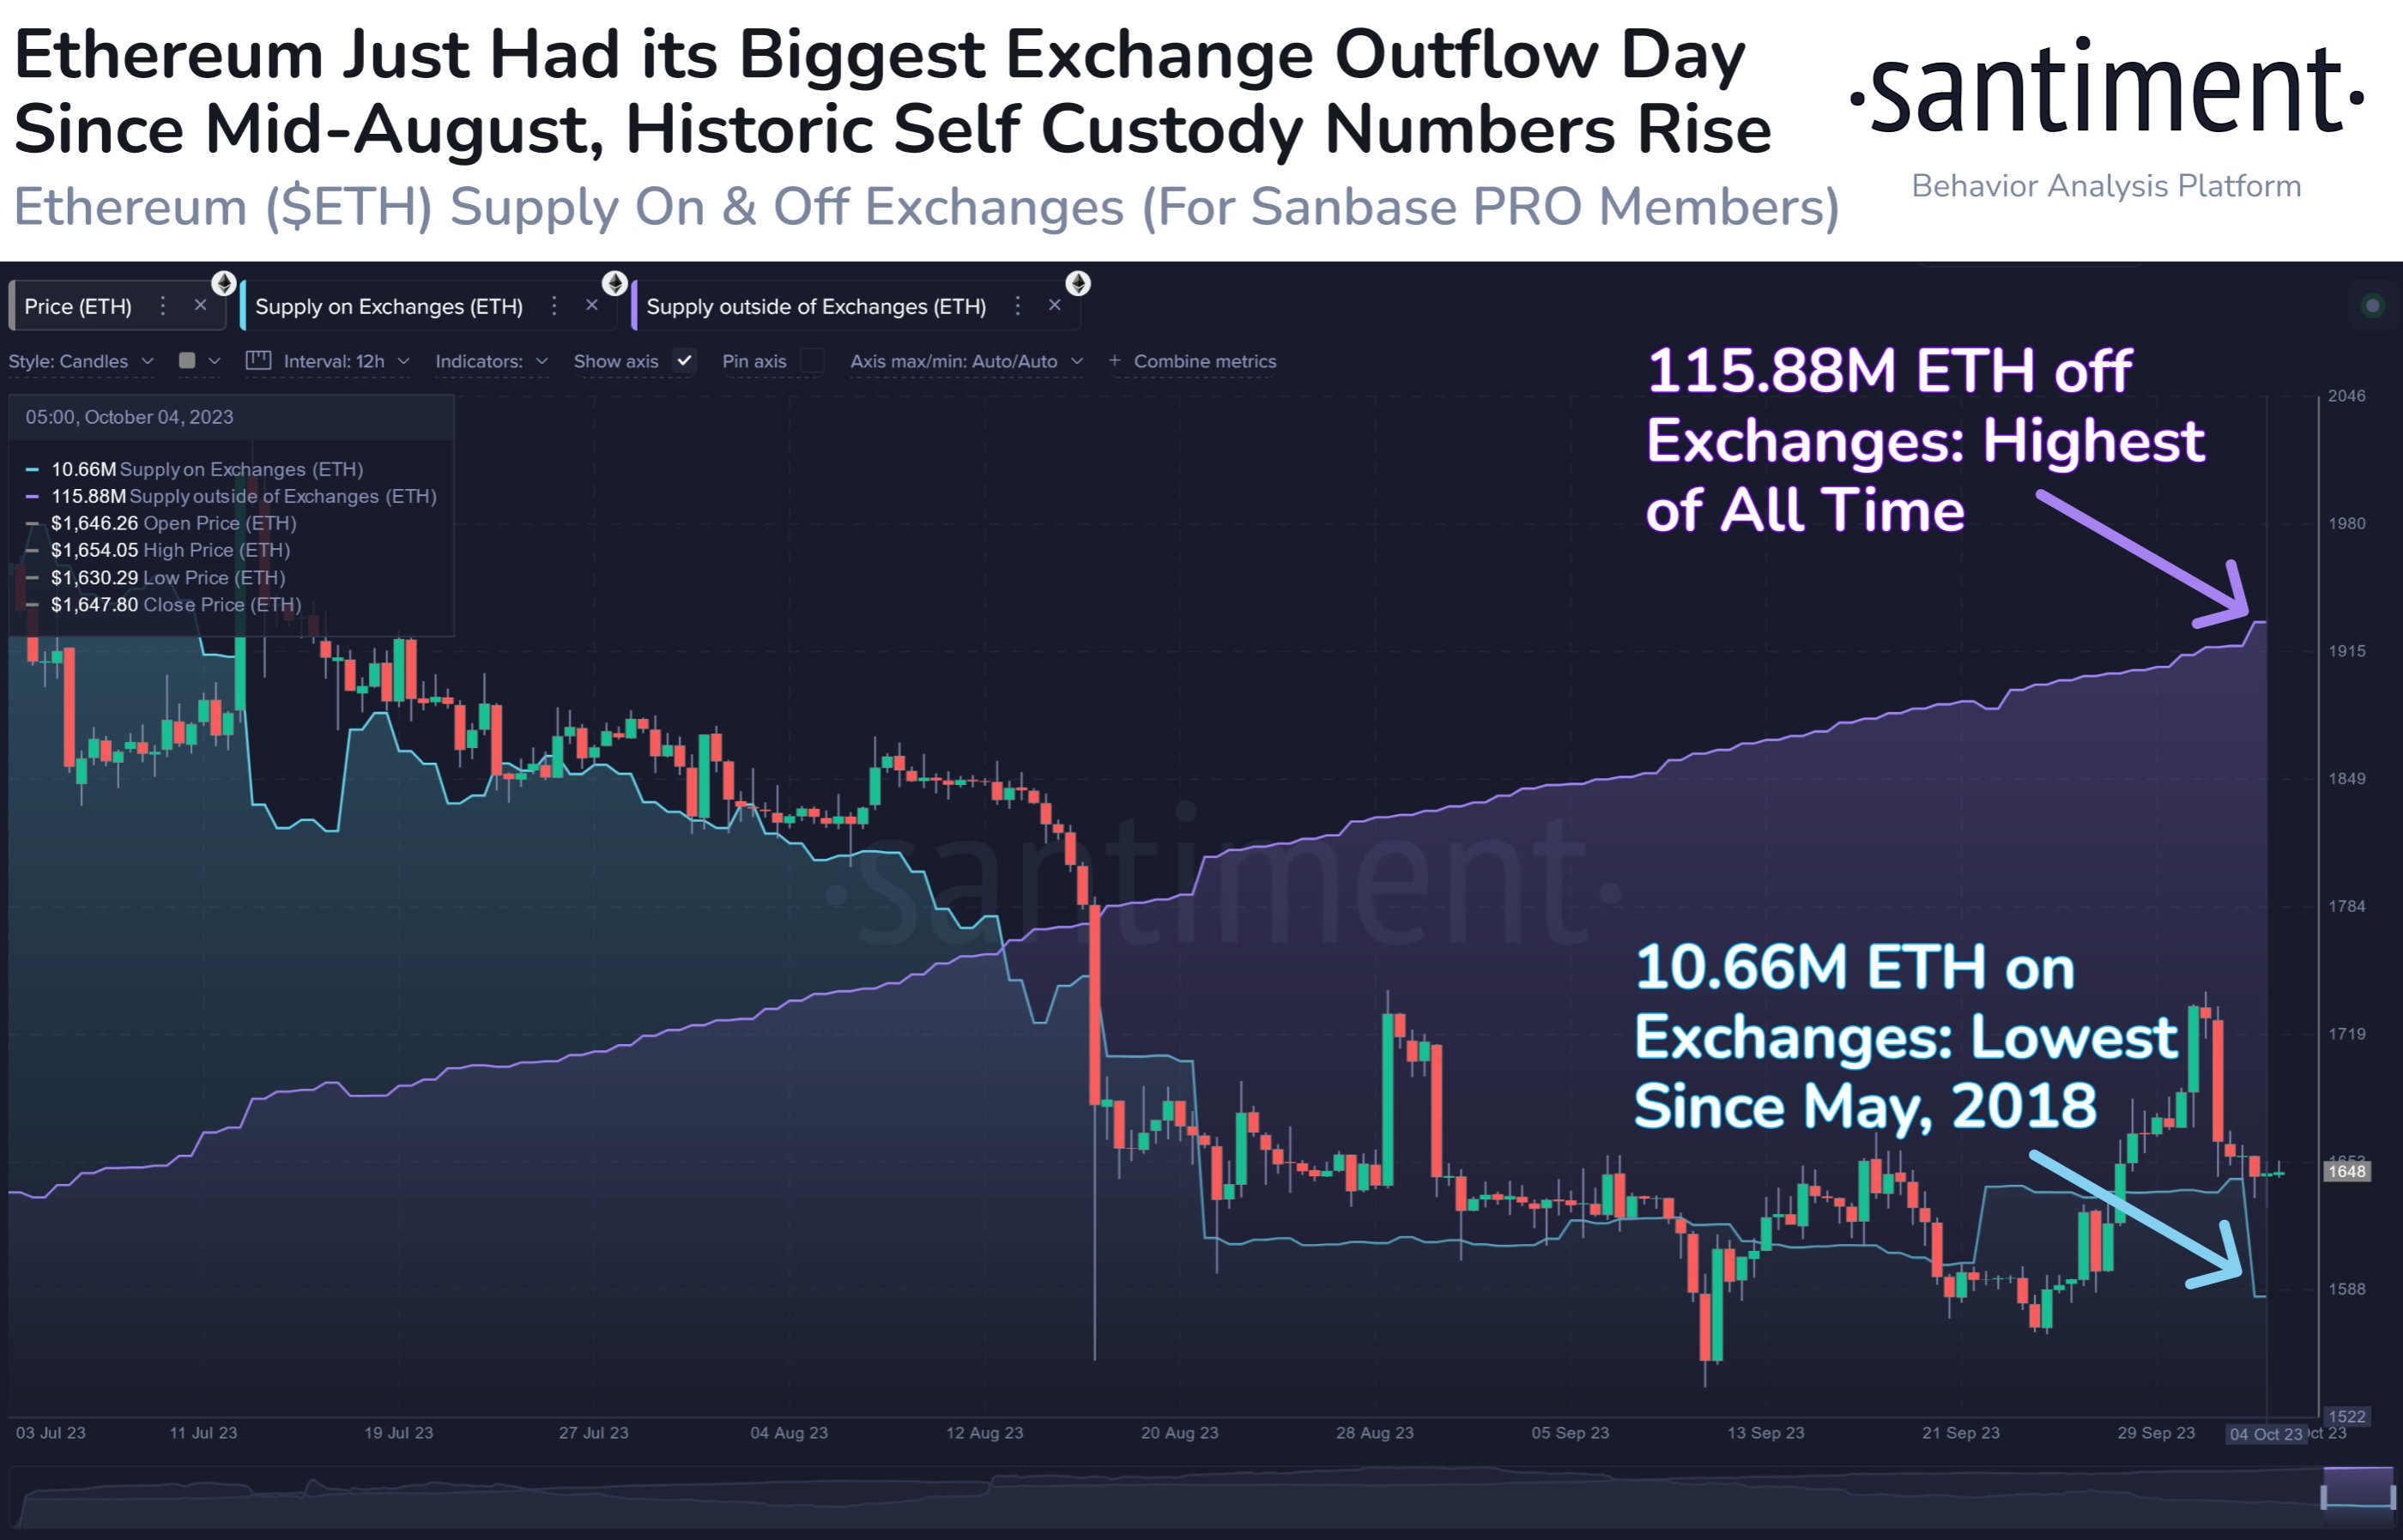
The value of the two metrics has gone opposite ways in recent days | Source: Santiment on X
As shown in the above graph, the Ethereum supply on exchanges has seen a sharp plunge recently, as a large net outflow has occurred on these platforms. Naturally, a spike in the supply outside of exchanges occurred alongside this plunge, as supply transferred towards that side.
In these latest withdrawals, investors took out 110,000 ETH (worth around $181 million at the current exchange rate) towards self-custodial entities, leading to the supply on exchanges dropping to its lowest point since May 2018.
These outflows have come after the price of the asset has registered a pullback following its recent surge above the $1,700 mark, making it possible that these withdrawals are a sign of a net amount of buying activity taking place at the current prices.
From the chart, it’s visible that the supply outside of exchanges has been on a perpetual uptrend, regardless of whatever behavior the supply on exchanges has been showing.
This is obviously because of the fact that new ETH is constantly being minted in the form of validator rewards, so the total supply is always heading up. Since the newly minted supply counts under self-custody, it makes sense that that the supply outside of exchanges would keep showing overall growth.
ETH Price
Ethereum has been consolidating near the $1,600 level since the failed recovery attempt a few days back.
ETH has been moving sideways since its pullback | Source: ETHUSD on TradingView
Featured image from Kanchanara on Unsplash.com, charts from TradingView.com, Santiment.net