Dogecoin Price Turns Bullish With 1-Day RSI In Oversold Region, Why DOGE Can Reach $0.9 NewsBTC
Source link ]]>
Ethereum’s price action is showing signs of an impending breakout as it moves back and forth within a falling wedge pattern on the daily candlestick time frame chart. According to an analysis first posted on the TradingView platform, this formation is a strong bullish signal that could push the Ethereum price toward $3,800 if history repeats itself.
The falling wedge, which is generally known to be a bullish price action structure, is developing between the 50-day and 200-day moving averages for Ethereum, in line with a similar pattern from that preceded an Ethereum price rally last year.
Ethereum Repeating Falling Wedge Pattern
Ethereum has largely underperformed this cycle without any clear breakout yet. Furthermore, the cryptocurrency has yet to recover towards its 2021 all-time high unlike many of its other crypto counterparts with large market caps.
Related Reading
Technical analysis of the current Ethereum price action shows that the leading altcoin has been trading in a decline since the beginning of the year. This decline has been characterized by the formation of lower highs and lower lows, which is quite like a falling wedge pattern. What’s very interesting is that this wedge pattern on the Ethereum price chart is developing between the 50-day and 200-day moving averages, which makes it even more peculiar.
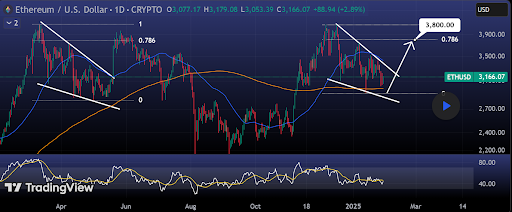
The TradingView analyst highlighted that the current falling wedge price structure mirrors the March 2024 pattern, which saw Ethereum forming a triple bottom before breaking out and reaching the 0.786 Fibonacci extension level. If the same scenario unfolds, the current falling wedge could serve as a launchpad for a price surge towards a target at the $3,800 level. This represents a potential 20% upside from Ethereum’s current trading range.
Resistance Levels Could Delay the Rally
At the time of writing, Ethereum is trading at $3,180, up 1% in the past 24 hours. This marks a steady climb from the lower end of the wedge pattern, bringing the cryptocurrency closer to breaking above the upper trendline around $3,250.
Related Reading
While the technical setup leans bullish after the predicted breakout, it is important to note that Ethereum faces a significant resistance hurdle between $3,400 and $3,500. Sellers positioned at this resistance zone have acted as a strong barrier in recent months, and they have successfully stalled previous attempts by the bulls to push higher.
If Ethereum fails to break through the upper end of this range, another temporary rejection could occur before any sustained move toward $3,800.
If Ethereum successfully clears the $3,500 resistance, it could pave the way for a more extended bullish trend, with $3,800 as the next logical target. Notably, this $3,800 target reflects a tempered outlook on Ethereum compared to past market expectations, a sentiment shaped by its recent price action. However, if strong bullish momentum builds toward $3,800, it could trigger an even larger push toward the $4,000 mark.
Featured image from Unsplash, chart from Tradingview.com
A crypto analyst has issued a new XRP price prediction, forecasting a potential breakout that could see the prominent cryptocurrency skyrocketing to $4.9. With the formation of a classic bull flag pattern and the 1-Day 50 Moving Average (MA) acting as a bullish catalyst, the analyst is increasingly confident that XRP will reach new All-Time Highs (ATH) in 2025.
How The 1-Day 50 MA Will Propel XRP Price To $4.93
The 50-day MA is a technical indicator used to track the average closing price of a cryptocurrency over the last 50 trading days. According to Dr. Dovetail, a TradingView crypto analyst, the 1-day 50 MA, indicated by the orange line in his XRP price chart, has risen to the lower boundary of a bull flag pattern.
Related Reading
The analyst suggested that XRP’s price action, which has been in a consolidation phase after its big pump, triggered the formation of the classic bull flag pattern. This bullish continuation pattern typically occurs after a strong upward movement, followed by a price correction that leads to consolidation.
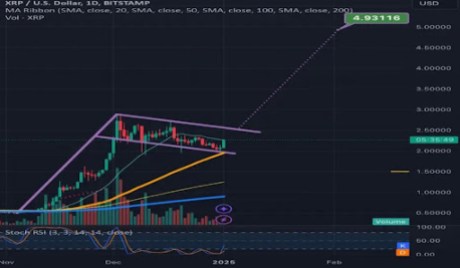
Historically, when a cryptocurrency consolidates near strong moving averages like the 1-day 50 MA, it indicates the readiness for a price breakout. Looking at his technical chart, the 1-day 50 MA plays a crucial role in Dr. Dovetail’s analysis and bullish XRP price prediction. The analyst believes this Moving Average can push the XRP price out of its consolidation nest to its next bullish target.
Based on the confluence of technical patterns and indicators, the dotted ascending line in the analyst’s XRP chart indicates a potential price target of $4.93. Dr. Dovetail extended his forecast, highlighting that XRP could achieve this ambitious all-time high before February 2025.
The XRP price chart has also indicated a volume bar showing relatively stable activity during the cryptocurrency’s consolidation phase. Additionally, the Stochastic Relative Strength Index (RSI) at the bottom of the chart suggests that XRP may be oversold, supporting the potential for a breakout.
While Dr. Dovetail acknowledged that his predictions were not financial advice, the TradingView analyst expressed confidence that the current technical setup in the XRP chart could push its price to $4.93 this year. This target would represent a 105% surge from XRP’s current market value, underscoring a significant move upward from its consolidation phase.
Related Reading
Update On XRP Price Analysis
According to data from CoinMarketCap, the XRP price is presently trading at $2.41, marking a noteworthy 8.79% increase over the past week. Delving deeper into its price action and ongoing consolidation phase, XRP experienced a severe downturn after it surged from $0.5 to above $2 in November 2024.
Over the past few weeks, the cryptocurrency has struggled with volatility as it aims to reclaim its all-time high of $3.84, attained during the 2021 bull run. Nevertheless, XRP still holds its position as the third-largest cryptocurrency by market capitalization.
Featured image created with Dall.E, chart from Tradingview.com
Despite the dominant bearish trend in the market, the well-known meme-based cryptocurrency Dogecoin (DOGE) is making an effort to recover. This unanticipated upward trend occurs even though sentiment and general market conditions are still primarily negative. Traders and investors are keeping a careful eye on the situation as DOGE attempts to make up some lost ground, trying to decipher what this possible turnaround might mean.
Several factors could be driving this attempt at recovery, including market reactions to news events, changes in investor sentiment, or technical indicators signaling oversold conditions. However, the question remains: can DOGE sustain this rebound and reverse the bearish trend, or is this merely a temporary uptick before further declines?
This introduction delves into the dynamics behind DOGE’s current price action and explores what investors might expect in the near future.
As of this writing, DOGE has a market capitalization of over $20 billion, a trading volume of over $715 million, and a price increase of 1.33%, trading at around $0.14297 over the past 24 hours. The market capitalization and trading volume of DOGE has experienced a decline of 0.73% and 43.92%, respectively.
DOGE Upswing Analyzed
While the price of DOGE is currently trading below the 100-day Simple Moving Average (SMA), an analysis of the price movement on the 4-hour chart shows that DOGE is attempting an upswing by dropping bullish candlesticks.
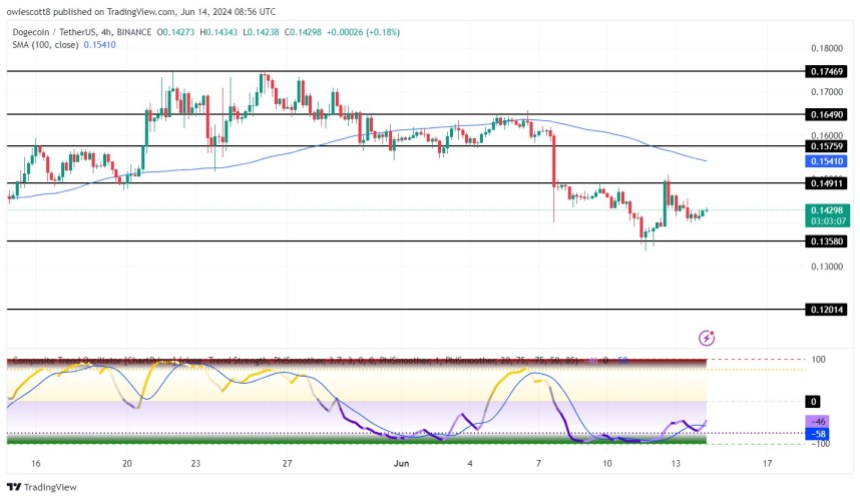
Also, given that the 4-hour composite trend oscillator indicator’s signal line has crossed above the SMA and is moving towards the zero line, it supports the previous assertion that the price of DOGE may increase.
On the 1-day chart, DOGE’s price is attempting a bullish move by developing a bullish candlestick while trading below the 1-day SMA. What this indicates is that DOGE’s price may move upward and at some point, it might start to decline again.
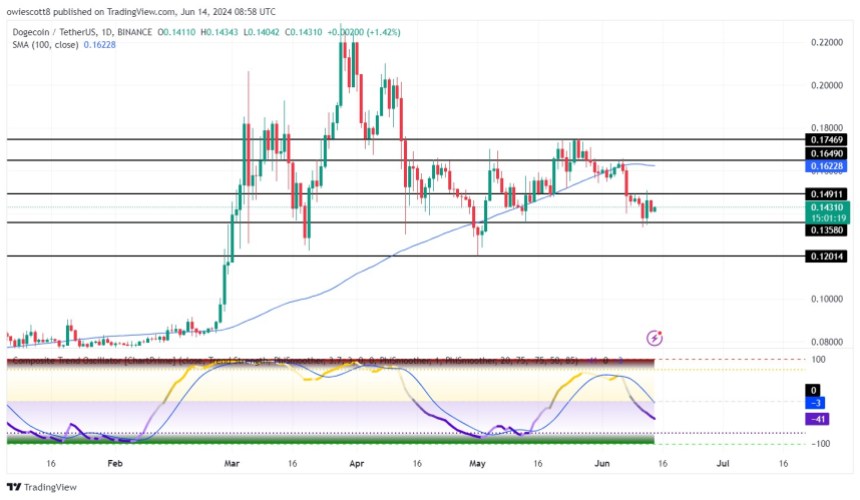
The signal line and SMA of the composite trend oscillator indicator on the 1-day chart have made a cross and are attempting a drop below the zero line. This supports the above claim that at some point DOGE’s price might begin to drop again.
Bullish Or Bearish Trajectory?
If this upswing continues, the price of DOGE will advance towards the $0.14911 resistance level, despite DOGE’s continued pessimistic outlook. DOGE might climb higher to challenge the resistance level of $0.16490 if it breaks above the $0.14911 level. Should there be a break above the previously indicated level, the crypto asset may turn bullish.
There is a tendency that DOGE’s price will begin to decline toward the $0.13580 support level if it fails to break above the $0.14911 level. The crypto asset will decline further to challenge the $0.12014 support level in the event of a break below the $0.13580 level and even other levels after that.
Featured image from iStock, chart from Tradingview.com
Shiba Inu Slides In Tandem With Dogecoin Following 1-Day Crypto … The Florida Star
Source link ]]>
Shiba Inu Slides In Tandem With Dogecoin Following 1-Day Crypto Rally: The Bull, Bear Case Benzinga
Source link ]]>