Notice: Function _load_textdomain_just_in_time was called incorrectly. Translation loading for the updraftplus domain was triggered too early. This is usually an indicator for some code in the plugin or theme running too early. Translations should be loaded at the init action or later. Please see Debugging in WordPress for more information. (This message was added in version 6.7.0.) in /home/aonyeani76/cryptocurrencypanther/wp-includes/functions.php on line 6131
Notice: Function _load_textdomain_just_in_time was called incorrectly. Translation loading for the hustle domain was triggered too early. This is usually an indicator for some code in the plugin or theme running too early. Translations should be loaded at the init action or later. Please see Debugging in WordPress for more information. (This message was added in version 6.7.0.) in /home/aonyeani76/cryptocurrencypanther/wp-includes/functions.php on line 6131
Notice: Function _load_textdomain_just_in_time was called incorrectly. Translation loading for the wpforms-lite domain was triggered too early. This is usually an indicator for some code in the plugin or theme running too early. Translations should be loaded at the init action or later. Please see Debugging in WordPress for more information. (This message was added in version 6.7.0.) in /home/aonyeani76/cryptocurrencypanther/wp-includes/functions.php on line 6131 24K – Cryptocurrencypanther
https://cryptocurrencypanther.com
Latest Crypto NewsThu, 15 May 2025 21:30:03 +0000en-US
hourly
1 https://wordpress.org/?v=6.9.4https://cryptocurrencypanther.com/wp-content/uploads/2021/07/cropped-Cryptocurrency-e1626714913653-32x32.png24K – Cryptocurrencypanther
https://cryptocurrencypanther.com
3232Ethereum Eyes $2.4K Retest – Analyst Sets Key Levels To Watch
https://cryptocurrencypanther.com/2025/05/15/ethereum-eyes-2-4k-retest-analyst-sets-key-levels-to-watch/
https://cryptocurrencypanther.com/2025/05/15/ethereum-eyes-2-4k-retest-analyst-sets-key-levels-to-watch/#respondThu, 15 May 2025 21:30:03 +0000https://cryptocurrencypanther.com/2025/05/15/ethereum-eyes-2-4k-retest-analyst-sets-key-levels-to-watch/
Reason to trust
Strict editorial policy that focuses on accuracy, relevance, and impartiality
Created by industry experts and meticulously reviewed
The highest standards in reporting and publishing
Strict editorial policy that focuses on accuracy, relevance, and impartiality
Morbi pretium leo et nisl aliquam mollis. Quisque arcu lorem, ultricies quis pellentesque nec, ullamcorper eu odio.
After several days of intense buying pressure and strong bullish momentum, Ethereum has finally paused its rally, finding resistance around the $2,740 mark. The move comes after ETH effortlessly cleared key resistance levels at $2,000 and $2,200, marking one of its strongest short-term performances in months. As excitement builds across the broader crypto market, Ethereum’s next move could define the strength and sustainability of this breakout.
Related Reading
With price now stalling, analysts believe a period of consolidation is likely—and perhaps even necessary—before the next leg higher. Top analyst Daan shared a technical view suggesting that the $2,400 level will be crucial in the coming days. He believes it makes sense to retest that local support, which would provide a healthier structure for further upside.
However, Daan also notes a cautionary signal: extremely high levels of Open Interest across the ETH derivatives market. He’s currently avoiding long positions until some of that leverage is flushed out, reducing the risk of a sharper pullback. For now, Ethereum bulls must hold above $2,400 to confirm strength and keep the uptrend intact, while traders await cleaner conditions for potential reentry.
Ethereum’s Surge Faces a Crucial Retest Around $2.4K
Ethereum has surged more than 50% since last week, reclaiming momentum after months of heavy selling pressure. ETH is showing sustained strength for the first time since late December, fueling optimism that the broader altcoin market could be next. Many analysts are calling for an altseason, and Ethereum’s breakout is seen as a potential catalyst for a larger move across altcoins that have severely underperformed in recent years.
However, after such a sharp move, a period of consolidation or correction wouldn’t be unusual—and could even be healthy. According to Daan, the $2,400 level will be a key support zone to watch. He believes it makes sense for price to test this area before further continuation. Daan currently has no interest in entering long positions until some of the billions in Open Interest are flushed from the system. How Ethereum reacts around $2.4K will likely set the tone for the next phase.
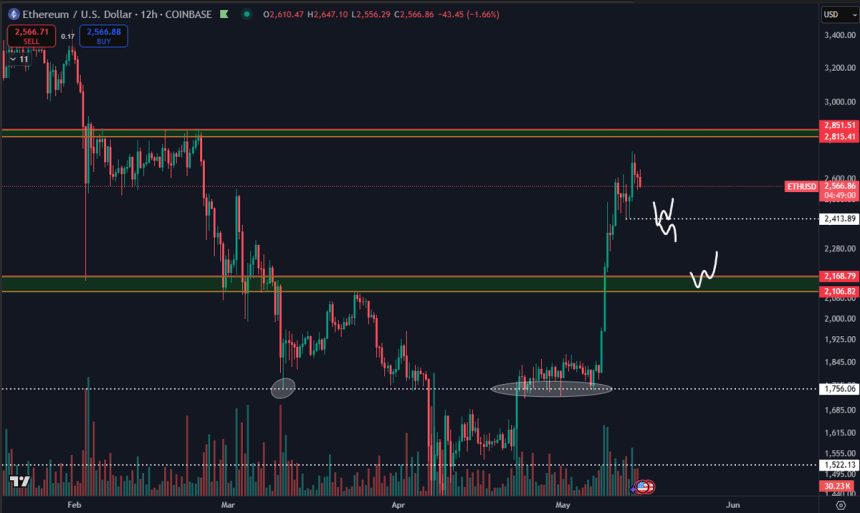
Ethereum looking for key liquidity levels | Source: Daan on X
If ETH sweeps $2.4K and quickly bounces, Daan expects a local range to form between $2.4K and $2.7K. However, if price loses that level decisively, the next major support lies at $2.1K. A slow bleed into that zone could signal weakness, while a quick flush might present a short-lived buying opportunity.
Despite short-term risks, Daan notes that even a pullback to $2.1K would still leave ETH up roughly 20% from the prior week. In his view, the larger trading range for now is between $2.1K and $2.8K—a zone that could define Ethereum’s next major trend if bulls can hold key levels and regain momentum. For now, the rally is alive, but the next test will be critical.
Related Reading
Price Consolidation Taking Place Amid Optimism
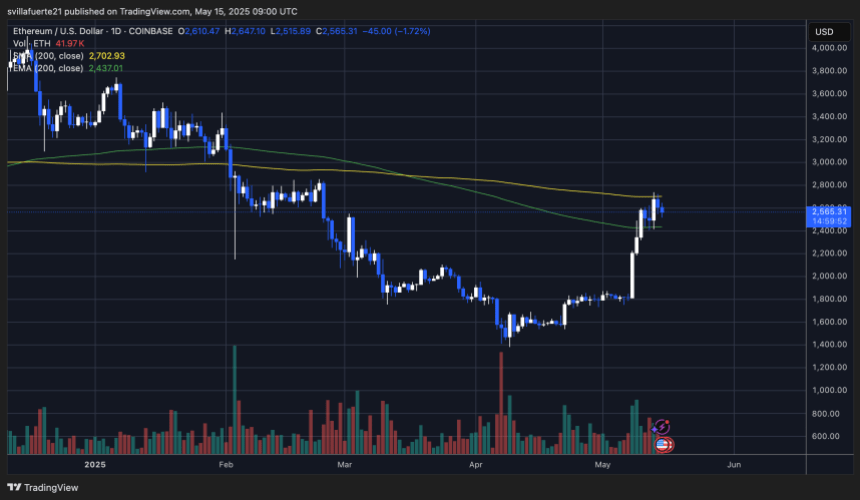
Ethereum (ETH) is currently trading around $2,565, following a sharp retracement from its recent local high near $2,740. After a powerful rally that pushed ETH above both the 200-day exponential moving average (EMA) and simple moving average (SMA), the price is now consolidating just below the 200-day SMA at $2,702.93. This level has acted as resistance over the last few sessions, capping Ethereum’s attempt to continue its upward momentum.
Volume has declined slightly, reflecting market indecision after last week’s breakout. If bulls can defend the 200-day EMA near $2,437 and maintain higher lows above $2,500, the structure would remain bullish. However, a failure to hold these levels could lead to a deeper pullback, with $2,400 and $2,200 as potential supports.
The recent price action suggests Ethereum is forming a short-term range between $2,400 and $2,700, which could persist until a clear breakout above the 200-day SMA. Holding above $2,500 is crucial to maintaining bullish momentum, especially as the altcoin market eyes further gains.
Related Reading
If ETH can push above $2,700 with strong volume, it would confirm renewed strength and open the path toward the $3,000–$3,100 resistance zone. Until then, consolidation and caution dominate the short-term outlook.
Featured image from Dall-E, chart from TradingView
]]>https://cryptocurrencypanther.com/2025/05/15/ethereum-eyes-2-4k-retest-analyst-sets-key-levels-to-watch/feed/0Mt Gox Moves 24K BTC As Bitcoin Tops $100K, What’s Happening?
https://cryptocurrencypanther.com/2024/12/05/mt-gox-moves-24k-btc-as-bitcoin-tops-100k-whats-happening/
https://cryptocurrencypanther.com/2024/12/05/mt-gox-moves-24k-btc-as-bitcoin-tops-100k-whats-happening/#respondThu, 05 Dec 2024 09:49:52 +0000https://cryptocurrencypanther.com/2024/12/05/mt-gox-moves-24k-btc-as-bitcoin-tops-100k-whats-happening/
Beleaguered crypto exchange Mt Gox’s BTC transfer grabbed significant investor attention despite a strong sentiment in the crypto market. Notably, on-chain data on Thursday indicated that the bankrupt crypto exchange moved a staggering 24K BTC after BTC price topped $100K. This transaction fueled skepticism among investors over potential creditor repayment plans.
According to data from Spot on Chain on December 5, Mt. Gox shifted 24,052 BTC worth a whopping $2.43 billion to a new wallet “1N7jW.” This transaction promptly followed Bitcoin’s price topping $100K, garnering notable attention. Although speculations of the wallet being an internal address loom, market watchers remain apprehensive as the defunct exchange has yet to pay its creditors.
Further, on-chain data also pointed out that the exchange held 15,826 BTC, worth $1.63 billion, across 31 known wallet addresses to date. Besides, it’s worth mentioning that CoinGape reported Mt Gox to have moved 2,570 Bitcoins the previous month. Overall, the massive shift of funds amid ongoing creditor repayment plans remains a hot buzz in the market, with the abovementioned transfers further weighing in.
Bitcoin Tops $100K
At the time of reporting, BTC price gained nearly 5% intraday and is currently trading at $101.688. Its intraday low and high were $94,660.52 and $103,900.47. Notably, the flagship crypto surge came in response to Donald Trump’s pro-crypto policies. A recent CoinGape report further revealed that Donald Trump finally announced Paul Atkins to serve as new SEC Chair, sparking crypto market optimism.
Also, Coinglass showed a 9% increase in Bitcoin futures OI to $64.62 billion. Further, the derivatives volume soared 95% to $154.09 billion. Overall, this data flags heightened investor interest in the asset amid market maneuvers in its favor.
Simultaneously, top crypto market analyst Ali Martinez reiterated in an X post amid this rising movement, revealing that the coin further eyes a $135,000 or even $159,000 target before a sharp 15-30% correction. This bullish anticipation rides the back of historical trends. Market enthusiasts continue to eye the flagship crypto for further price action shifts as Mt Gox continues to move heavy amounts amid a strong broader market. Notably, creditors may decide to sell their holdings if BTC dips under $100K.
✓ Share:
Coingape Staff
CoinGape comprises an experienced team of native content writers and editors working round the clock to cover news globally and present news as a fact rather than an opinion. CoinGape writers and reporters contributed to this article.
Disclaimer: The presented content may include the personal opinion of the author and is subject to market condition. Do your market research before investing in cryptocurrencies. The author or the publication does not hold any responsibility for your personal financial loss.
]]>https://cryptocurrencypanther.com/2024/12/05/mt-gox-moves-24k-btc-as-bitcoin-tops-100k-whats-happening/feed/0Cardano Hits 24K Smart Contracts, Up By 67% in 2024 – Crypto Times
https://cryptocurrencypanther.com/2024/01/24/cardano-hits-24k-smart-contracts-up-by-67-in-2024-crypto-times/
https://cryptocurrencypanther.com/2024/01/24/cardano-hits-24k-smart-contracts-up-by-67-in-2024-crypto-times/#respondWed, 24 Jan 2024 19:49:47 +0000https://cryptocurrencypanther.com/2024/01/24/cardano-hits-24k-smart-contracts-up-by-67-in-2024-crypto-times/
Source link
]]>https://cryptocurrencypanther.com/2024/01/24/cardano-hits-24k-smart-contracts-up-by-67-in-2024-crypto-times/feed/0Bitcoin Price Prints Bearish Technical Pattern, Why It Could Drop To $24K
https://cryptocurrencypanther.com/2023/09/12/bitcoin-price-prints-bearish-technical-pattern-why-it-could-drop-to-24k/
https://cryptocurrencypanther.com/2023/09/12/bitcoin-price-prints-bearish-technical-pattern-why-it-could-drop-to-24k/#respondTue, 12 Sep 2023 03:58:04 +0000https://cryptocurrencypanther.com/2023/09/12/bitcoin-price-prints-bearish-technical-pattern-why-it-could-drop-to-24k/
Bitcoin price broke the key $25,350 support. BTC is now consolidating near $25,000 and remains at a risk of more downsides in the near term.
Bitcoin traded below the $25,600 and $25,350 support levels.
The price is trading below $25,600 and the 100 hourly Simple moving average.
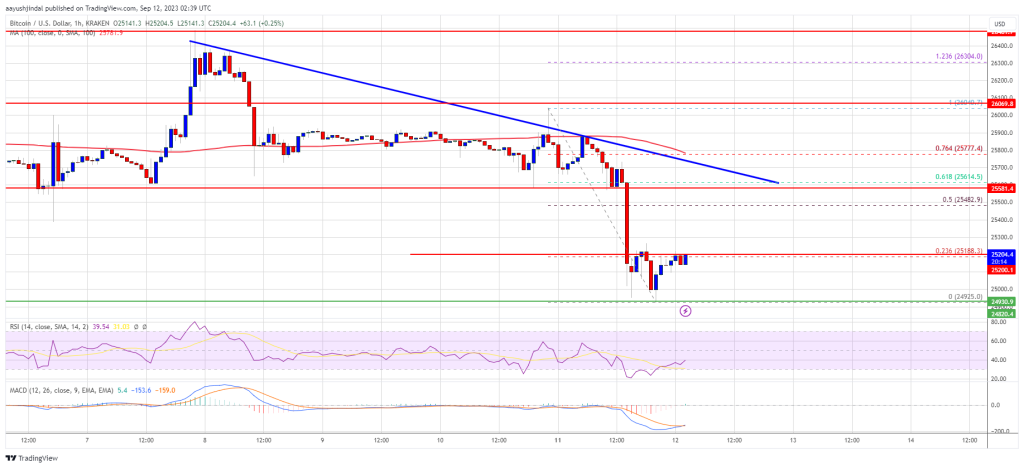
There is a major bearish trend line forming with resistance near $25,620 on the hourly chart of the BTC/USD pair (data feed from Kraken).
The pair could continue to move down if it stays below the $25,600 resistance.
Bitcoin Price Breaks Key Support
Bitcoin price failed to start a recovery wave and extended its decline below the $25,600 support. BTC even broke the $25,350 support and moved into a bearish zone.
The price even spiked below the $25,000 level. A low is formed near $24,925 and the price is now consolidating losses. Bitcoin is now trading below $25,600 and the 100 hourly Simple moving average. Besides, there is a major bearish trend line forming with resistance near $25,620 on the hourly chart of the BTC/USD pair.
Immediate resistance on the upside is near the $25,200 level. It is near the 23.6% Fib retracement level of the downward move from the $26,040 swing high to the $24,925 low.
The first major resistance is near the $25,600 level or the trend line. The trend line is near the 61.8% Fib retracement level of the downward move from the $26,040 swing high to the $24,925 low. The next key resistance is near $26,000.
A proper close above the $26,000 level might start a decent increase. The next major resistance is near $26,200, above which the bulls could gain strength. In the stated case, the price could test the $26,500 level.
More Losses In BTC?
If Bitcoin fails to recover the $25,600 resistance, it could continue to move down. Immediate support on the downside is near the $25,000 level.
The next major support is near the $24,800 level. A downside break and close below the $24,800 level might call for more downsides. In the stated case, the price could drop toward $24,500 or even $24,000.
Technical indicators:
Hourly MACD – The MACD is now losing pace in the bearish zone.
Hourly RSI (Relative Strength Index) – The RSI for BTC/USD is now below the 50 level.
Major Support Levels – $25,000, followed by $24,800.
Major Resistance Levels – $25,200, $25,600, and $26,000.
]]>https://cryptocurrencypanther.com/2023/09/12/bitcoin-price-prints-bearish-technical-pattern-why-it-could-drop-to-24k/feed/0Bitcoin Price Plunges Further Post Fed Decision, $24K Next?
https://cryptocurrencypanther.com/2023/06/15/bitcoin-price-plunges-further-post-fed-decision-24k-next/
https://cryptocurrencypanther.com/2023/06/15/bitcoin-price-plunges-further-post-fed-decision-24k-next/#respondThu, 15 Jun 2023 03:17:47 +0000https://cryptocurrencypanther.com/2023/06/15/bitcoin-price-plunges-further-post-fed-decision-24k-next/
Bitcoin price started a fresh decline below the $25,500 support. BTC is now at a risk of more losses toward the $24,000 support zone.
Bitcoin is gaining bearish momentum below the $25,500 support.
The price is trading below $25,500 and the 100 hourly Simple moving average.
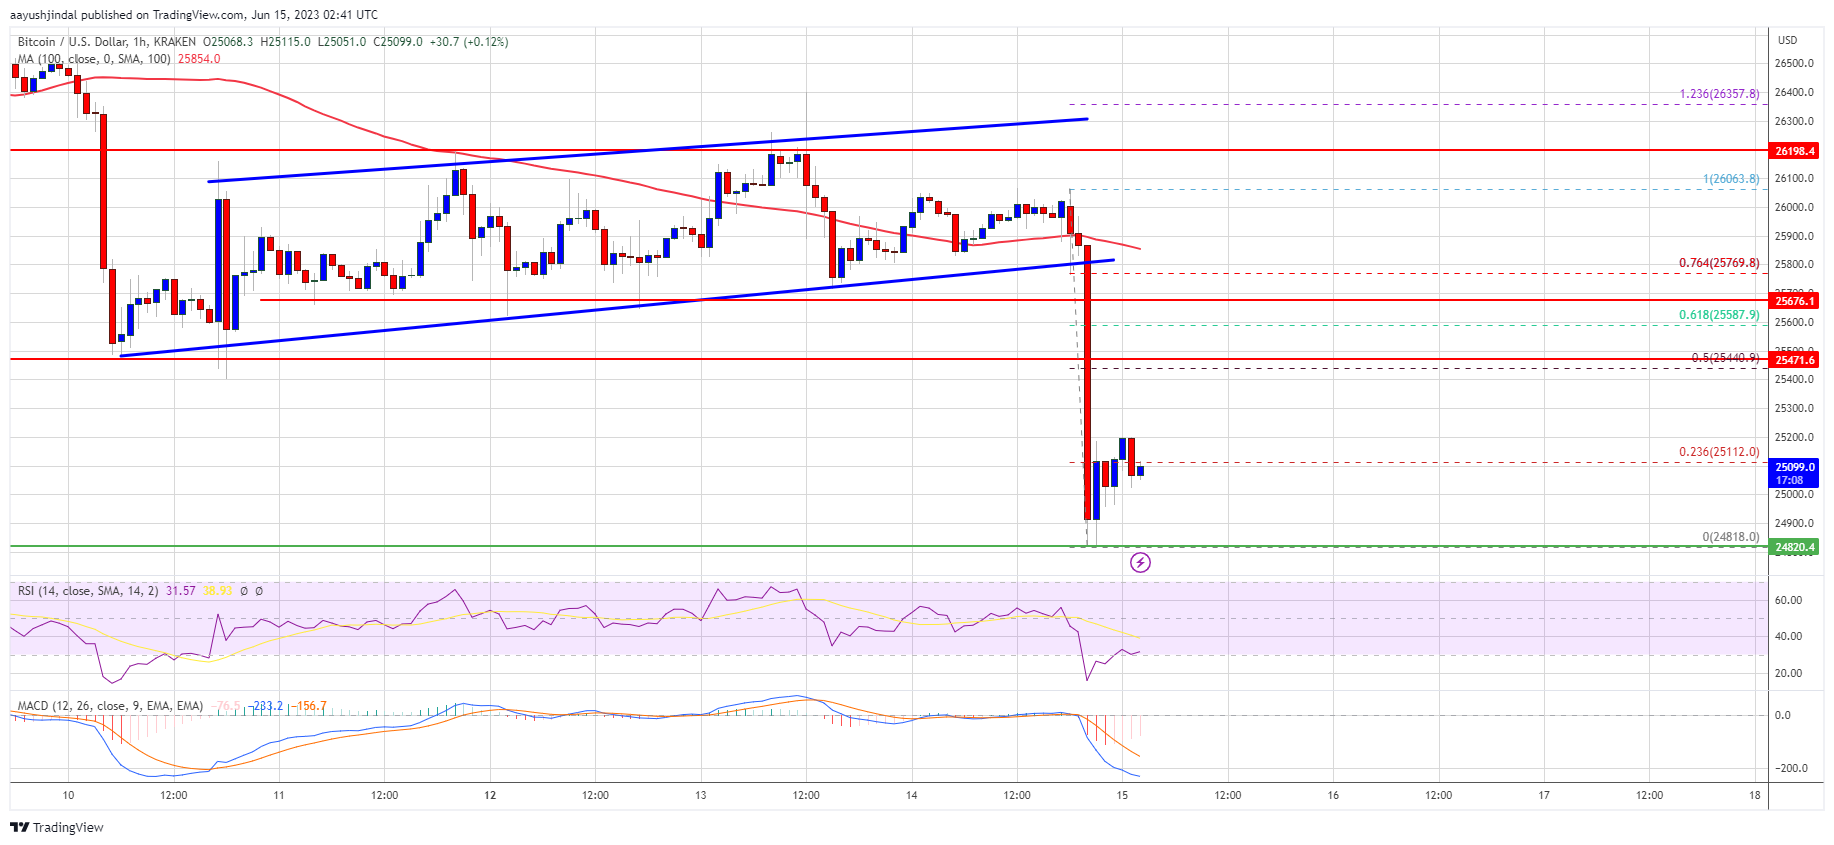
There was a break below a key rising channel with support near $25,800 on the hourly chart of the BTC/USD pair (data feed from Kraken).
The pair could correct higher but upsides might be limited above $25,500.
Bitcoin Price Extends Decline
Bitcoin price failed to start a fresh increase above the $26,200 resistance zone. BTC failed to remain in a positive zone after the Fed interest rate decision and declined below the $25,500 support.
The price declined below the $25,400 support to trade to a new weekly low. Besides, there was a break below a key rising channel with support near $25,800 on the hourly chart of the BTC/USD pair. There was a move below the $25,000 support zone.
A low is formed near $24,818 and the price is now consolidating losses. It is trading near the 23.6% Fib retracement level of the recent decline from the $26,063 swing high to the $24,818 low.
Bitcoin price is now trading below $25,500 and the 100 hourly Simple moving average. Immediate resistance is near the $25,200 level.
The first major resistance is near the $25,500 level. It is close to the 50% Fib retracement level of the recent decline from the $26,063 swing high to the $24,818 low. A clear move above the $25,500 resistance might start a fresh increase. The next major resistance is near the $26,000 level, above which the bulls might send BTC toward the $26,500 resistance zone.
More Losses in BTC?
If Bitcoin’s price fails to clear the $25,500 resistance, it could continue to move down. Immediate support on the downside is near the $24,800 level and the recent low.
The next major support is near the $24,500 level, below which the price might gain bearish momentum. In the stated case, the price could drop toward the $24,000 support in the near term.
Technical indicators:
Hourly MACD – The MACD is now gaining pace in the bearish zone.
Hourly RSI (Relative Strength Index) – The RSI for BTC/USD is below the 50 level.
Major Support Levels – $24,800, followed by $24,500.
Major Resistance Levels – $25,200, $25,500, and $26,000.
]]>https://cryptocurrencypanther.com/2023/06/15/bitcoin-price-plunges-further-post-fed-decision-24k-next/feed/0BTC Falls Back to 24k Mark, Plunges By 1.28%
https://cryptocurrencypanther.com/2023/02/20/btc-falls-back-to-24k-mark-plunges-by-1-28/
https://cryptocurrencypanther.com/2023/02/20/btc-falls-back-to-24k-mark-plunges-by-1-28/#respondMon, 20 Feb 2023 06:49:45 +0000https://cryptocurrencypanther.com/2023/02/20/btc-falls-back-to-24k-mark-plunges-by-1-28/
Bitcoin Price Today: The crypto market is trading partially in red today, as some of the significant coins see a decline.
As of writing, Bitcoin price decreases by 1.28% in the last 24 hours.
The global crypto market cap stands at 1.12 trillion USD, a decrease of 0.23% over the past day. The total crypto market volume in the last 24 hours increased by 51.96% and is currently at 63.07 billion USD.
Bitcoin (BTC) decreases by 1.28%
The world’s largest crypto, Bitcoin decreases by 1.28% in the last 24 hours, thus, taking the market cap to 472.24 billion USD. Each BTC is trading for 24,465 USD. The crypto is reaching near the 25k mark yet again. Traders were ecstatic about the massive Bitcoin rally, however, the tough economic conditions seem to be pulling it back.
Trading volume in the last 24 hours is up by 53.74%. The dominance of Bitcoin has decreased by 0.35% compared to the previous day and stands at 42.25%.Source: coinmarketcap
In the last 24 hours, Bitcoin was as high as 25,093 USD and fell to as low as 23,927 USD. In the past week, the token was also trading for as high as 25,134 USD. This came as a great sign as Bitcoin seems to be bullish and is rallying.
Price of Bitcoin in different countries:
BTC Price in India
Each BTC can be bought in Indian currency for INR 20,23,096.
BTC Price in Singapore
For the people of Singapore, each BTC is currently costing 32,680 Singapore dollar.
BTC Price in Dubai
The price of each BTC in Dubai is 89,859 UAE Dirham.
Shourya is a fintech enthusiast who mainly reports on Cryptocurrency Prices, Union Budget, CBDC, and FTX collapse. Connect with her at [email protected] or tweet at Shourya_Jha7
The presented content may include the personal opinion of the author and is subject to market condition. Do your market research before investing in cryptocurrencies. The author or the publication does not hold any responsibility for your personal financial loss.
]]>https://cryptocurrencypanther.com/2023/02/20/btc-falls-back-to-24k-mark-plunges-by-1-28/feed/0Bitcoin Price Holds $24K As Traders Watch These Three Key Events
https://cryptocurrencypanther.com/2023/02/02/bitcoin-price-holds-24k-as-traders-watch-these-three-key-events/
https://cryptocurrencypanther.com/2023/02/02/bitcoin-price-holds-24k-as-traders-watch-these-three-key-events/#respondThu, 02 Feb 2023 13:18:13 +0000https://cryptocurrencypanther.com/2023/02/02/bitcoin-price-holds-24k-as-traders-watch-these-three-key-events/
Bitcoin price continued its upward trajectory after the U.S. Federal Reserve slows the rate hike to 25 bps and Chair Jerome Powell agrees to cooling inflation, but still early to pivot. The BTC price jumps 5% after the Fed rate hike decision. However, traders are watching these three key events to decide whether to buy or sell Bitcoin at current levels.
Bitcoin Price Awaits a Massive Rally
After a 40% rally in January, Bitcoin price looks to turn fully bullish as the U.S. Fed decided on a small 25 bps rate hike. The Fed was bound to slow rate hikes amid cooling inflation, strong jobs data, and GDP growth in the fourth quarter. Moreover, high interest rates risk a recession and U.S. debt continues to rise.
Traders are awaiting interest rate hike decisions by the Bank of England and the European Central Bank scheduled today. The rate hike decisions will impact the US dollar, a weak dollar will increase crypto prices. The US Dollar Index (DXY) is currently recovering from below the 101 level, ahead of the rate hike decisions.
The Bank of England increases interest rates by 50 bps to 4%, a 10th consecutive rate increase. It will push borrowing costs to the highest since 2008. Recently, the IMF warned that the UK will be the only major economy to go into recession this year.
Meanwhile, the European Central Bank is also expected to raise interest rates by 50 bps. The ECB plans to go with another 50 bps in March, followed by a final hike in May. ECB President Christine Lagarde plans to stay course to return inflation to 2%.
Traders Eyes “Golden Cross” in Bitcoin Price
Bitcoin rally in January is driving the formation of a “golden cross” this month, which indicates a strong bullish market.
Bitcoin price chart in daily timeframe signals a “golden cross” formation impending this month. The golden cross will occur when the 50-day simple moving average (blue) crosses above the 200-day SMA (red), producing a cross on the price chart. While this generally indicates a bullish market, not all Bitcoin price rallies have come after golden crosses historically.
]]>https://cryptocurrencypanther.com/2023/02/02/bitcoin-price-holds-24k-as-traders-watch-these-three-key-events/feed/0Bitcoin Mcap Hits 2-Month Peak As Asset Breaks $24k Resistance
https://cryptocurrencypanther.com/2022/08/12/bitcoin-mcap-hits-2-month-peak-as-asset-breaks-24k-resistance/
https://cryptocurrencypanther.com/2022/08/12/bitcoin-mcap-hits-2-month-peak-as-asset-breaks-24k-resistance/#respondFri, 12 Aug 2022 12:49:09 +0000https://cryptocurrencypanther.com/2022/08/12/bitcoin-mcap-hits-2-month-peak-as-asset-breaks-24k-resistance/
Bitcoin valuation has come a long way since the asset’s inception. The asset’s valuation reached a milestone in November of last year when it climbed to $1.27T. The market capitalization has since then dropped below expected margins as unfavorable market conditions persist.
Since June, BTC’s market cap has remained below the $470M mark due to the steadfast Crypto Winter. Notwithstanding, following the recent bear market rally, market capitalization surged back above $470 B. This is a further indication of a bullish trend.
Bitcoin’s $474 Billion valuation is the highest since the June 13 slip
As at time of reporting, data from CoinMarketCap shows BTC’s market cap has reached $474B. This level represents the highest the asset’s valuation has touched since the outset of the downtrend on June 13. This indicates that the current upsurge is the highest the markets have seen since the toughest times of the bear market. A sustained rally can set the asset up for the $25k zone.
With a market dominance of 40.31%, BTC contributes most to the global crypto market cap. As a consequence, this milestone from BTC drove the crypto market capitalization above $1.17T. This is still a long way down from the global market cap of $3T in November of last year.
The recent uptick in the direction of the markets gained momentum shortly after the CPI data reveal. Per the report, US YoY inflation rate is at 8.5%. This data is 0.2% less than the estimate. The crypto community has since then retained bullish sentiments.
BTC trades comfortably above the $24k resistance
BTC had been consolidating around the $23k zone since the start of August. Following the underperformance of late-July, the asset struggled to break the $24k level for a brief moment before plummeting further below $21k.
Although BTC started August on a positive note, it hadn’t been able to break the $24k key resistance till now. Not only has BTC broken the $24k resistance, it is currently trading comfortably above the level at $24,809. The CMC community expects the asset to surge further from here, with a $27k forecast by month-end.
Currently, Bitcoin’s Funding Rate indicates that long position traders are more dominant in the derivatives market. This represents bullish sentiments, as it shows more traders expect the market to surge further. Furthermore, liquidations in the past 24 hours have occurred more with short positions.
Abigal .V. is a cryptocurrency writer with over 4-years of writing experience. She focuses on news writing, and is skilled in sourcing hot topics. She’s a fan of cryptocurrencies and NFTs.
The presented content may include the personal opinion of the author and is subject to market condition. Do your market research before investing in cryptocurrencies. The author or the publication does not hold any responsibility for your personal financial loss.
]]>https://cryptocurrencypanther.com/2022/08/12/bitcoin-mcap-hits-2-month-peak-as-asset-breaks-24k-resistance/feed/0Bitcoin Surge Towards $24k As CPI Report Show Inflation Cooling
https://cryptocurrencypanther.com/2022/08/11/bitcoin-surge-towards-24k-as-cpi-report-show-inflation-cooling/
https://cryptocurrencypanther.com/2022/08/11/bitcoin-surge-towards-24k-as-cpi-report-show-inflation-cooling/#respondThu, 11 Aug 2022 00:52:26 +0000https://cryptocurrencypanther.com/2022/08/11/bitcoin-surge-towards-24k-as-cpi-report-show-inflation-cooling/
Bitcoin surged after July’s CPI data showed that inflation has started to decline after several months of record-breaking rates.
Similar to earlier instances, the price of bitcoin climbed close to $24,000.
CPI Report Boost Bitcoin Price
According to the Consumer Price Index report (CPI) that the U.S. Bureau of Labor and Statistics released on Wednesday, consumer costs remained unchanged, putting inflation at 8.5%.
Prior to this, analysts anticipated that the index, which analyzes price changes across a wide range of products and services, would increase by 0.2% to reveal inflation to be 8.7% on an annual basis.
After the U.S. Bureau of Labor Statistics released its data on inflation for July, the value of the Dow Jones Industrial Average, Nasdaq, S&P 500, and NYSE indexes all sharply increased. Moreover, the value of precious metals and cryptocurrencies rose on Wednesday. The value of bitcoin surged by nearly 4%, that of gold by 0.35%, and that of silver by 1.43% in relation to the dollar.
Inflation as measured by headline CPI increased 0.0 percent month-over-month in July, well below its elevated June monthly rate of 1.3 percent. Monthly core inflation in July fell to 0.3 percent. 1/ pic.twitter.com/6bVTZq7m1W
— Council of Economic Advisers (@WhiteHouseCEA) August 10, 2022
According to the Consumer Price Index (CPI) report for July 2022, the Consumer Price Index for All Urban Consumers (CPI-U) increased by 1.3 percent in June but remained steady in July. Before seasonal adjustment, the all items index rose 8.5 percent over the previous 12 months. The report on inflation adds:
“The gasoline index fell 7.7 percent in July and offset increases in the food and shelter indexes, resulting in the all items index being unchanged over the month.”
President of the United States Joe Biden talked about the CPI figures as well and said that new legislation and domestic semiconductor production had increased the nation’s economic activity. According to Biden, the lack of semiconductors resulted in high pricing for autos last year, which accounted for one-third of core inflation. “America is back leading the way with the CHIPS and Science Law boosting our efforts to make semiconductors right here at home.”
Focus Turns To FOMC Meeting In September
Analysts anticipate that core inflation will rise from 5.9% to 6.1%, pushing the Fed to raise interest rates further in September. The CPI data, however, indicates that recent rate hikes are having a cooling effect on the economy.
Nevertheless, Citigroup economists predicted another 75 basis point increase, fueled by strong job data and faster pay growth than anticipated. But if core inflation comes in higher than anticipated, there is also a chance for a 100 basis point rise.
Federal Funds Effective Rate (Source: FRED)
The current CPI rate is 9%, and investor Stanley Druckenmiller said that “Inflation has never come down from above 5% without Fed funds rising above CPI.”
The Fed won’t need to raise rates as much as they have thus far this year if inflation has peaked.
In response to rising interest rates that slow growth, institutional investors have moved away from more speculative assets like tech stocks and cryptocurrencies and toward investments that are more comparatively stable, such corporate bonds and U.S. Treasuries.
Featured image from Getty Image, charts from FRED and TradingView.com
]]>https://cryptocurrencypanther.com/2022/08/11/bitcoin-surge-towards-24k-as-cpi-report-show-inflation-cooling/feed/0BTC is still struggling to move past the $24k resistance level
https://cryptocurrencypanther.com/2022/08/09/btc-is-still-struggling-to-move-past-the-24k-resistance-level/
https://cryptocurrencypanther.com/2022/08/09/btc-is-still-struggling-to-move-past-the-24k-resistance-level/#respondTue, 09 Aug 2022 08:02:04 +0000https://cryptocurrencypanther.com/2022/08/09/btc-is-still-struggling-to-move-past-the-24k-resistance-level/
The cryptocurrency market has continued its positive start to the week despite some coins and tokens currently underperforming.
The cryptocurrency market is trading in the green zone again. The market has added less than 1% to its value in the last 24 hours, and the total market cap stays above $1.1 trillion.
The broader market is experiencing a mixed performance, with some coins and tokens currently trading in the red zone while others are performing positively.
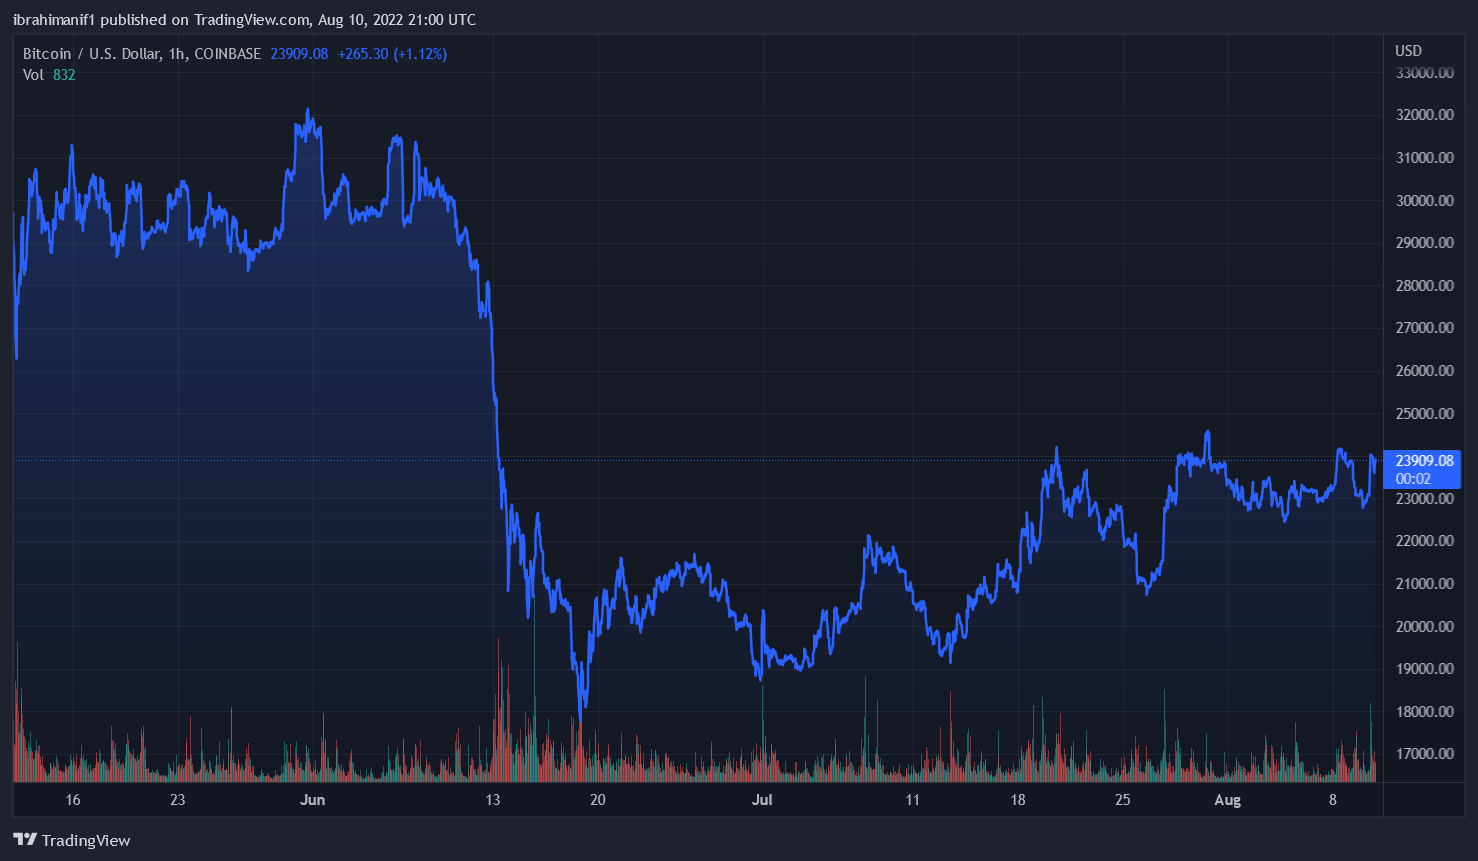
Bitcoin is up by 0.38% in the last 24 hours. The leading cryptocurrency didn’t have enough momentum to surge past the $24k resistance level despite trading in the green zone.
Over the past seven days, Bitcoin has added nearly 5% to its value. This has allowed the leading cryptocurrency to maintain its position above the $20k psychological level.
However, the bulls would need to push higher to enable Bitcoin to move towards the $25k psychological level over the coming days.
Key levels to watch
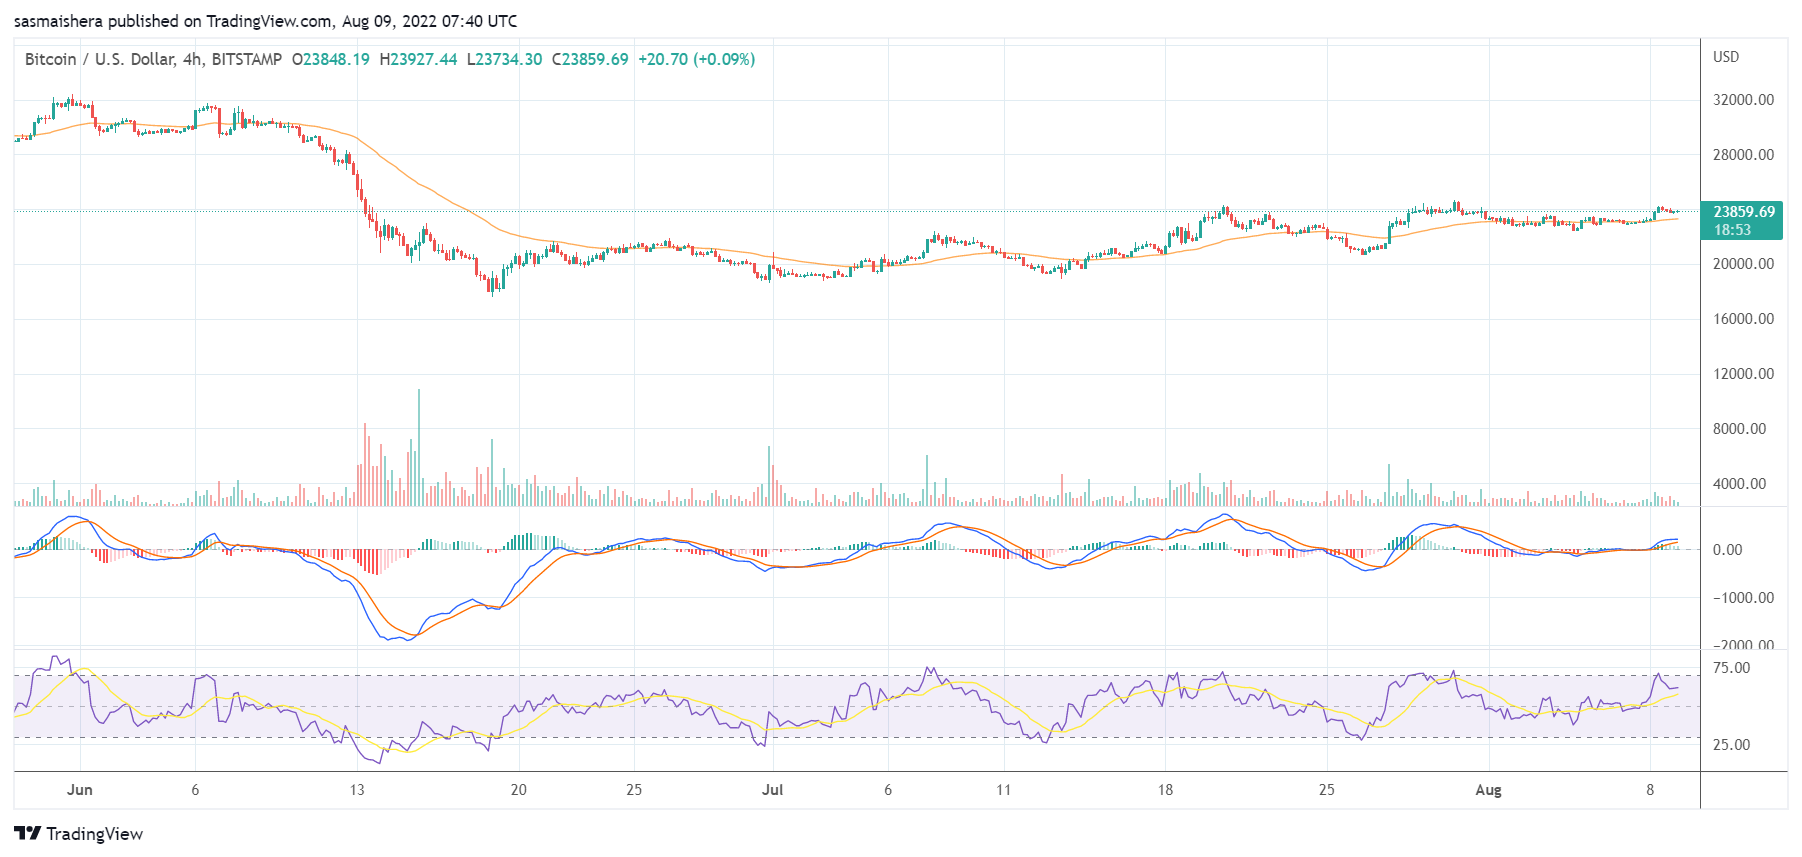
The BTC/USD 4-hour chart is bullish as Bitcoin has been performing well over the past few days. The technical indicators show that the bulls are currently in charge of the market.
The MACD line crossed the neutral zone into the positive territory as Bitcoin rallied higher. Thus, indicating positive momentum for the leading cryptocurrency.
The 14-day relative strength index of 60 shows that Bitcoin is above the neutral level. If the bulls remain in charge, Bitcoin could enter the overbought region in the coming days or weeks.
At press time, Bitcoin is trading around $23,860 per coin. BTC could surge past the $24k resistance level before the end of the day if the bulls remain in control.
However, it would need to support of the broader cryptocurrency market to move past last month’s high of $24,693 and head towards the $25k psychological level.
The bears might still regain control and push BTC below the $23k support level. However, BTC should comfortably stay above the $22,132 support level in the short term.


✓ Share: