
Key takeaways
The cryptocurrency market has been bearish since the start of the week, with Bitcoin and other major cryptocurrencies trading in the red zone. However, the Memeinator presale has just hit a new milestone and is set to go higher.
Bitcoin and altcoins underperform
Bitcoin and altcoins have been underperforming over the last few days. BTC has lost more than 1% of its value over the last 24 hours. At press time, the price of Bitcoin stands at $36,912 per coin.
Leading altcoins including Ether, BNB, Solana, ADA, DOGE, and TRX, have all lost more than 2% of their value over the last 24 hours.
What is Memeinator?
Memeinator is a Web3 project designed to help content creators generate better content. It intends to change how people view memes. The project intends to leverage the hype around meme coins by providing users with numerous use cases.
According to their whitepaper, Memeinator’s job is to destroy worthless memes, ensuring that there is a higher level of quality content available to users.
The project differs from thousands of other meme tokens because it offers users real-world utility. Per the whitepaper, Memeinator will use AI to identify worthless memes, allowing users to know them and steer clear of them.
The goal is to ensure that Memeinator becomes a $1 billion market-cap crypto project, turning it into one of the biggest meme coin projects in the Web3 ecosystem. The development team has also published a detailed roadmap that shows how Memeinator will reach the $1 billion market cap.
The Memeinator presale is currently in its seventh stage and has raised more than $1.5 million so far. In the first presale stage, the MMTR was sold for $0.01, but it has been increased to $0.014 in the current stage. The price will rise to $0.0485 by the end of the presale, giving early investors a whopping 132% ROI at listing.
Memeinator’s presale will soon enter the eighth stage
The Memeinator presale will round up its seventh stage over the next few hours or days. So far, the team has raised more than $1.51 million of its $1.8 million target in the current stage.
Its native MMTR token can be purchased using ETH, USDT and USDC stablecoins. At the moment, the token is available to users on the Ethereum and BNChain blockchains.
Purchasing the MMTR token is easy as it involves connecting any of the supported wallets to the Memeinator website and buying the tokens using ETH, USDT and USDC coins.
Click here to read more about the Memeinator presale.
Why is the Memeinator presale growing so fast?
The Memeinator presale is growing so fast thanks to the increasing interest from investors. The project offers real-world utility to users and its MMTR token will power several activities on the platform.
Thanks to its utilities, Memeinator could gain massive adoption from degens, crypto natives, and speculators. The team believes that Memeinator’s use cases go beyond the crypto space, as content creators could use its services to gain access to quality memes.
Memeinator will take advantage of its AI technology to analyse and evaluate memes across the internet, identifying lower-quality memes to replace or destroy them.
MMTR holders will enjoy numerous incentives thanks to the token’s excellent features. The token has deflationary mechanisms and rewards for holders. Furthermore, the Memeinator team has allocated 20% of the tokens for marketing, CEX listing and liquidity.
Is the Memeinator a good project for investors?
Memeinator could become one of the biggest winners in the bull market if the project gains the right level of adoption.
This project will be leveraging AI and blockchain technology to provide excellent value to investors over the coming months and years. With the right level of adoption and the goal to reach a billion-dollar market cap, early investors would be the biggest winners.

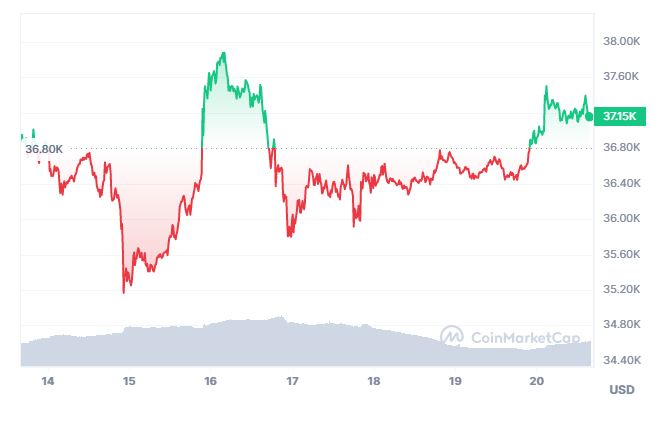
- At press time, Bitcoin was trading at $37,172.29.
- BTC broke the $37K mark in the wake of Javier Milei’s victory in the Argentinian presidential elections.
- Javier Milei is a pro-Bitcoin politician.
Bitcoin experienced a surge, surpassing the $37,000 mark, in the wake of Javier Milei’s victory in the Argentine presidential election.
Milei, a self-described anarcho-capitalist, clinched the presidency with a significant 55% of the votes, signalling a major political shift in the country.
Pro-Bitcoin stance fuels market confidence
Milei, celebrated for his pro-bitcoin stance, has positioned himself as a supporter of decentralized finance (DeFi) and a critic of central banks. His victory has resonated positively within the cryptocurrency community, with Bitcoin enthusiasts optimistic about the potential impact of a pro-bitcoin leader in Argentina.
While Milei sees Bitcoin as a crucial tool for economic revival, it’s important to note that he has not proposed making Bitcoin legal tender in Argentina. Nevertheless, his commitment to reducing the influence of central banks and embracing decentralized financial systems has propelled Bitcoin to new heights.
Market reacts amid AI token sector gains
The broader cryptocurrency market witnessed an overall increase of nearly 2% in the past 24 hours, with the artificial intelligence (AI)-focused token sector leading the gains as explained in a previous news article.
The Bitcoin and broader cryptocurrency surge appears to be driven by both the political developments in Argentina and unrelated positive developments in rising AI projects.
 Bitcoin price movements
Traders, however, are expressing caution, highlighting potential market reactions following the release of Federal Reserve meeting notes scheduled for Tuesday. The anticipation of low liquidity towards the end of the week adds an element of uncertainty to the market.
As Bitcoin continues to make headlines with Milei’s victory, market participants will be closely monitoring global economic developments and central bank announcements for further insights into potential market shifts.
This news marks a significant moment in the intersection of politics and cryptocurrency, emphasizing the growing influence of political leaders on the digital asset landscape.
Bitcoin price is consolidating gains below the $37,000 zone. BTC could gain bullish momentum if there is a close above the $36,800 and $37,000 levels.
- Bitcoin is holding gains above the $36,000 support zone.
- The price is trading below $37,000 and the 100 hourly Simple moving average.
- There is a key bearish trend line forming with resistance near $36,600 on the hourly chart of the BTC/USD pair (data feed from Kraken).
- The pair could make another attempt to gain strength above $37,000.
Bitcoin Price Holds Key Support
Bitcoin price made another attempt to clear the $37,500 resistance. However, BTC failed to continue higher toward the $38,000 resistance. A high was formed near $37,423 and the price started a downside correction.
There was a move below the $37,000 pivot level. The price declined below the $36,500 level but stayed above $36,000. A low is formed near $36,183 and the price is now rising. There was a move above the $36,450 level. The price is trading above the 23.6% Fib retracement level of the recent decline from the $37,423 swing high to the $36,183 low.
Bitcoin is now trading below $37,000 and the 100 hourly Simple moving average. There is also a key bearish trend line forming with resistance near $36,600 on the hourly chart of the BTC/USD pair.
On the upside, immediate resistance is near the $36,600 level. The next key resistance could be near $36,800 or the 50% Fib retracement level of the recent decline from the $37,423 swing high to the $36,183 low. The first major resistance is near $37,000, above which the price might accelerate further higher.
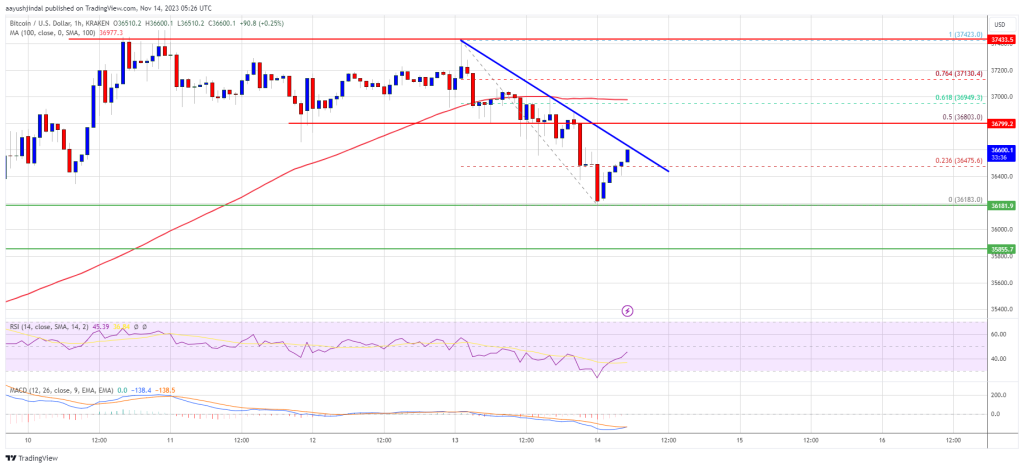
Source: BTCUSD on TradingView.com
In the stated case, it could test the $37,500 level. Any more gains might send BTC toward the $38,000 level, above which the price could gain bullish momentum and rally toward $40,000.
Another Decline In BTC?
If Bitcoin fails to rise above the $36,800 resistance zone, it could continue to move down. Immediate support on the downside is near the $36,180 level.
The next major support is near $36,000. If there is a move below $36,000, there is a risk of more downsides. In the stated case, the price could drop toward the key support at $35,500 in the near term.
Technical indicators:
Hourly MACD – The MACD is now gaining pace in the bullish zone.
Hourly RSI (Relative Strength Index) – The RSI for BTC/USD is now below the 50 level.
Major Support Levels – $36,180, followed by $36,000.
Major Resistance Levels – $36,600, $36,800, and $37,000.

-
A potential spot Bitcoin ETF has raised optimism in crypto markets.
-
Shiba Memu has crossed the $4.4 million barrier in presale.
-
Shiba Memu could experience high speculation after the token is listed.
A renewed hope is creeping into crypto markets. Bitcoin tapped $37,000 on Thursday, its highest since May 2022, as investors placed bets on potential spot ETF. Meanwhile, the sentiment has boosted the rest of the sector, as most cryptos remained green. The sentiment is positive for upcoming digital assets like Shiba Memu (SHMU). 50 days before the presale closes, investors have bought over $4.446 million worth of the tokens.
Spot Bitcoin ETF increasing interest in risky assets
The prospect of the first spot Bitcoin ETF is seen as the primary driver of growing interest in digital assets. Optimism increased after reports the SEC had opened discussions with Grayscale for its spot ETF application. The development comes after Grayscale won a case ruling against the regulator over its spot product filing.
Analysts are expecting a potential ETF approval will boost Bitcoin price. So far, market indicators suggest that a higher Bitcoin price is on the horizon. Bitcoin’s one-month call-put skew has risen above 10%. The level is the strongest bullish bias for the asset since April 2021. The metric measures call option prices in relation to puts expiring in a month. Calls outpacing puts is interpreted as a bullish bias.
The strengths of Bitcoin are positive for crypto as the asset sets the mood for the sector. As such, new projects like Shiba Memu are likely to generate more interest, boosting the post-listing prices.
Shiba Memu capitalises on meme interest
Meme cryptocurrencies are an exciting asset class. Although they often lag major cryptos when a bullish market sets in, their movement can be parabolic. This has seen investors buy the meme tokens in anticipation of these market moves for quick and high returns.
Shiba Memu seeks to capitalise on the trends in meme assets to generate high ROI for investors. However, unlike its peers, which experience frequent pumps and dumps, Shiba Memu seeks sustainability.
As such, Shiba Memu taps into the rapidly growing world of AI. The project relies on AI to self-market itself and become powerful. For instance, the AI can scan the web to find creative ideas and write its own marketing copy. In the future, Shiba Memu will become more intelligent and powerful to deliver high ROI to investors.
Shiba Memu is a socially engaging meme project
One of the exciting aspects of memes is their ability to captivate the minds of their enthusiasts. Terms like the “Doge army” and “Shiba army” are common among enthusiastic meme communities. That’s because memes are mostly social projects and derive value from engagements and social chatter.
But unlike its predecessors, Shiba Memu takes the engagement game a notch higher. The project features an AI dashboard where users can hold meaningful discussions with the AI. They can query the AI about the latest in marketing strategies. They can also give suggestions on how to improve the project. The engagement ensures Shiba Memu dominates using social metrics, helping its value to grow.
Is Shiba Memu a good investment?
Shiba Memu’s strong presale shows interest in the project is very high. The potential pst-listing gains are expected to be huge due to high speculations. Similarly, analysts have lauded the token as a potential 10x investment, given the investors’ interest.
Shiba Memu also features a very attractive presale. The token’s price rises daily at 6 PM GMT, delivering persistent returns to early birds. For example, while the token launched at $0.011125 price, it is now $0.039700. More gains are expected to increase during the remaining 50 days of the presale.
Also, there are other noteworthy methods to generate passive income with Shiba Memu. These include a staking program. Investors earn yields from their staked tokens. This makes Shiba Memu a potentially viable investment for 2023 and beyond.
Bitcoin price is facing a major hurdle near $35,250. BTC could rally toward $37,000 once it clears the $35,250 and $35,500 resistance levels.
- Bitcoin is aiming for a fresh move above the $36,000 resistance zone.
- The price is trading near $34,850 and the 100 hourly Simple moving average.
- There is a key contracting triangle forming with support near $34,320 on the hourly chart of the BTC/USD pair (data feed from Kraken).
- The pair must stay above the $34,150 support to start a fresh increase in the near term.
Bitcoin Price Eyes More Gains
Bitcoin price remained well-bid above the $34,000 support zone. BTC climbed higher above the $34,500 and $34,650 resistance levels to start another increase.
There was a move above the 50% Fib retracement level of the downward move from the $35,945 swing high to the $34,133 swing low. However, the bears were active above the $35,200 level. The price seems to be facing a major hurdle near the $35,250 level.
Bitcoin is struggling to clear the 61.8% Fib retracement level of the downward move from the $35,945 swing high to the $34,133 swing low. It is now trading near $34,850 and the 100 hourly Simple moving average.
There is also a key contracting triangle forming with support near $34,320 on the hourly chart of the BTC/USD pair. On the upside, immediate resistance is near the $35,050 level. The next key resistance could be near $35,250 or the triangle upper trend line.
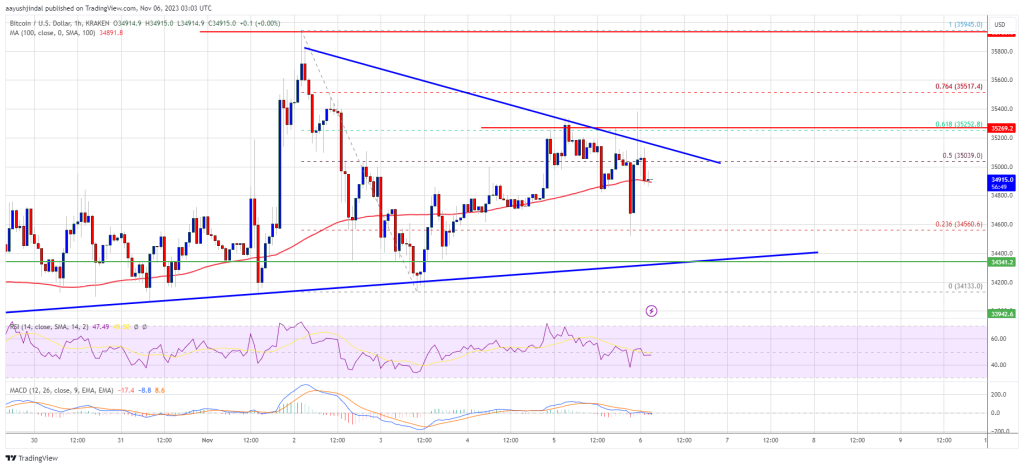
Source: BTCUSD on TradingView.com
A clear move above the $35,250 resistance might open the doors for a move toward the $35,500 resistance. The next key resistance could be $36,000, above which the price could rise toward $37,000. Any more gains might send BTC toward the $37,500 level.
Downside Continuation In BTC?
If Bitcoin fails to rise above the $35,250 resistance zone, it could continue to move down. Immediate support on the downside is near the $34,500 low.
The next major support is near the $34,150 zone. If there is a move below $34,150, there is a risk of more downsides. In the stated case, the price could even decline below the $34,000 support level in the near term.
Technical indicators:
Hourly MACD – The MACD is now gaining pace in the bearish zone.
Hourly RSI (Relative Strength Index) – The RSI for BTC/USD is now below the 50 level.
Major Support Levels – $34,500, followed by $34,150.
Major Resistance Levels – $35,050, $35,250, and $35,500.
Bitcoin is facing resistance near $38,200 against the US Dollar. BTC remains at a risk of more downsides unless there is a move above the $39,000 resistance.
- Bitcoin is facing a major resistance near the $38,200 and $39,000 levels.
- The price is now trading below $38,500 and the 100 hourly simple moving average.
- There is a key bearish trend line with resistance near $38,350 on the hourly chart of the BTC/USD pair (data feed from Kraken).
- The pair must clear the $38,350 and $38,800 resistance levels to start a steady increase.
Bitcoin Price Remains In Downtrend
Bitcoin price attempted an upside break above the $38,800 and $39,000 resistance levels. However, BTC struggled to clear the $39,000 resistance zone and started a fresh decline.
A swing high was formed near $39,170 and the price started a fresh decline. There was a clear move below the $38,800 and $38,500 levels. The bears even pushed the price below the $38,000 level and there was a close below the 100 hourly simple moving average.
A low is formed near $37,507 and the price is now correcting losses. There was a move above the 23.6% Fib retracement level of the recent decline from the $39,169 swing high to $37,507 low.
Bitcoin price is now facing resistance near the $38,350 level and the 100 hourly simple moving average. There is also a key bearish trend line with resistance near $38,350 on the hourly chart of the BTC/USD pair. The trend line is near the 50% Fib retracement level of the recent decline from the $39,169 swing high to $37,507 low.
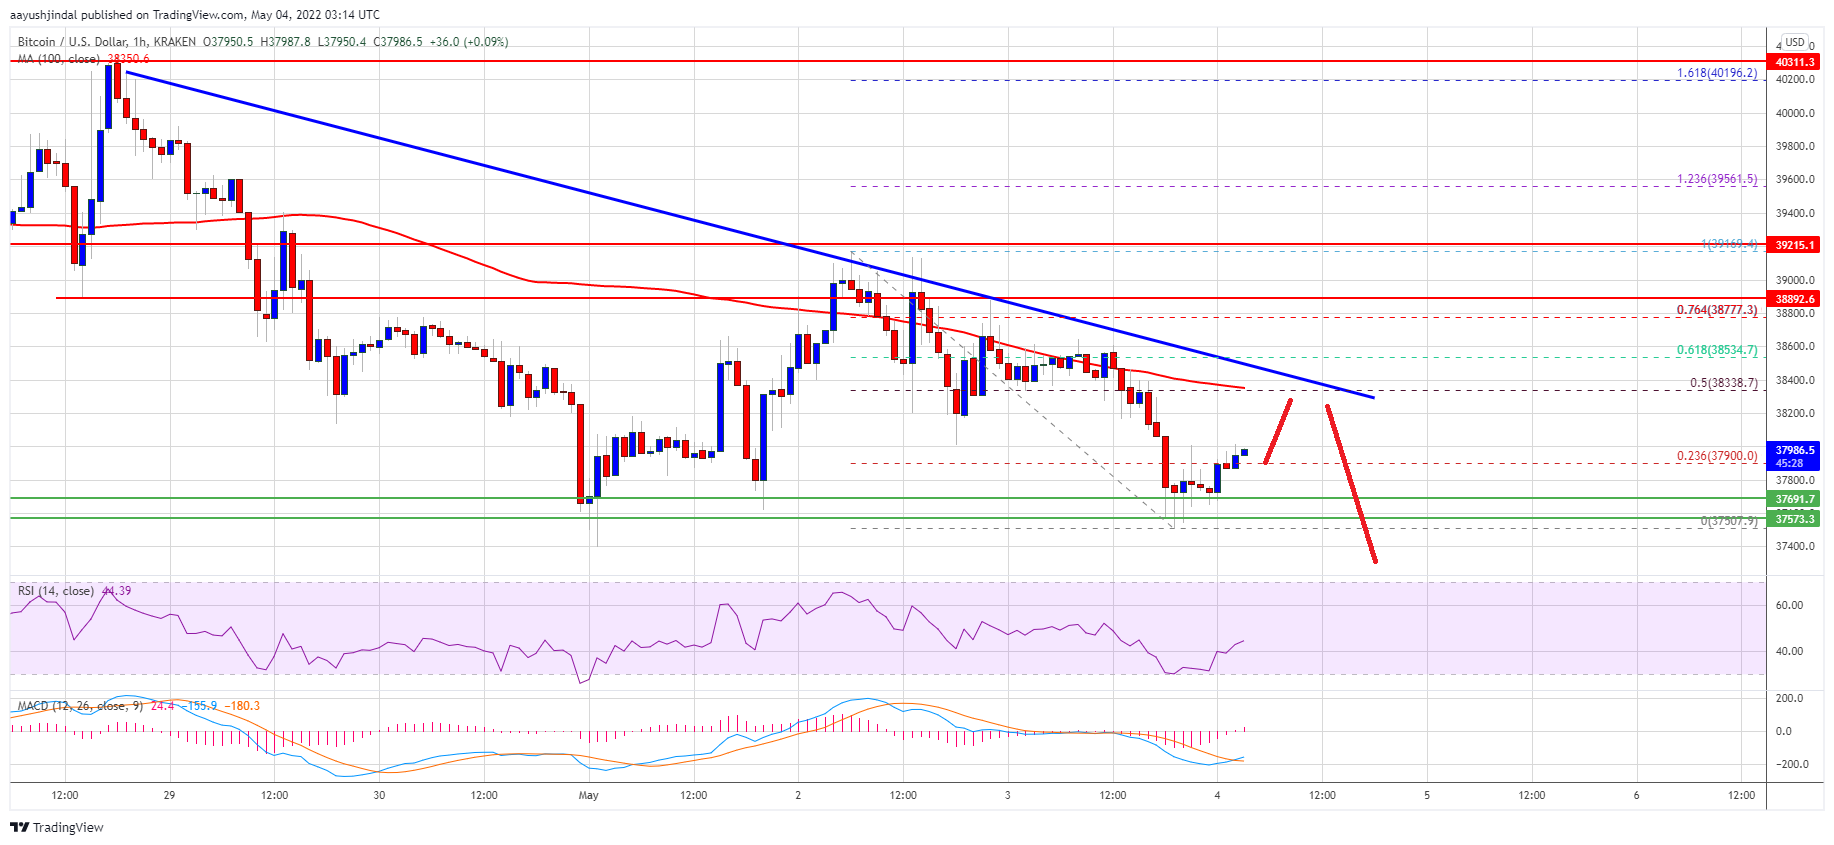
Source: BTCUSD on TradingView.com
The next key resistance could be near the $38,800 zone. A close above the $38,800 resistance could increase the chances of a clear move above the $39,000 resistance zone.
More Losses in BTC?
If bitcoin fails to clear the $38,350 resistance zone, it could continue to move down. An immediate support on the downside is near the $37,700 level.
The next major support is seen near the $37,550 level. A downside break below the $37,550 support and the recent low might trigger sharp losses. The next major support is $36,500, below which the price could dive to $35,000.
Technical indicators:
Hourly MACD – The MACD is slowly losing pace in the bearish zone.
Hourly RSI (Relative Strength Index) – The RSI for BTC/USD is now below the 50 level.
Major Support Levels – $37,700, followed by $37,550.
Major Resistance Levels – $38,350, $38,800 and $39,000.
Bitcoin (BTC) extended its losses on Monday, falling further into a trading range it has stuck to for most of the year. Analysts expect the token to deepen its losses, given that pressure from inflation and a hawkish Federal Reserve is set to increase in the coming months.
BTC fell 1% in the past 24 hours, hitting a three-week low of $41,897.15. The token has now almost entirely negated its strong rally through end-March, which saw it hit 2022 highs of near $48,000.
A bulk of the token’s recent weakness has coincided with losses in other risk driven assets. Stocks and foreign exchange were also routed as investors feared interest rate hikes by the Fed, which will reduce the margins on investing in several asset classes.
BTC to find support at $37k
BTC’s fall below $42,000 also saw it briefly slip below its 200-day moving average, a sign that the token could be headed for steeper losses below $40,000.
Crypto analyst @SmartContracter expects the token to drop to as low as $37-$38,000, its next key support level. While it could see a brief relief bounce in the near-term, the momentum for the world’s largest cryptocurrency appears to be largely downwards.

Recent data also showed that a large number of long positions on BTC had been liquidated last week. Traders initially expecting more gains in the token may now see a change in sentiment, given recent losses.
More headwinds to come?
Between rising inflation, growing correlation with stocks, and an ongoing halving, BTC faces a slew of factors pushing its price lower.
BitMEX CEO Arthur Hayes said BTC’s correlation with U.S. technology stocks, particularly the Nasdaq 100 index, is likely to see it slump to $30,000 by June. He cited increasing inflation and pressure from the Fed as the two main triggers for a potential crypto crash.
BTC is also set to undergo a halving, ie a reduction in mining incentives, later in the day. While the halving is a method to keep BTC sustainable in the long-term, it comes with the short-term effect of weighing on prices.
Disclaimer
The presented content may include the personal opinion of the author and is subject to market condition. Do your market research before investing in cryptocurrencies. The author or the publication does not hold any responsibility for your personal financial loss.
About Author
Bitcoin price is making familiar moves on Monday as it is hovering near $39,000. BTC found reliable support of around $37,000 since late January. Sellers collect liquidity and bounce back toward the upper trading zone placed at the supply zone extending from $45,000 and $42,000.
- Bitcoin price trades with significant gains as the fresh trading week begins.
- Moves in a familiar trading range of $37k and $42k for a month.
- BTC could test $42,000 next as bulls attempt to cross the descending trendline.
Bitcoin price looks for a breakout

Bitcoin price remains pressured near $39,000 and is making effort to move higher. In today’s session, BTC opened lower but quickly recovered to test sessions’ high at $39,220.0. On the daily chart, the price face multiple rejections near the descending trendline, which is extending from the highs of $45,850 made on February 10. Further, the Bitcoin price failed to slice above the bearish trendline in February.
Bitcoin price hit record lows in late January at $32,950.72 and surged 35% to the swing highs of $45,850.0, the level which acted as a strong upside barrier for the bulls. BTC retreated further by 17% but made a higher low at $24,324.05, extending the demand zone now at $37,169.52. Thus making a formation of higher lows with receding higher levels.
As per the technical formation, a bounce is expected at the current price level. The immediate first target is placed at 50-day EMA (Exponential Moving Average) at $40,756.05.
A decisive breakout of the bearish trend line will bring $44,000 in play with the condition of above an average volumes.
On the contrary, if the price breaks below the session’s low as a shift in bullish sentiment then Bitcoin price could revisit the horizontal $36,000 level.

On the 1-hour chart frame, Bitcoin price is facing a tough time to pierce above the stiff resistance zone placed at $39,200. But it recovered sharply from the session’s low with good volumes.
Technical indicators:
RSI: The daily relative strength index attempts to break above the average line with a bullish bias.
MACD: The Moving Average Convergence Divergence hovers below the midline. But the indicator tilt in a positive direction with upside momentum
Disclaimer
The presented content may include the personal opinion of the author and is subject to market condition. Do your market research before investing in cryptocurrencies. The author or the publication does not hold any responsibility for your personal financial loss.
About Author
Bitcoin has been rejected as it approached $40,000 and has experienced a rise in volatility during today’s trading session. The first crypto by market cap trades at $37,400 with a 4.3% loss in 24-hours.
Related Reading | Bitcoin Steadies At $37,000, But What Are Options Traders Doing?

There has been a shift in market sentiment as Bitcoin attempts to bounce from a low near $33,000. A large portion of traders seem to have positioned themselves on the short side.
On crypto exchange Binance, according to Jarvis Labs, funding rates for derivatives turned negative. However, they yet need to reach similar levels as in other downtrends.

As the chart shows, funding rates on this platform are barely on negative territory while in June 2021, when Bitcoin hit a yearly low of $28,800, the metric stood higher. This suggests there is room for more downside and more a bigger bearish sentiment across the market.
Bitcoin investors David Ellis has been tracking large BTC holders and their movements for some months. Ellis has found potential for more danger as most of these investors outload their funds with recent BTC price action.
Although there has been some demand for Bitcoin from “Blue Whales”, the overall demand and address distribution seem to be hinting at low interest on the cryptocurrency. Most likely caused by the potential shift in central banks monetary policies, and investors preferring to leave capital on the sidelines. Ellis said:
This is the third straight day of coin consolidation at the top. On the surface, the address contraction is alarming. It could signify broad shrinking interest. My only hope is that some Orca wallets are being combined into BW wallets. Otherwise, we may have a problem.

Why Bitcoin Could See Some Relief
Further data provided by Material Indicators (MI) suggest Bitcoin could retest its most recent lows as the bidding order below its current levels seems rather thing. Only about $5 million are holding BTC’s current levels, but at the time of writing some buyers attempt to defend $37,000 and prevent a larger decline.
Looks like bids were moved into the #BTC buy zone to defend $37k for now. Still watching #FireCharts. Not sure this game is over yet.https://t.co/zw0ufgPIMt #cryptocurrency #trading #tradingstrategy #tradingsignals pic.twitter.com/t2LPz9N0mh
— Material Indicators (@MI_Algos) February 2, 2022
In favor of the bulls, the U.S. dollar (DXY) has been displaying weakness during the past weeks. The currency was rejected north 97 according to this Index and could continue its downtrend to 94.616.
These levels should operate as critical support for the U.S. dollar and could abate recent selling pressure which could allow Bitcoin to hold its support line and make another attempt into the $40,000s.
$DXY is still coming off. 95.50 is probably next.
A close below 94.60 is required to reverse the trend. https://t.co/H19EgXmOKs pic.twitter.com/B56TVODA3F
— Justin Bennett (@JustinBennettFX) February 2, 2022
Related Reading | TA: Ethereum Breaking This Confluence Resistance Could Spark a Fresh Surge
In addition, as NewsBTC reported, the U.S. Federal Reserve should keep a light schedule for the entire month of February. There are some important events in the next weeks, the report on U.S. Consumer Price Index (CPI), but the institution should remain relatively quiet until March 17th.
Bitcoin finally displayed signs of recovery as the coin was priced at $37,441 at press time. In the past week, the coin had lost about 14% of its market value. From the technical outlook in the market, it looks as though BTC has finally displayed some semblance of stability after a five-day extended sell-off period. Overall market capitalisation was at $1.73 Trillion after declining significantly in the past week. Over the last 24 hours, however, there has been an 8% increase in the overall market capitalisation. This 14% recovery in prices, as BTC was down to almost $32,800 comes after trading volume shot up before Federal Reserve’s meeting.
Bitcoin usually has a ripple effect across the broader crypto market, however, most altcoins continued their south-bound movements on their charts earlier today. In the last couple of days, certain altcoins had depreciated severely. Solana, Polygon and Cardano, out of the major altcoins dipped more than 30% in the last few days. Out of the top gainers today, Solana, Polkadot and Cardano have registered appreciation at press time. The previous week’s price action had coincided with a weakening of the stock market as the U.S mentioned plans of tightening the overall monetary policies.
Bearish Pressure Still Dominant
Bitcoin was trading hands at $37,441 at the time of writing, it gained nearly 8% over the last day. The price action of BTC could still remain choppy as the technical outlook suggested. Although the technical indicators captured signs of prices recovering, it wasn’t enough to conclude that Bitcoin was bullish.

A look at the latest BTC price action | Source: BTCUSD on TradingView.com
Short term price support levels for the coin stood at $35,000, $33,000 and then at $32,000. The immediate price roof for BTC was $40,754.73. From the above chart, BTC seems to have witnessed tight resistance at the $40k mark. If prices remain stable over the upcoming trading sessions, BTC might continue to remain sandwiched between the $37,000 and $40,000 price levels respectively. A fall from the current price level would push BTC to $35k briefly and then finally back to $32k.
Related Reading | Bitcoin NUPL Metric Signals Start Of Early Bear Period
The Relative Strength Index depicted positive sentiments as the indicator was parked just slightly above the 50-mark. This reading signified that buyers resurged into the market at press time. On Balance Volume (OBV) was still weak despite an uptick.
A rise in OBV usually depicts the crowd sentiment, the indicator displayed an increase in buying strength however, OBV was still weak. Awesome Oscillator similarly flashed green signal bars but the bars were still underneath the zero-line. This reaffirmed the presence of bears in the market.
Why Did The Crypto Market Turn Bearish
The price crash in the crypto market comes in the backdrop of the stock market weakening. S&P500 has lost 10.5% too. Additionally, the fear has built up owing to an increase in interest rates. Post the meeting this week, Federal Reserve might hint at the same and disclose their plans on hiking the interest rates.
Related Reading | Bitcoin Targets $40K? Why Crypto Could See General Price Reversion
Due to a fall in S&P500, there has been a decline in other asset classes too such as equities. Combined with all these factors, the cryptocurrency market also sensed the panic and fear which caused the sell-off in the market. At the current moment, the fear index stood at 12 which signified extreme fear.
Featured image from iStockPhoto, Charts from TradingView.com