Shiba Inu (SHIB) Whales Turn to GoodEgg (GEGG): $39K Invested as AI Dating ICO Surges with Over $3Bln Presale Tokens Sold Analytics Insight
Source link ]]>
The crypto market prices continued to dip today with major cryptocurrencies bleeding due to selling pressure from traders. Bitcoin (BTC), the largest crypto by market cap, fell below the $40,000 mark while some smaller altcoins outperformed the significant players in the domain.
Today’s crypto prices suggest notable lows for both Bitcoin and Ethereum (ETH). This comes after the hype around Spot Bitcoin ETFs began slacking off. However, crypto analysts deem the recent bearish trend as an opportunity to ‘buy the dip’ as they’re optimistic about the crypto arena’s long-term potential.
Major Crypto Prices Today
Bitcoin, the world’s oldest crypto, saw its price extending lower than the $39,000 level and rebounding thereafter. The Bitcoin price saw a 1.25% decline, settling at $39,637.47 at the time of writing on Wednesday, January 24. Whilst, it’s trading volume dipped by 1.99% to $30.19 billion in the last 24 hours. The digital currency boasted a market cap of $777.14 billion
Looking at other cryptocurrencies, the Ethereum price plummeted by 5.47% to $2,218.93 at press time. On the contrary, it recorded a 21.76% hike in its trade volume, reaching $16.59 billion. Moreover, Binance Coin (BNB) slipped by 4.85% to $295.80, while its 24-hour trade volume rose by 14.81% to $1.06 billion.
Furthermore, Solana experienced a 2% slump in price, settling at $84.05. On the contrary, it registered a 19.62% increase in trade volume to $3.14 billion. Whilst, XRP saw a 2.82% decline, reaching $0.5158, with a 25.92% hike in trading volume to $1.41 billion.
Meanwhile, Cardano’s price dipped by 3.72% to $0.4665. However, it witnessed a 26.13% increase in its 24-hour trading volume, reaching $557.39 million. Whilst, in the much-hyped meme coin market, Dogecoin retreated 3.29% lower to $0.07833 while its rival, Shiba Inu, plunged 8.35% and traded at $0.000008804.
Also Read: Ethereum ETFs: Hester Pierce Claims SEC Won’t ‘Repeat Same Mistakes’
Top Crypto Gainers & Losers Today
The Pepe coin, a trending meme crypto, extended further losses as traders made a shift to other safer options. The Pepe coin price slumped by 3.60% to $0.000001029. Whilst, its trading volume surged by 16.54% to $71.54 million.
Akash Network (AKT), an AI crypto, recorded a 14% increase, defying the bearish sentiment in the market. The AKT price soared by 14.38% to $2.76 with a market cap of $623.39 million. In contrast, its 24-hour trade volume dropped by 14.51% to $5.76 million.
Blur (BLUR), one of trending virtual currencies, recorded a notable uptick as well. Blur’s value increased by 8.88% to $0.664. In addition, its trade volume spiked by a 50.08% to $405.74 million. Moreover, it attained a high of $0.6667 during the bullish rally.
Also Read: Jim Cramer Embraces ‘Number Go Down’ Theme As Bitcoin Drops 20% From High
The presented content may include the personal opinion of the author and is subject to market condition. Do your market research before investing in cryptocurrencies. The author or the publication does not hold any responsibility for your personal financial loss.
Bitcoin, Ethereum, Dogecoin Mixed Amid $230M Liquidations: Analyst Says $39K Level Is A ‘Distinct Possibi Benzinga
Source link ]]>
Bitcoin started another decline below the $40,000 level against the US Dollar. BTC could extend losses if it stays below the $40,000 resistance zone.
- Bitcoin started another decline after it failed to clear the $40,000 resistance zone.
- The price is now trading below $39,500 and the 100 hourly simple moving average.
- There is a key bearish trend line forming with resistance near $39,500 on the hourly chart of the BTC/USD pair (data feed from Kraken).
- The pair could start a major decline if there is a close below the $38,800 level.
Bitcoin Price Gains Bearish Momentum
Bitcoin price settled below the $40,500 level to move into a bearish zone. BTC traded below the $40,000 support level and settled below the 100 hourly simple moving average to move into a bearish zone.
The price even traded below the $39,200 support level. A low is formed near $38,700 and the price is now consolidating losses. An immediate resistance on the upside is near the $39,500 level. There is also a key bearish trend line forming with resistance near $39,500 on the hourly chart of the BTC/USD pair.
The next key resistance could be $39,700 or the 23.6% Fib retracement level of the recent decline from the $42,950 swing high to $38,700 low.
The first major resistance is now forming near the $40,000 level. The main resistance sits near $40,500 and the 100 hourly simple moving average. To start a strong upward move, the price must settle above the $40,500 zone and the 100 hourly simple moving average.
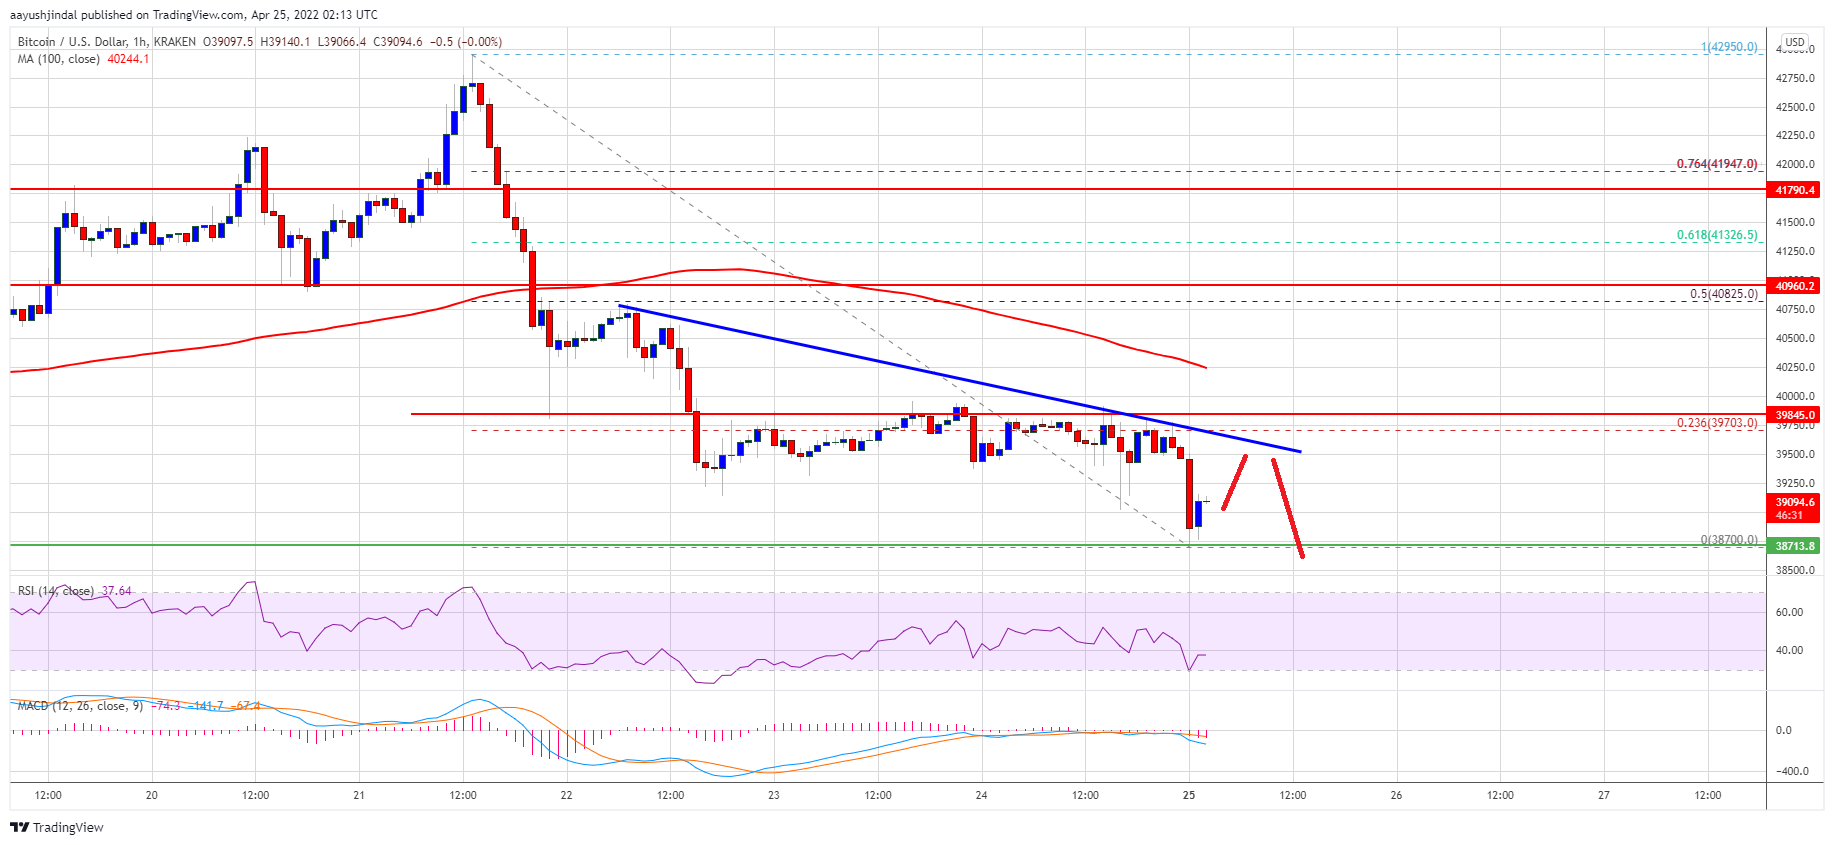
Source: BTCUSD on TradingView.com
In the stated case, the price could even surpass the 50% Fib retracement level of the recent decline from the $42,950 swing high to $38,700 low.
More Losses in BTC?
If bitcoin fails to clear the $40,000 resistance zone, it could continue to move down. An immediate support on the downside is near the $39,000 level.
The next major support is seen near the $38,800 level. A downside break below the $38,800 zone could send the price towards the $37,500 support zone.
Technical indicators:
Hourly MACD – The MACD is slowly gaining pace in the bearish zone.
Hourly RSI (Relative Strength Index) – The RSI for BTC/USD is now below the 50 level.
Major Support Levels – $39,000, followed by $38,800.
Major Resistance Levels – $39,500, $39,800 and $40,000.
On-chain data shows a sharp spike in the Bitcoin exchange outflows, suggesting whales have been buying the dip to $39k.
Bitcoin Exchange Outflows Show High Value Suggesting Whale Activity
As pointed out by an analyst in a CryptoQuant post, the BTC exchange outflows have registered a large spike recently.
The “exchange outflows” is an indicator that measures the total amount of Bitcoin currently exiting wallets of all exchanges.
When the value of this indicator is high, it means investors are withdrawing a large amount of coins at the moment. Especially large values can imply whales have been buying.
Such a trend, when sustained, may be bullish for the price of the coin as investors usually transfer their crypto out of exchanges for accumulation purposes.
On the other hand, low outflow values suggest there isn’t much buying going in the market right now. This could either be neutral for the price, or if selling is going on, then it may be bearish.
Related Reading | Bitcoin Miners Receive Third Break This Year, Over 100K Blocks To Go Until The Halving
Now, here is a chart that shows the trend in the BTC outflows over the past year:
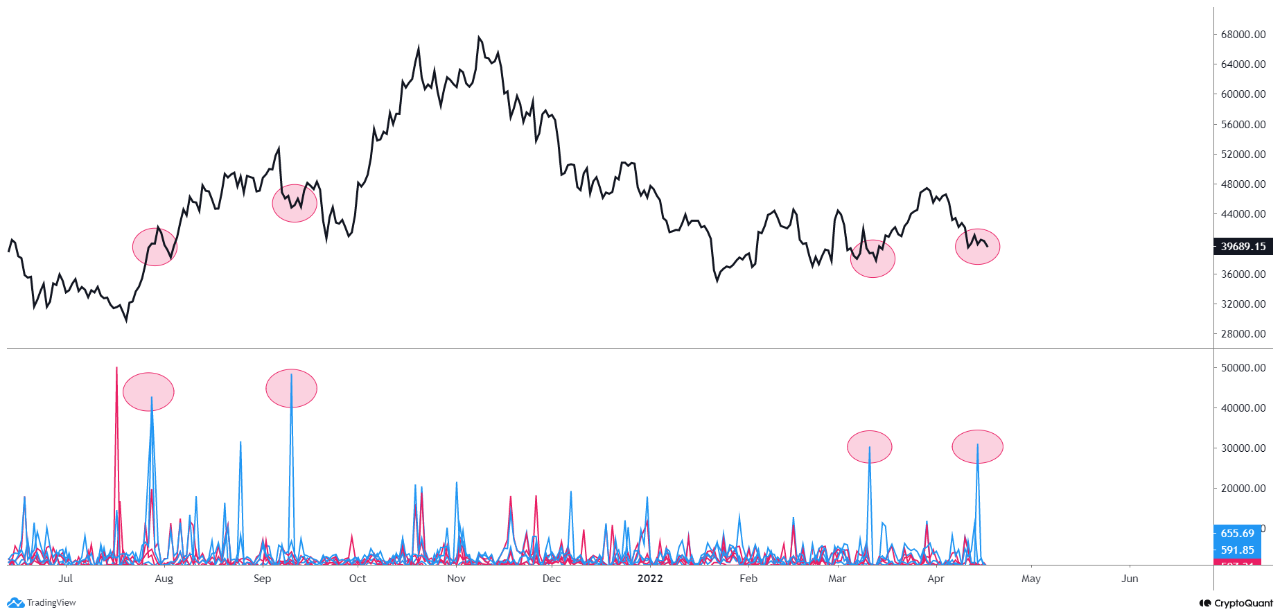
The indicator's value seems to have observed a large spike recently | Source: CryptoQuant
As you can see in the above graph, the Bitcoin exchange outflow has shown a big value recently as the price has fallen below the $40k mark.
This suggests that whales may have jumped at the opportunity to accumulate more coins. During the three previous instances in the last year when outflow values on a similar scale were observed, the price of BTC observed an uplift not too long after.
Related Reading | Bitcoin Bear Market Comparison Says It Is Almost Time For Bull Season
It now remains to be seen whether a similar bullish effect will be there this time as well, or if the sellers will overwhelm the buyers and drive the price further down.
BTC Price
At the time of writing, Bitcoin’s price floats around $39.2k, down 5% in the last seven days. Over the past month, the crypto has shed 4% in value.
The below chart shows the trend in the price of the coin over the last five days.

Looks like the value of the crypto has plunged down over the past twenty-four hours | Source: BTCUSD on TradingView
After holding above the $39k level for more than a month, Bitcoin finally dropped below the mark in the past day. This is a continuation of the decline that started late last month after BTC topped out above $47k.
Currently, it’s unclear when the price may observe some recovery. But if the outflows are anything to go by, then signs may be bullish for the crypto.
Featured image from Unsplash.com, charts from TradingView.com, CryptoQuant.com
Rejected once again as it attempted to reclaim the $40,000 area, Bitcoin trades just north of $39,000. The first crypto by market cap is moving on a low timeframe range between the mid area of its current levels, and around $48,000.
Related Reading | Bitcoin Clings To $40K On Easter Sunday As Crypto Seen To Head Lower In The Short Term
In higher timeframes, Bitcoin seems trapped between the low $30,000s and the high $60,000s. Whenever it approaches, traders turn to high fear of high greed levels.
At the time of writing, Bitcoin trades at $39,300 with a 3% and 7% loss in the last 24 hours and 7 days, respectively.

Data from analyst Ali Martinez suggest traders are yet to enter the fear territory as BTC’s price still holds its current levels. A majority of operators seem to be optimistic.
As seen below, the long to short ratio on crypto exchange Binance stands at 2.88, meaning traders are dominantly long. Around 74% of the traders on this platform took long positions as opposed to 25%.

In that sense, Martinez advised traders to stay cautious as Bitcoin rarely does what the majority expects. While the price of the first crypto seems to be recovering in short timeframes, bulls are yet to display conviction.
The analyst added the following on potential support levels for BTC’s price in case of more downside:
Bitcoin last line of defense is the 78.6% Fibonacci retracement level at $38,530. Breaching this support level could see $BTC fall to $32,853 or even $26,820.
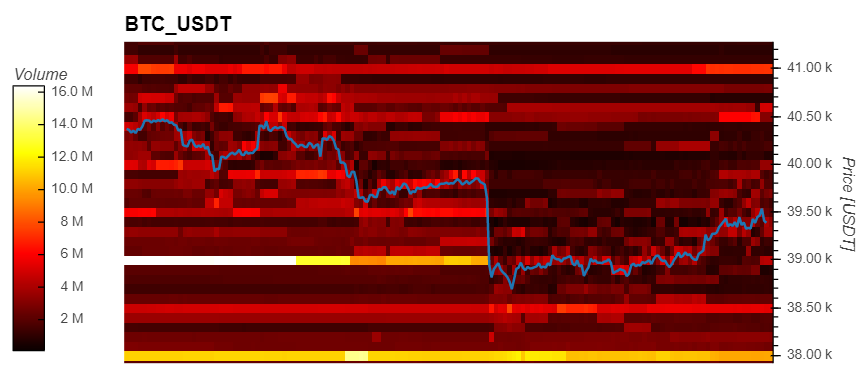
Data from Material Indicators (MI) supports these potential levels. As seen below, the price of Bitcoin bounced off a stack of bid orders (in yellow below the price) set at around $39,000.
The benchmark crypto then proceeded to move upwards, but with little support at its current levels in case of a fresh increase in selling pressure until $38,000. Similar to when BTC saw support at $39,000, there are around $10 million in bid orders at those levels.
Bitcoin Fundamentals Suggest Up, But BTC’s Price Stays Down
Bitcoin’s price range has been tightening in the past months. A capitulation event, a price action that moves the price out of the range, seems to be brewing.
Additional data from Martinez records an important decrease in the supply of BTC sitting on exchange platforms. This metric stands at a one-year low with a persistent trend to the downside.
Despite the supply crunch, the price of Bitcoin seems more tied to macro-economic factors. The increase in interest rates from the U.S. Federal Reserve (FED) and the war between Russia and Ukraine are among the most important.
Related Reading | TA: Bitcoin Remains at Risk, Why 100 SMA Is The Key
As NewsBTC reported, if the FED turns aggressive on its monetary policy, BTC’s price could retest the bottom of its range or trend lower.
Bitcoin keeps fluttering in and out of the $40,000 price level. Keeping count of these breaks above $40K, there have now been a total of five since the year started. It is one thing to break above an important resistance level but it is another to hold above it, forming strong support. The latter has proven elusive for the digital asset, giving rise to the question of whether the cryptocurrency will actually be able to hold above it this time around.
Bitcoin Ends Idle Streak
Bitcoin has been on an idle streak since it last failed to hold above $40K. After breaking above the coveted resistance point, it once again failed to prove that it could form support. It had then declined to the $38K level. This point has always formed strong support at this level, so as expected, it had been the stopping point for the decline.
Related Reading | Bitmain Rolls Out More Powerful And Energy-Efficient Bitcoin Mining Rig To Date
For the past week, the consolidation range for the cryptocurrency had grown tighter with the digital asset trading around the $39,000 level. It still maintained low momentum throughout the time, indicating that even if there was a recovery trend, it would not be significant in any regard.
BTC recovers above $40K again | Source: BTCUSD on TradingView.com
Bitcoin has continued to drag the market around with it though. Correlation with coins like Ethereum has remained on the high side. Uncertainty about where the digital asset goes from here has translated to trading volume. But with the opening of the midweek trading market, the cryptocurrency has picked up some momentum.
Fifth Time Is The Charm?
Once again, bitcoin has broken out above $40,000. This point which continues to be a hard-to-conquer level remains the most obvious obstacle for the digital asset. The $40,000 to $44,000 is the obvious culprit. Bears tend to mount their resistance at these junctions because breaking out towards $46,000 would put bitcoin on another bull trend.
Related Reading | Bitcoin Worth $1.2B Left Coinbase In Sign Of Continuous Institutional Adoption
As the market awaits the Fed decision, bitcoin had been rallying upwards in wait of what the outcome might be. On the other side, bitcoin’s correlation to gold has declined over the past week. It has now touched an eight-year low.
BTC’s price is still shakily holding on to $40,000 as of the time of this writing. If history is to be followed at this point, then the market may see the digital asset slide back below $40,000 by the start of the weekend.
Featured image from Forbes, chart from TradingView.com
Ethereum failed to settle above the $4,000 zone against the US Dollar. ETH price is correcting gains and it could dive if there is a break below $3,900.
- Ethereum struggled to clear the $4,050 resistance zone and declined.
- The price is trading below $4,020 and the 100 hourly simple moving average.
- There is a key contracting triangle forming with resistance near $3,980 on the hourly chart of ETH/USD (data feed via Kraken).
- The pair must stay above $3,900 to start a fresh increase in the near term.
Ethereum Price Corrects Lower
Ethereum made an attempt to gain strength above the $4,020 and $4,050 resistance levels. ETH even climbed above the $4,050 level and the 100 hourly simple moving average.
However, there was no upside continuation above $4,075. A high was formed near $4,075 and the price started a downside correction. There was a break below the $4,000 support level. Ether even declined below the 23.6% Fib retracement level of the upward move from the $3,750 swing low to $4,075 high.
It is now trading below $4,020 and the 100 hourly simple moving average. An immediate resistance on the upside is near the $3,980 level. There is also a key contracting triangle forming with resistance near $3,980 on the hourly chart of ETH/USD.
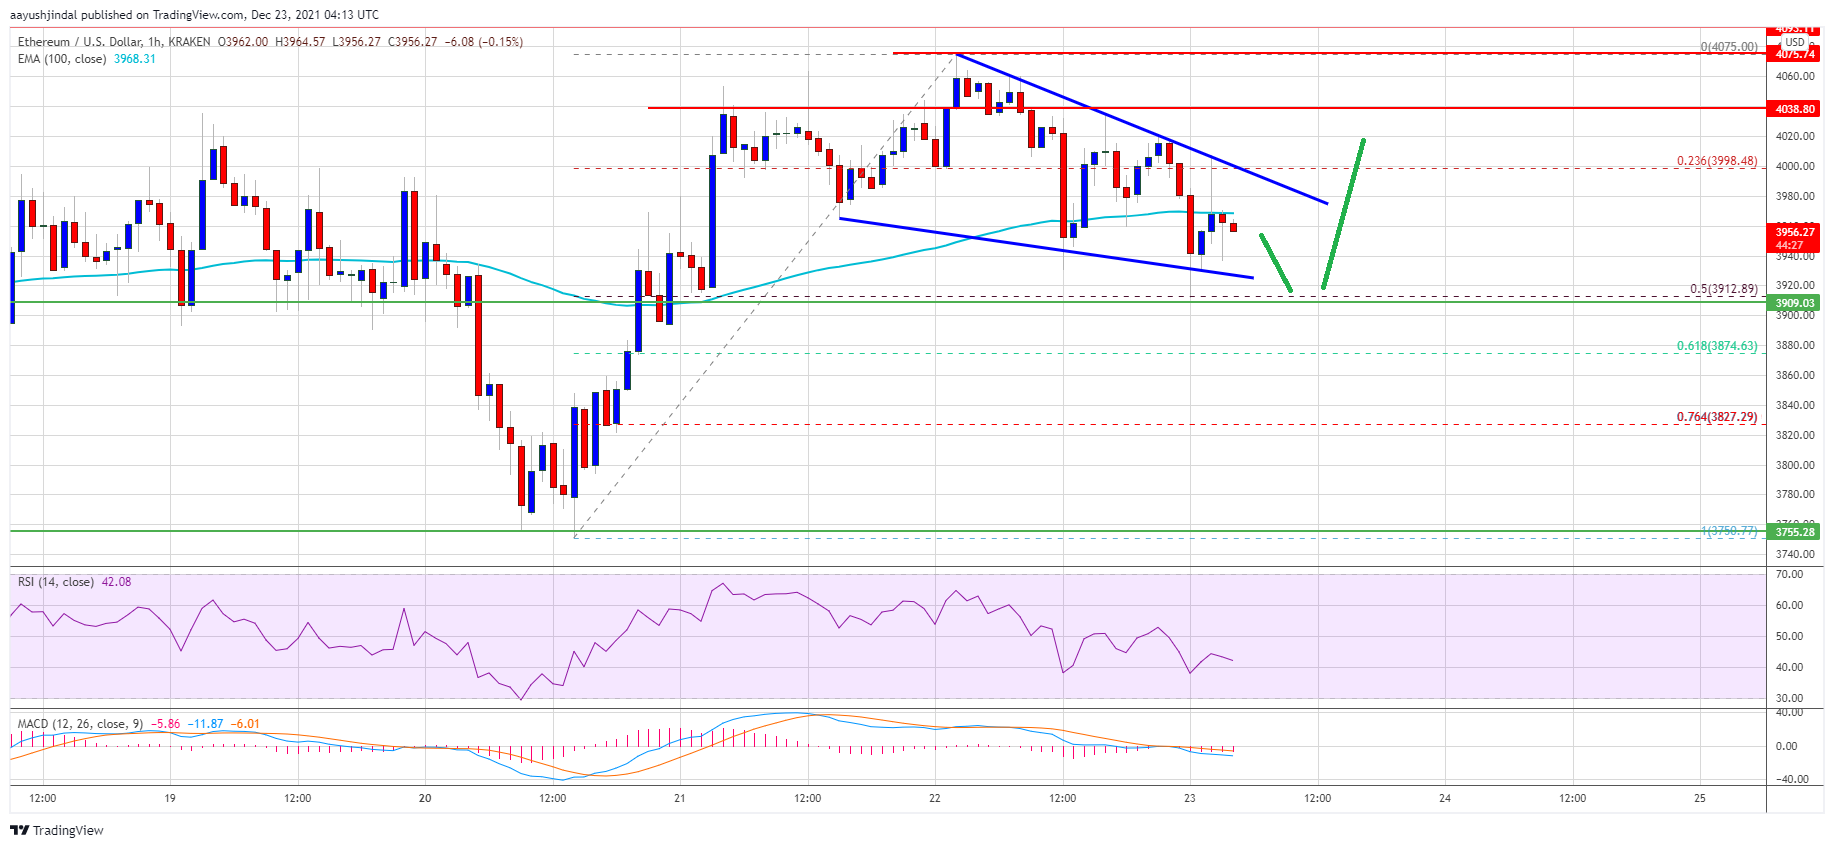
Source: ETHUSD on TradingView.com
The next major resistance is near the $4,020 level. A clear upside break above the $4,020 level could push the price further higher in the near term. The next stop for the bulls could be $4,080, above which the price could rise to $4,200. Any more gains could send the price towards the $4,250 level.
Downside Break in ETH?
If ethereum fails to start a fresh increase above the $4,000 level, it could continue to move down. An initial support on the downside is near the $3,940 level. The first key support is now forming near the $3,920 level.
The 50% Fib retracement level of the upward move from the $3,750 swing low to $4,075 high is also near the $3,920 zone. A downside break below the $3,920 and $3,900 levels could stage a fresh decline in the near term.
Technical Indicators
Hourly MACD – The MACD for ETH/USD is gaining pace in the bearish zone.
Hourly RSI – The RSI for ETH/USD is now below the 50 level.
Major Support Level – $3,920
Major Resistance Level – $4,020
✓ Share: