Market analyst Ali Martinez highlights a recent development on the Bitcoin 3-day chart with significant bearish implications. The leading cryptocurrency still trades just below the $70,000 mark following the temporary breakout earlier this week. Bitcoin has now spent an overwhelming majority of the last month within the $60,000 – $70,000 price range, after prices crashed to a new market low in late January/early February amid the extended bearish season.
Bitcoin Set For Another Leg Down?
In an X post on March 6, Martinez shares a key macro insight on the Bitcoin price trajectory, using historical data from the 3-day trading chart. The seasoned analyst explains that the formation of a particular death cross has consistently preceded the final price drawdown in the market cycle. Generally, the death cross represents a bearish technical indicator where a short-term moving average falls below the long-term moving average, indicating that recent price momentum has weakened relative to the longer-term trend, and there is rising selling pressure coupled with a potential prolonged downturn.
The common version of the death cross appears when the 50-day moving average crosses below the 200-day moving average, and is a key bearish indicator in the Bitcoin market, according to observations shared by Martinez. In 2013, Bitcoin had notably crashed by 72% before the 50/200 SMA death cross appeared. Thereafter, the market leader recorded an additional 52% price fall, before reaching a price bottom.
Bitcoin $BTC 3-day chart has been one of the most important timeframes from a macro perspective.
What matters most for me in this timeframe is the interaction between the 50 and 200 simple moving averages.
— Ali Charts (@alicharts) March 6, 2026


A similar pattern is observed in 2017, when Bitcoin declined by 67% from its market peak before the appearance of the death cross, which triggers an additional 50% crash. For the last market cycle, the 50/200 SMA death cross appeared in May 2022, when Bitcoin was prominently down by 58% from its cycle top. Thereafter, BTC investors would experience another 46% devaluation.
According to data from CoinMarketCap, Bitcoin is presently down by 45.62% from the present cycle high of $126,100 following an extended bearish phase that has lasted since October. Notably, price movement has also minted another death cross on the 3-day chart, indicating a potential major downside could occur based on precedents. In this case, Bitcoin may fall by an additional average 49% to establish a potential bottom around $33,500. However, Martinez warns that this price setup provides no bearish guarantee, but only historical alignment with macro bottom formations.
Bitcoin Price Overview
At the time of writing, Bitcoin trades at $68,235 following a 4.21% decline in the last 24 hours. Following recent positive price action, the maiden cryptocurrency is up by 3.59% on its weekly chart. However, Bitcoin remains far off a bullish turnaround as indicated by current losses of 4.49% on the monthly chart.
]]>The XRP price has been exhibiting a complex pattern of consolidation and retracement for weeks. However, according to prominent market analyst Egrag Crypto, there’s a critical signal to watch for that could determine whether the cryptocurrency’s bullish narrative remains intact or not. The expert’s analysis, shared on X social media, highlights that the behaviour of XRP’s 3-day candles could soon decide the direction of its next major move.
XRP Price Integrity Hinges On 3-Day Candle Closes Below $2
In his post on X, Egrag Crypto explains the “measured move breakdown” for XRP, identifying a key technical formation in the form of a descending triangle that, based on its structure, points to a potential move toward $2.14. The accompanying chart shows XRP hovering between $2.40 and $2.60, with multiple retests of the same price levels over the past few months. Despite the brief wick to the downside, Egrag Crypto suggests that the structure continues to indicate consolidation within the range.
Related Reading
The analyst reiterates that $2.65 remains a critical price target for XRP. If the cryptocurrency breaks and sustains above it, he predicts that it could regain upward momentum, potentially paving the way for renewed bullish sentiment. However, failure to hold current levels around $2.5 might expose XRP to deeper retracements, particularly if 3-day candles start closing below the $2.00 to $1.91 range.

Egrag Crypto warns that this specific candle behaviour is concerning, as it could signal a structural breakdown of XRP’s market cycle. It could also invalidate his bullish thesis, suggesting that the recent peak near $3.65 may have been the cycle top.
Additionally, the analyst’s chart shows XRP’s price action hovering above the 200 Exponential Moving Average (EMA), serving as a long-term support level. Should XRP maintain its position above this moving average, Egrag Crypto asserts that the cryptocurrency’s bullish setup remains valid. He noted that the next 60 to 90 days are expected to be crucial, as XRP’s reaction around the levels mentioned above could define the trajectory of the rest of the year.
XRP Faces 57% Chance Of Breaking To A New ATH
In a separate analysis, Egrag Crypto introduced a 57% to 43% probability model, sharing his broader perspective on XRP’s potential price direction in the short term. He stated that there is a 57% probability that XRP could break into a new all-time high in the coming months. He also sees a 43% chance that the cryptocurrency could decline significantly, offering traders another opportunity to accumulate it at a price below $1.
Related Reading
While the probabilities of XRP’s near-term price favor a more bullish outcome, the bearish case remains plausible given the lingering macroeconomic uncertainty and overall crypto market volatility. Egrag Crypto notes that he is personally positioning himself toward the bullish scenario, aligning his expectations with the 57% chance of a major price breakout.
Featured image from iStock, chart from Tradingview.com

- Mr Beast bought 538,384 ASTER tokens in the past three days.
- He accumulated the dip, purchasing at $1.87 average price.
- Aster DEX resolved a technical trading issue today and compensated affected users in USDT.
Experienced market players are taking the current market downturn as a chance to buy at lower prices.
On-chain data shows popular YouTuber Mr Beast purchased 538,384 ASTER coins in the past three days.
The star had deposited $1 million in USDT using two wallets, withdrawing tokens worth approximately $990,000.
MrBeast(@MrBeast) bought 538,384 $ASTER($990K) over the past 3 days.
He deposited 1M $USDT into #Aster using public wallet 0x9e67 and new wallet 0x0e8A, then withdrew 538,384 $ASTER.
The average buying price was likely ~$1.87.https://t.co/Gm7MPrUqEk pic.twitter.com/cntXZ9XEQP
— Lookonchain (@lookonchain) September 26, 2025
Details show Mr Beast executed his transaction when ASTER traded at around $1.87 per coin, indicating what many consider a smart “dip buying strategy.
Aster has gained traction lately as perpetual decentralized exchanges dominate trends that Hyperliquid began weeks ago.
Native ASTER has been on steroids this week, soaring continuously from $0.10 on September 17 to all-time highs above $2.4 as of September 24.
However, it has lost the upward steam due to broader market bearishness and profit booking.
ASTER is trading at $1.88 after losing more than 10% of its value within the last 24 hours.
Despite the downside, massive whale actions signal confidence in solid rebounds.
Mr Beast’s bet on Aster has triggered optimism among enthusiasts who anticipate significant growth as the altcoin gains visibility.
One X user commented:
Celebrity entries like this tend to draw mainstream attention, interesting to see how retail sentiment reacts around ASTER after Mr Beast’s move.
Aster DEX sparks debates with swift issue resolution
Mr Beast’s purchase news emerged as the decentralized exchange faced a technical challenge early today.
The team reported abnormal price actions on the XPL trading pair, which liquidated some users.
Meanwhile, the DEX reacted swiftly, solving the issue and reimbursing affected users.
Individuals received compensation in USDT, covering all losses, including liquidation and trading fees.
The official announcement declared:
Compensation for the XPL perp incident has now been fully distributed. All affected users have received reimbursement directly in USDT to their accounts.
Update on XPL perp incident: Another round of compensation for including trading fees and liquidation fees has now been fully distributed.
All affected users should have received the full amount of reimbursement directly in USDT to their accounts.
— Aster (@Aster_DEX) September 26, 2025
The DEX emphasized transparency during the recovery process and urged users with concerns to reach out to the support through Discord.
The prompt action won traders as it reinforced trust in Aster’s ability to safeguard users and ensure transparency during downtimes.
ASTER Price action
The native token trades at $1.88 after dropping over 10% in the previous 24 hours.
ASTER mirror prevailing broader declines, which escalated after the latest USD GDP data revision.
Nevertheless, experts believe the current bearish performance won’t last, forecasting swift rebounds as October approaches.
Investor and analyst @Eljaboom says ASTER is about to explode to $3 as it completes its correction phase.
$ASTER correction is now over and the next target is $3 ?https://t.co/AXnezpiSjm pic.twitter.com/mOI7jeQ0jH
— Elja

(@Eljaboom) September 26, 2025
That would translate to an approximately 60% gain from the market price.
Besides endorsement from Binance’s CZ, Aster gains traction as it taps a unique niche, which looks to dominate the upcoming bull run.
Perpetual DEXs are attracting attention as they blend DeFi’s transparency and self-custody with CEX-like speed, liquidity, and performance.
Dogecoin Price Cycle Nears New Peak: Modified 3-Day Gaussian Channel Reveals Key Red Zones Bitcoinist
Source link ]]>
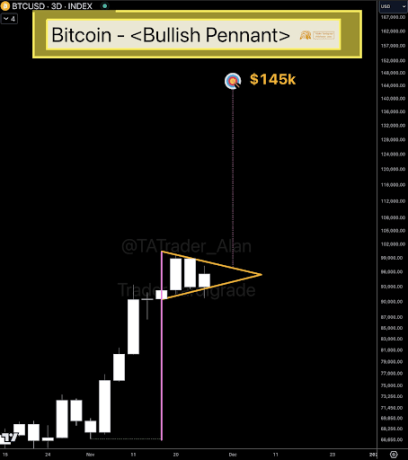
Although currently undergoing a brief correction after almost touching the $100,000 price level, technical analysis has shown the emergence of a bullish pattern on the Bitcoin price chart.
Notably, the correction has given rise to the formation of a bullish pennant on the 3-day candlestick Bitcoin price chart. This development might be the bullish momentum needed to eventually break past the $100,000 price threshold. However, the anticipated breakout is not just above $100,000, but a run that would send the cryptocurrency to $145,000.
Bullish Pennant Emerges On Bitcoin Price Chart
Recent price action in the past 24 hours has seen the Bitcoin price returning to the $96,000 price level after spending the majority of the week on a correction path. Particularly, this correction saw the Bitcoin price hitting a low of $91,000 as many traders took profit.
Related Reading
Notably, this back-and-forth movement of the BTC price has given rise to the formation of a small bull pennant. Crypto analyst Trader Tardigrade, known for his technical analyses, pointed out this formation on social media platform X. In his post, he stated, “Small Pennant Big Target,” while pointing to the formation on the 3-day candlestick Bitcoin price chart.
A bullish pennant is a continuation pattern that often emerges during strong uptrends. It begins with a sharp price movement (the flagpole), followed by a consolidation phase (the pennant), before potentially breaking out in the same direction as the initial trend.
The emergence of this bullish pennant on Bitcoin’s 3-day chart suggests that the cryptocurrency may be gearing up for another leg higher. However, the formation suggests that the Bitcoin price could still continue to consolidate for a while as the liquidity in the pennant is yet to be filled. Nonetheless, Trader Tardigrade’s analysis highlights the longer-term implications of this formation. According to his projections, once Bitcoin completes its consolidation and breaks out of the pennant, it could surge toward an ambitious price target of $145,000.
The $145,000 price target has become somewhat recurring among crypto analysts. For instance, this price target also made its way into an analysis by crypto analyst Tony Severino, whose analysis pointed to the Bitcoin price top for this cycle at around $145,000.
$100,000 Price Target Still In Play
At the time of writing, the BTC price is trading at $96,070 and is up by 0.5% in the past 24 hours but down by 3.3% in the past seven days. The possibility of the Bitcoin price reaching the $100,000 price mark is not a matter of if at this point but of when.
Related Reading
Speaking of when, the BTC price is about to witness another catalyst that could finally send it above $100,000. Bitcoin is about to undergo its largest monthly options expiry of 2024 on Friday, involving a total exposure of $13.6 billion. This expiry event could provide the momentum needed for bullish traders to drive Bitcoin’s price past the $100,000 milestone in the coming week.
Featured image created with Dall.E, chart from Tradingview.com
Cardano Price Analysis: ADA Flashes $67.5M BUY Signal after 3-Day Consolidation The Crypto Basic
Source link ]]>
Dogecoin Flashes Major Bullish Signal On 3-Day Chart, Here’s The Target NewsBTC
Source link ]]>
In recent on-chain data from Spot On Chain, an Ethereum whale appears to have engaged in significant accumulation activity, sparking interest and speculation within the ETH community.
According to the platform, the whale address in question has purchased a total of 64,501 ETH in the past three days, amounting to roughly $187 million at current market prices,
Ethereum Whale Accumulation
Spot On Chain reported that earlier today, the whale acquired approximately 13,526 ETH at an average price of $2,947 per ETH. This accumulation, valued at over $39 million, adds to the already substantial holdings of the whale, suggesting a bullish outlook on Ethereum’s future trajectory.
The platform’s data further reveals that the whale withdrew 10,136 ETH from Binance while purchasing 3,390 ETH from 1inch. These purchases have compounded the whale’s accumulation of ETH in the past three days to a total of 64,501 ETH.
Additionally, Spot On Chain highlights the withdrawal of an additional 40 million USDT from Binance, prompting speculation regarding its potential use for further Ethereum purchases.
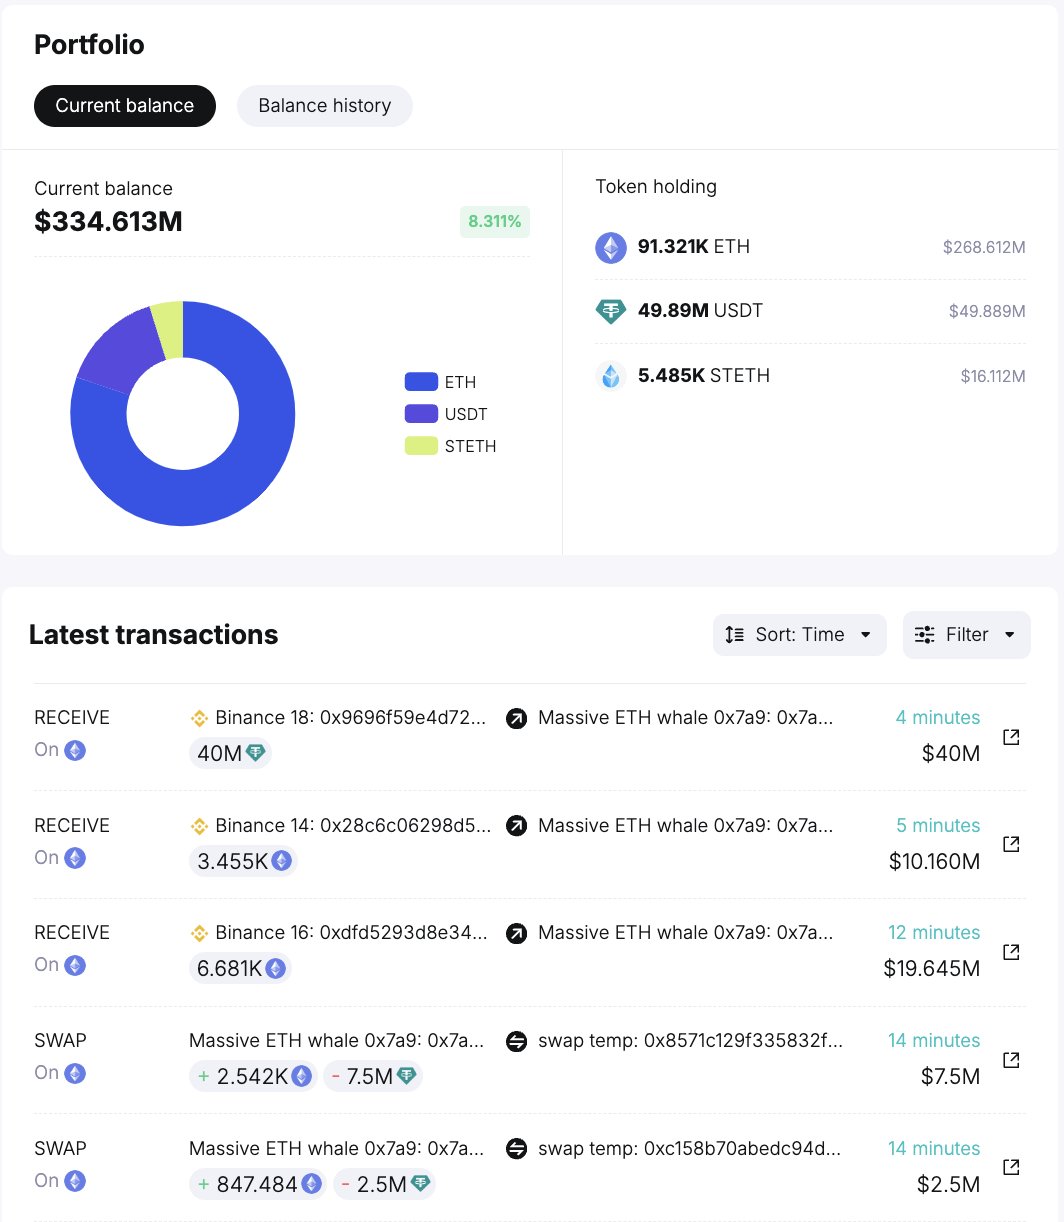
According to the portfolio image above that Spot On Chain shared, the whale’s wallet holds a total of 91,321 ETH, in addition to approximately $49.8 million worth of USDT and 5,485 STETH. These assets, in total, are estimated to be $334 million.
Giant whale 0x7a9 allegedly bought 13,526 $ETH ($39.85M) at ~$2,947 again!
• withdrew 10,136 $ETH ($29.85M) from #Binance
• bought 3,390 $ETH with 10M $USDT #1inchOverall, the whale has bought 64,501 $ETH ($185.5M) in the past 3 days!
It also withdrew another 40M $USDT from… https://t.co/UHIVXfx6Wq pic.twitter.com/ySbvIv2mux
— Spot On Chain (@spotonchain) February 21, 2024
Ethereum’s Price Action And Expert Sentiment
Ethereum has continued to showcase bullish momentum, trading up by nearly 6% over the past week. However, despite briefly surpassing the $3,000 mark, Ethereum has retraced slightly in the past 24 hours, trading around $2,900 at the time of writing.
This pullback has not dampened optimism within the crypto community, with many anticipating further upward movement. Industry experts have weighed in on Ethereum’s performance, with Stefan von Haenisch of OSL SG Pte in Singapore noting the cryptocurrency’s potential to outperform Bitcoin in the coming months.
Haenisch attributes this optimism partly to speculation surrounding the potential approval of spot Ethereum exchange-traded funds in the US. Michaël van de Poppe, CEO of MN Trading, echoes this sentiment, forecasting a potential surge for Ethereum to $3,800 to $4,500 shortly.
#Ethereum is on its way towards $3,800-4,500. pic.twitter.com/TfoBGloBsH
— Michaël van de Poppe (@CryptoMichNL) February 19, 2024
Featured image from Unsplash, Chart from TradingView
Disclaimer: The article is provided for educational purposes only. It does not represent the opinions of NewsBTC on whether to buy, sell or hold any investments and naturally investing carries risks. You are advised to conduct your own research before making any investment decisions. Use information provided on this website entirely at your own risk.

Prominent meme coin trying to replicate November’s 120% rally
As we have mentioned in our recent market review, Dogecoin is gradually gaining momentum on the market, with the 3-day return of the current rally reaching 20%, which creates the foundation for a solid run to highs we saw back in the beginning of November.
Six days ago, DOGE successfully bounced off of the local support level and then started its way up. In less than a week, the leading meme currency has gained more than 35% to its value, leaving alternatives like Shiba Inu way behind in terms of market performance.

Such explosive performance could be tied to a number of factors, including Elon Musk’s desire to build his own “Tesla Phone” if Twitter gets delisted from all major application stores on mobile devices.
As an alternative to payments, cryptocurrencies like Dogecoin might get implemented inside the app, making payments from all over the world possible, with no limitations whatsoever thanks to the decentralized nature of Dogecoin’s blockchain that mostly replicates Bitcoin.
However, there’s more behind DOGE’s rally than Musk’s integration. According to technical indicators like exponential moving averages, Dogecoin is moving on the verge of a reversal as the 200- and the 50-day moving averages are getting extremely close to each other.
Historically, line convergence leads to a volatility spike in either direction, which, in Dogecoin’s case, will most likely lead to an acceleration and continuation of the current rally, especially if the aforementioned rumor gains more traction among cryptocurrency investors.
At press time, Dogecoin is moving at $0.099, actively trying to break the $0.1 psychological threshold. In case of success, the next price level to conquer would be $0.11 — a breakdown point during the previous 120% rally.
According to Tradingview, the world’s most popular cryptocurrency, Bitcoin, hit a new low of $20,828 at the start of the week. Because of this new pricing, BTC lost 16.54% of its value in less than a day- almost $5,000 in value.
Although being the largest and most famous cryptocurrency, Bitcoin is notorious for its huge climbs and equally dramatic declines. For example, BTC skyrocketed to an all-time high of over $69,000 in November 2021, then plummeted to just under $30,000 by the start of 2022.
Related Reading | Bitcoin Long-Term Holders Realize March 2020-Like Losses As BTC Crashes
Bitcoin’s value peaked above $30,000 on June 1, 2022, but dropped below that the next day. It is currently trading below $22,000. This decrease is linked to TerraUSD, a stablecoin, breaking its $1 peg and Luna subsequently falling.
In addition, it reflects global financial uncertainty driven by increasing inflation as investors seek to sell “riskier assets” such as cryptocurrencies.
The Bitcoin 3-Day Chart Indicates March 2020 Crash
The 3-Day Bitcoin chart Indicates a recurrence of the March 2020 Crash, based on the present state of the BTC market. Bitcoin’s popularity as a safe-haven asset began to wane in March 2020. It had lost half of its value in only two days.
After opening the week above $9,000, the cryptocurrency suddenly fell below $4,000 on March 13, 2020. However, as of the end of U.S. markets, it had returned to around $5,400.

Bitcoin is currently trading below $22,000 on the daily chart | Source: BTC/USD chart from TradingView.com
For the March 2020 crash, Joe DiPasquale, CEO of BitBull Capital, said that the global pandemic of the coronavirus caused investors to move their money into cash as a form of protection.
He further added that Bitcoin’s potential as a safe-haven asset is being questioned due to this steep decrease. But feels it is too early to look for any links between Bitcoin and other asset classes.
Reason Behind Bitcoin Plunging To New Lows
One factor contributing to bitcoin’s new lows is the halting of all withdrawals, transfers, and swaps between accounts by Celsius.
Celsius, a DeFi platform and one of the largest crypto lenders has been a significant cause of mistrust in the Bitcoin market.
Related Reading | Rich Dad, Poor Dad Author Changes His Mind About Bitcoin? BTC Crashes To $23K
The network announced they had paused withdrawals, swaps, and transfers between clients via Celsius. This announcement was made in the early hours of June 13, following Bitcoin’s slide below $24,000 and the whole crypto market losing about $250 billion in only seven days.
As the company’s announcement stated:
Due to extreme market conditions, today we are announcing that Celsius is pausing all withdrawals, Swap, and transfers between accounts. We are taking this action today to put Celsius in a better position to honor, over time, its withdrawal obligations.
Featured image from Flickr and chart from TradingView.com