A drop to $54,000 could mark one of the strongest buying opportunities in Bitcoin’s current cycle, according to on-chain data analysts — but the price still sits roughly 20% above that level, and some market watchers say the bottom may not yet be in.
Related Reading
Realized Price Draws Attention From Long-Term Investors
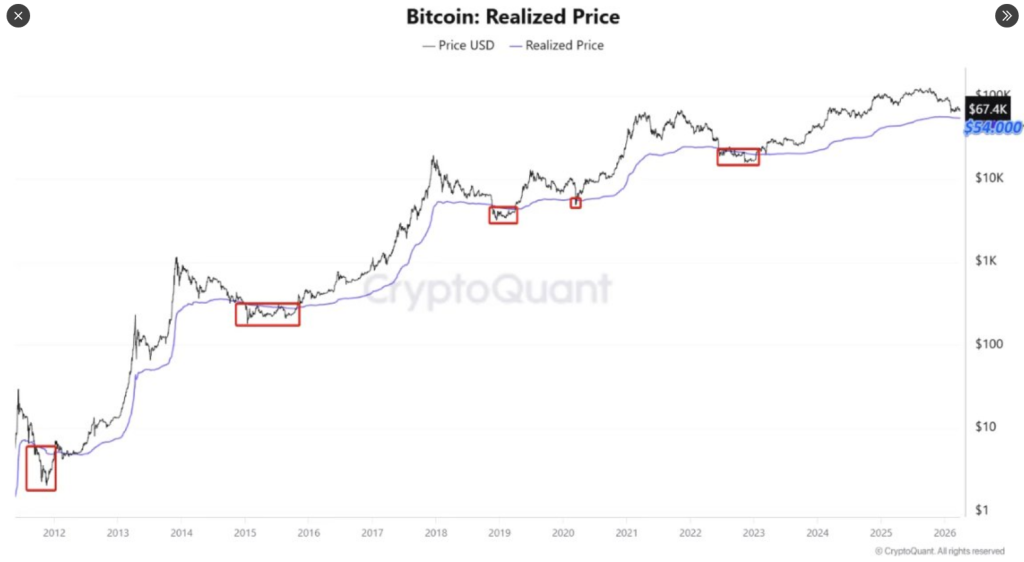
The metric at the center of the conversation is Bitcoin’s Realized Price, currently near $54,000. Unlike the daily spot price, this figure reflects the average cost at which every coin on the network last changed hands.
When Bitcoin trades below that level, data shows the market has often been in the grip of fear-driven selling — and historically, those moments have attracted long-term buyers looking to accumulate at a discount.
CryptoQuant analyst Tugce highlighted the metric in a recent breakdown, pointing to past cycles where Bitcoin crossed below its Realized Price and later staged significant recoveries.
Bitcoin’s Best Buy Zone? History Says This Is It!
“Below 54,000 dollars, Bitcoin is cheap compared to the market average, and it is a perfect place to make gradual accumulation and collect Bitcoin.” – By @cryptometugce pic.twitter.com/S9j9Eh7LqX
— CryptoQuant.com (@cryptoquant_com) March 31, 2026
She cautioned, though, that investors should not expect a quick turnaround. Recovery timelines have ranged from as few as seven days to more than 300 days in past cycles, and prices can continue falling even after crossing below that threshold.
Bitcoin is currently trading at around $67,250 and has lost around 20% so far this year. This decline has been going on for the last five months, starting in October 2025. So far, the total decline from the peak is around 40%.
Whale Activity And Institutional Demand Raise Caution Flags
Not everyone is looking at the Realized Price with the same level of optimism. According to CryptoQuant’s statistics, whales are moving a lot of Bitcoin into the popular exchange platform Binance. This could possibly be a precursor to a sell-off.
The Whale Ratio on the Binance exchange rose from 0.39 on March 25 to 0.66 on March 29 before paring some of the gains. On March 29 alone, the exchange received a net of 2,003 Bitcoins valued at around $134 million.
Additionally, the Coinbase Premium Index has once again gone into the red, which could indicate a decrease in institutional interest in the asset class.
Global pressures on the markets are also a factor in the current decline of the asset class. Geopolitical tensions and oil prices are at a high, and the bond market is struggling. This has caused a lot of pressure on the asset class in the last few months.
Earlier in March, the asset class fell to a low of $65,000 due to the high level of volatility in the markets.
Related Reading
On average, around now is when #Bitcoin continues its decline in midterm years. pic.twitter.com/JZ7Rcx2wJY
— Benjamin Cowen (@intocryptoverse) March 27, 2026
Pattern From Past Cycles Points To Possible Continued Weakness
According to crypto analyst Benjamin Cowen, the current scenario in the markets is similar to the midterm cycles of 2014, 2018, and 2022. This is the period when the asset class loses steam between the second and third quarters of the year after a strong bull run in the first half of the year.
Therefore, according to this pattern, the current weakness could continue into the future. According to the technical analysis of the asset class’s chart, a bear flag formation could cause the asset class to fall between the range of $50,000 and $41,000.
Featured image from Meta, chart from TradingView
Over the past few days, the Bitcoin price has had one of its better performances so far in the first quarter of 2026. Catalyzed by the rising geopolitical tensions between US-Isreal and Iran, the premier cryptocurrency climbed to $74,000 over the past week.
However, the Bitcoin price did not take long before retreating back below the psychological $70,000 level, confirming that the latest rally was merely a relief. With the bearish market structure still in place, it remains to be seen how low the price of BTC will go in its current phase.
$70 Million Worth Of Longs At Risk Of Liquidation
In a new post on the social media platform X, crypto analyst Ali Martinez revealed why a further decline to around $54,000 in the remaining period of this phase is possible and could be bad news for both investors and the Bitcoin price. Hence, the $54,000 mark could be an extremely pivotal region for the flagship cryptocurrency in this bear market.
Related Reading
Martinez’s evaluation revolves around the Aggregated Liquidation Levels Heatmap metric, which visualizes price zones with high concentrations of long or short liquidations. As expected, the red (hot) color on the map signifies a concentrated liquidation point of several high-leverage positions, often with high liquidity.
A drop to $54,000 could liquidate over $70 million in Bitcoin $BTC long positions. pic.twitter.com/Ar66Q3Cd20
— Ali Charts (@alicharts) March 7, 2026
These high-liquidity spots often have a somewhat magnetic effect, with prices often drawn to them. According to Martinez, this “hot” zone for the Bitcoin price lies around the $54,000 mark, with over $70 million worth of long positions at risk of liquidation.

Ordinarily, a Bitcoin price drop to around $54,000 would do extra damage to the already low market sentiment. Meanwhile, from a technical perspective, the significant liquidation cascade likely to occur at that level could lead to a phenomenon called a “Long Squeeze,” where the flagship cryptocurrency continues its decline with renewed momentum.
For clarity, a Long Squeeze typically occurs when the falling price of a cryptocurrency (in this case, Bitcoin) forces bull traders to sell their assets either to cut losses or to break even. This sell-off catalyzes the ongoing bearish reaction and sends the BTC price further downwards.
Ultimately, the $54,000 region, which is also around the realized price, appears to be one of the most critical levels for the Bitcoin price trajectory over the next few months.
Bitcoin Price At A Glance
As of this writing, the price of BTC stands at around $67,830, reflecting an over 4% decline in the past 24 hours. Since reaching its one-month high around $74,000 on Wednesday, March 4, the premier cryptocurrency has retraced by nearly 10%.
Related Reading
Featured image from iStock, chart from TradingView
Bitcoin is facing a fresh downside risk due to a potential U.S. military strike on Iran, as President Donald Trump suggested. The leading crypto is also at risk of further decline, as CryptoQuant flagged weakness in key on-chain support levels. Bitcoin At Risk As Trump Weighs Limited Strike On Iran Bitcoin and the broader crypto
The post CryptoQuant Flags $54K Bitcoin Risk As Trump Considers Limited Strike On Iran appeared first on CoinGape.
]]>This token may turn $540 into $54K in 9 weeks, echoing Shiba Inu and Solana’s 2021 surge crypto.news
Source link ]]>
Earlier today, the world’s largest cryptocurrency Bitcoin (BTC) took a dive under $59,000 before bouncing back above the crucial support of $60,000. Popular crypto analyst Willy Woo explains that the recent Bitcoin price correction has managed to flush out excessive leverage in the market, however, we’re not done yet.
Bitcoin Price Correction and Long Liquidations
The Bitcoin price correction was exacerbated following the Mt. Gox Bitcoin repayment announcement on Monday, June 24. Popular crypto analyst Willy Woo noted that the market has been flushing out excess leverage taking out the initial target of $62,500.
Despite this, speculators have continued to add new long positions leading to further liquidations in a cascading long squeeze. this led to the BTC price dropping further to $58,000 earlier today.

Along with the liquidation squeeze, Woo points out that the effect of post-halving Bitcoin miner capitulation still continues to hover around. As we know, Bitcoin miners have been selling heavily to finance their hardware upgrades as mining difficulty has spiked considerably. This led to the liquidation of the weakest miners forced to shut down their shops.
BTC Short-Term Reversal But $54,000 Likely
Woo stated that technical indicators are pointing out a Bitcoin price reversal. Bitcoin has behaved exactly as per Woo’s prediction, reversing from the lows under $59,000, and currently trading at $61,500 levels.
However, the analyst has further cautioned that Bitcoin is still not entirely out of the woods. The market still needs to figure out how much speculative excess has been flushed out so far. Without a significant reduction in the BTC futures position, the Bitcoin price won’t move upward sustainably.
$54k is the next layer of liquidations. And to do that, it’s so far below short term holders price that it would tip BTC into a bearish phase. (STH price is a line in the sand between bull and bear regimes.)
This is hard to do within the macro structure. pic.twitter.com/fjOk2Ss2wC
— Willy Woo (@woonomic) June 24, 2024
Woo believes there’s a good enough chance that Bitcoin can see new lows and that the next key level to watch for would be $54,000 where another layer of liquidations would occur. Dropping to this level will push BTC below the price point of short-term holders, thereby typically dipping into the bearish phase.
Woo further emphasized that this level serves as a critical boundary between the bearish and the bullish market regimes and falling under this would be critical considering the current macro setup.
The presented content may include the personal opinion of the author and is subject to market condition. Do your market research before investing in cryptocurrencies. The author or the publication does not hold any responsibility for your personal financial loss.
Bitcoin is currently trading above $57,000 rekindling hopes that BTC might get to new record highs before year-end. Regaining last week’s losses triggered by the new Omicron Coronavirus variant and fears around regulations in India, Bitcoin price crossed above the $58,000 psychological level on Sunday nigh and is still up 5.77% over the last 24 hours.
The BTC price forecast remains uncertain for many for the remaining part of the years as fears around Corona remains. Bears still have the choice of taking advantage of the leveraged bulls against the backdrop of the recent rally.
Against this background and the month set to end in two days, it is important to understand how technical will shape BTC’s performance this week.
Bitcoin Price Bounces Off The 100 SMA
BTC/USD bounced off the 100-day Simple Moving Average (SMA) around $54,202 over the weekend as Bitcoin price rose to produce a weekly close of $57,248 according to data from CoinMarketCap. With this closure, BTC avoided its lowest weekly closure in two months.
Note that regaining the $58,000 level is crucial for BTC bulls sustaining the uptrend. At the time of writing, the big crypto is exchanging hands at $57,410 and is struggling to push above the downtrend line. A break out above the resistance line will see Bitcoin rise to tag the $60,000 psychological level.
The upward movement of the Relative Strength Index (RSI) indicator accentuates this bullish outlook.
BTC/USD Daily Chart
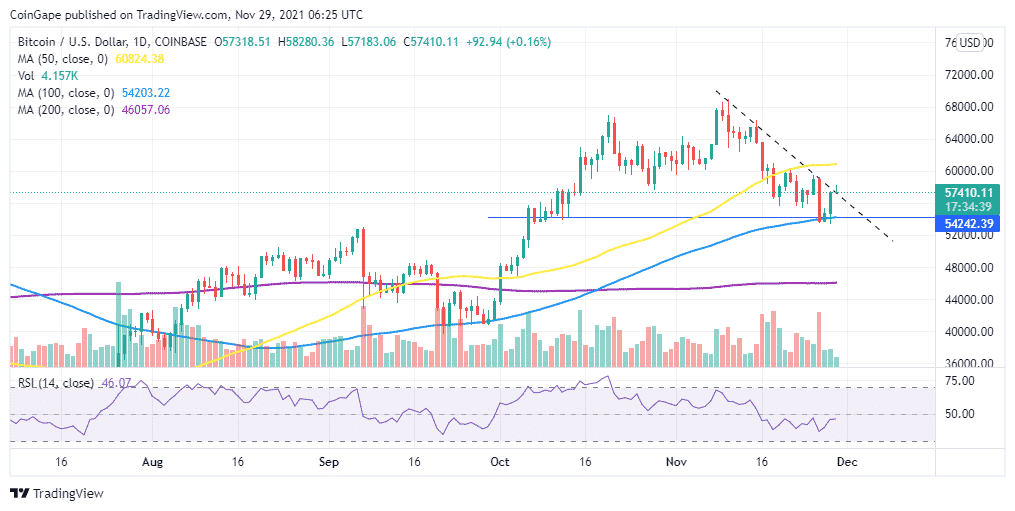
However, the RSI is still positioned in the neutral zone at 46.01 indicating that the overhead pressure might still push the BTC price further down.
Note that the $60K level remains untouched even after the rebound as BTC has been fiercely rejected from this point since flipping it into resistance on November 18.
However, there is still optimism from the Bitcoin community that the asset will close the Month above $60,000. Well, we have less than 48 hours to find out.
Disclaimer
The presented content may include the personal opinion of the author and is subject to market condition. Do your market research before investing in cryptocurrencies. The author or the publication does not hold any responsibility for your personal financial loss.
About Author
The news of the latest COVID variant is invoking a fresh wave of FUD among investors, with Bitcoin crashing down to $54k, and markets across the board slipping into the red.
Bitcoin Plunges To $54k As News Of COVID Variant Emerges
Financial markets are moving into the red on Friday as news of a new COVID variant makes investors around the world worried.
According to a BBC report, this new variant was discovered in South Africa, and scientists have found it to be the most heavily mutated version so far.
Not much is clear about the variant’s properties yet, but what looks to be most worrying so far is that this version of COVID may be vaccine resistant due to the large number of mutations.
The Director of the Centre for Epidemic Response and Innovation in South Africa, Prof. Tulio de Oliveira, said “This variant did surprise us, it has a big jump on evolution [and] many more mutations that we expected.”
If it indeed turns out to have strong immunity to the vaccine, then vaccination efforts so far may become ineffective, and nations around the world may look at enforcing new lockdowns.
Because of these fresh COVID concerns, investors have started to de-risk their holdings. This sell off has taken Bitcoin down to $54k.
Related Reading | Bitcoin Thanksgiving Day Data Reveals Peak Possible Within 30 Days
Here is a chart that shows the trend in the price of BTC over the past day:

BTC's price plummets down | Source: BTCUSD on TradingView
As the above graph shows, Bitcoin is currently down 8% in the day so far, but earlier it went down to as low as $53.5k.
Almost $200 million in BTC was liquidated in the past 12 hours alone as traders are looking to catch the bottom with leveraged longs.

BTC liquidation data over the past 24 hours | Source: coinglass
What Could Be Next For BTC’s Price?
Just yesterday, Bitcoin’s price finally started to show some recovery from the decline that followed its new all-time high as the crypto broke past $59k once again.
Related Reading | JPMorgan Lists Ethereum As A Better Investment Than Bitcoin
The below chart highlights the trend in the price of the crypto over the past few days.

BTC's price almost started on the path to recovery before this crash | Source: BTCUSD on TradingView
However, before this recovery could come to fruition, the news about the COVID variant arrived, and the price of the crypto once again crashed down.
At the moment, it’s unclear which direction Bitcoin might go in next. The coin may have already hit the bottom, but it’s possible that as more news about the variant surfaces, the coin may travel further down still.
Featured image from Unsplash.com, charts from TradingView.com
✓ Share: