Bitcoin price failed to stay above $70,000 and started another decline. BTC is now trading below $68,800 and might extend losses in the near term.
- Bitcoin is slowly moving lower below $68,800 and $68,000.
- The price is trading below $68,000 and the 100 hourly simple moving average.
- There is a bearish trend line forming with resistance at $68,200 on the hourly chart of the BTC/USD pair (data feed from Kraken).
- The pair might dip again if it trades below the $66,500 and $65,000 levels.
Bitcoin Price Dips Again
Bitcoin price failed to remain stable above the $70,000 zone. BTC started a fresh decline and traded below the $68,800 support zone. There was a push below $68,000.
The price dipped below the 50% Fib retracement level of the upward move from the $60,500 swing low to the $72,256 high. There is also a bearish trend line forming with resistance at $68,200 on the hourly chart of the BTC/USD pair.
Bitcoin is now trading below $68,000 and the 100 hourly simple moving average. If the price remains stable above $65,000, it could attempt a fresh increase. Immediate resistance is near the $68,200 level and the trend line.
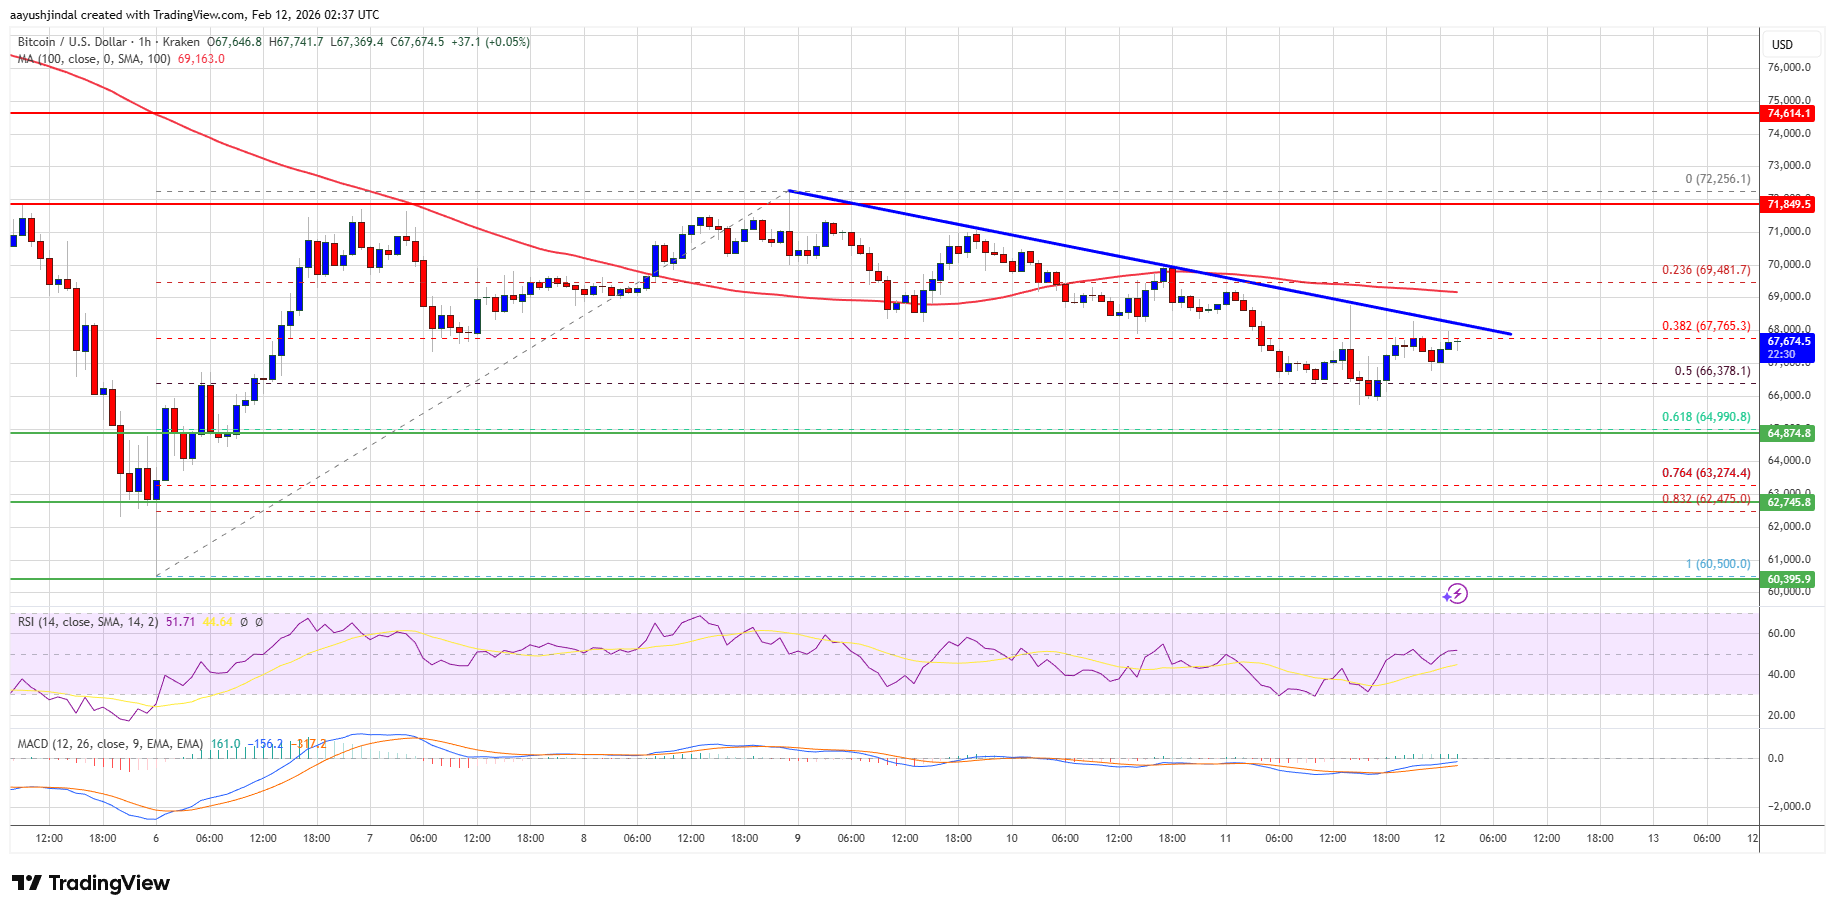
The first key resistance is near the $69,000 level. A close above the $69,000 resistance might send the price further higher. In the stated case, the price could rise and test the $70,000 resistance. Any more gains might send the price toward the $71,500 level. The next barrier for the bulls could be $72,000 and $72,500.
More Losses In BTC?
If Bitcoin fails to rise above the $69,000 resistance zone, it could start another decline. Immediate support is near the $66,000 level. The first major support is near the $65,000 level or the 61.8% Fib retracement level of the upward move from the $60,500 swing low to the $72,256 high.
The next support is now near the $63,500 zone. Any more losses might send the price toward the $62,000 support in the near term. The main support now sits at $61,200, below which BTC might struggle to recover in the near term.
Technical indicators:
Hourly MACD – The MACD is now gaining pace in the bearish zone.
Hourly RSI (Relative Strength Index) – The RSI for BTC/USD is now below the 50 level.
Major Support Levels – $66,000, followed by $65,000.
Major Resistance Levels – $69,000 and $70,000.
Crypto Prices Today: Bitcoin Drops 9% Below $65K As Cardano, Solana Tumble Eudaimonia and Co
Source link ]]>
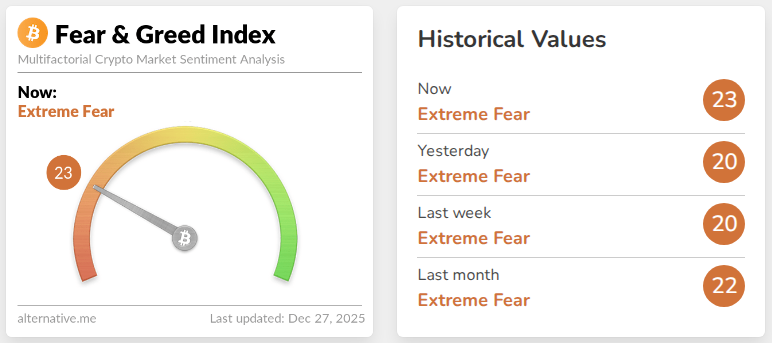
According to reports, Bitcoin’s outlook for 2026 is sharply divided as traders close the year. The coin was trading at $87,520 at the time of publication and is down 8% since Jan. 1, year to date. Market mood has been weak. The Crypto Fear & Greed Index hit 20 on Dec. 26, marking a stretch of two weeks labeled “extreme fear.”
Related Reading
Analysts Split On Market Direction
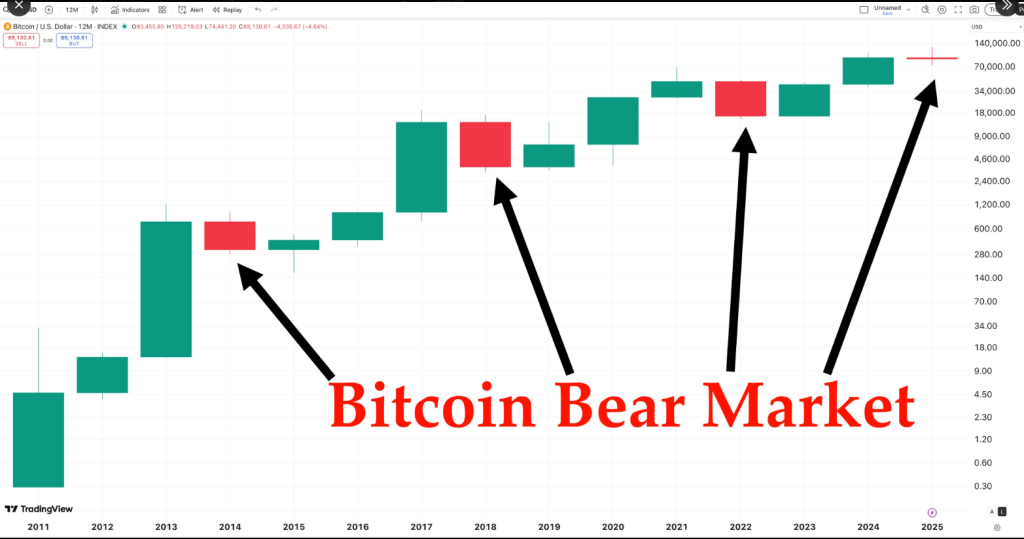
According to posts on X, Jan3 founder Samson Mow contend that 2025 was the bear market and that Bitcoin could be entering a bull run that lasts into 2035.
PlanC, another well-known analyst, posted that Bitcoin has never had two red yearly candles in a row and suggested that surviving 2025 meant surviving the bear phase. Those comments have been picked up across industry pages and sparked fresh debate.
2025 was the bear market. https://t.co/1ganX0YSbI
— Samson Mow (@Excellion) December 26, 2025
Some Big Price Calls Remain Bullish
Several prominent voices still expect sharp gains. Geoff Kendrick at Standard Chartered and Gautam Chhugani at Bernstein each forecast $150,000 for Bitcoin in 2026.
Charles Hoskinson, founder of Cardano, predicted $250,000 by 2026, pointing to constrained supply and rising institutional demand as the main drivers.
Arthur Hayes and Tom Lee also pushed big targets as recently as October, with $250,000 mentioned as a possible outcome by year-end.
Sentiment And Market Data
Based on reports, sentiment readings have not helped bullish momentum. The fear index that reached 20 on Dec. 26 stayed in “extreme fear” territory for multiple days.
At the same time, Bitcoin’s price sits below many earlier projections. Market watchers note the coin is under pressure even though several forecasts remain optimistic.
Bears Put Forward Sharp Downside Scenarios
Mike McGlone, senior commodity strategist at Bloomberg Intelligence, expects a decline of roughly 60% from the historical peak above $126,000 by 2026.
Jurrien Timmer of Fidelity warned that 2026 could be a “year off,” with prices possibly falling toward $65,000. Those views rely heavily on historical drawdowns and macro headwinds.
They carry weight because large drops have happened before, though past behavior does not guarantee future action.
Where The Numbers Diverge
The spread of projections is wide. Some firms suggest about $150,000, which would represent roughly 74% upside from a cited $86,000 level.
Others point to $250,000, while downside scenarios reach $65,000 or worse when measured from the $126,000 peak.
That gap shows how different assumptions about supply, demand from institutions, and macro conditions lead to very different price targets.
Related Reading
Traders and asset managers will be watching flows into regulated products, corporate treasury moves, and changes in on-chain demand. Headlines and big calls make for talk, but actual flows often decide short-term moves.
Volatility is likely to remain, and the wide range of forecasts suggests that both sharp rallies and sudden drops are possible in 2026.
Featured image from Pexels, chart from TradingView
Shiba Inu Price Prediction: Expert Sees Bitcoin Bottoming at $65K in 2026, While DeepSnitch AI Surges 92% CoinCentral
Source link ]]>
According to data from blockchain analytics firm Glassnode, a group of mid-sized Bitcoin holders has stepped up buying this week, taking in roughly 65,000 BTC over the past seven days.
Related Reading
At a spot price of $113,595, that haul equals about $7.35 billion. Reports have disclosed that these investors — wallets holding between 100 and 1,000 BTC — have pushed their monthly net accumulation to 93,000 BTC.
Sharks Expand Their Holdings
Those mid-sized holders a.k.a. “sharks” now control about 3.65 million BTC. That is roughly 18% of Bitcoin’s circulating supply, which is about 19.91 million coins.
The shift is striking because it removes a meaningful chunk of coins from the pool of easily traded supply. Less available BTC can change how quickly prices move when demand rises.
#Bitcoin entities holding 100–1k #BTC (“sharks”) have sharply ramped up accumulation. Over the past 7 days, their holdings grew by ~65k $BTC. The pace of accumulation has grown as well, with a 30D net increase of 93k $BTC. This group now holds a record 3.65M $BTC. pic.twitter.com/MRcIPcTB1T
— glassnode (@glassnode) September 11, 2025

What This Means For Supply And Demand
While these sharks are not the same as the very large institutional whales, their moves still affect market balance. Buying at this scale reduces liquid supply and can push prices up if fresh buying keeps coming.
Some market participants see the pattern as a sign of growing confidence among this class of investors. At the same time, it can raise short-term volatility: when a concentrated group holds more coins, their future decisions to sell or hold will matter.
Market Moves And Recent Price Action
Bitcoin’s run this year has been strong. Based on market tracker numbers, BTC has climbed about 100% over the past year, is up 23% year-to-date, and has gained over 40% over the past six months.
Price action has not been smooth, though. The market fell to about $107,000 on September first, then recovered to a little over $116,000 earlier today. At the time of writing, BTC was inching near $114,000.
Forecasts And Investor Expectations
Public forecasts have been bold. Strategy executive chairman Michael Saylor has suggested Bitcoin could top $150,000 by Christmas. Tom Lee of Fundstrat has forecast $200,000 by the same date.
Related Reading
Risks And What To Watch For
This aggressive accumulation comes with caveats. Markets can reverse quickly. Large inflows into or out of ETFs, miner sell pressure, or a shift in macro conditions could halt the rally.
Also, heavy concentration in certain wallet groups can amplify moves if those groups change course. Investors should watch wallet flows, trading volumes, and major announcements that might tilt sentiment.
In short, the recent buying by mid-sized holders is a clear, measurable trend. It tightens the pool of coins available to trade and has coincided with strong price gains this year.
Featured image from Meta, chart from TradingView
Bitcoin’s third-quarter performance stands at 0.89% after dropping 3.47% on September 30. Many in the crypto space expect a bullish start to October and the fourth quarter. Echoing these sentiments, Bitcoin price is up 1% today and trades at $63,955. What can investors expect next from BTC?
Why Did Bitcoin Rally to $65K?
The seven-month consolidation has caused BTC price to rotate in a cyclical fashion. In the past five months, local tops and bottoms have formed in the first or third weeks of every month.

After Bitcoin’s 10% crash in the first week of September, it formed a local bottom on September 6 and kickstarted a 26% rally to $65k. This is a simple, straightforward reason for why Bitcoin rallied to $65K. However, the macroeconomic policies also influenced BTC’s aforementioned move.
A portion of this uptrend was driven by the US Federal Reserve’s 50 basis point rate cut decision on September 18. The other half of it can be attributed to the interest rate cut from the Chinese central bank coupled with stimulus package.
Interestingly, this move from China has caused the stock market to note the biggest single-day rally since 2008.
Bitcoin’s Strong Recovery in Question
Historical price performance has caused investors to flip bullish with the start of the fourth quarter. Bitcoin price data for the past 13 years show that October is the third best-performing month behind April and November, with an average return of 26%. And the fourth quarter is the best-performing quarter, with an average return of 80%.

Adding Bitcoin’s historical performance stats with the 26% climb to $65K, it is not surprising to see investors bullish. However, caution is something that traders need to exercise now as a potential correction could be brewing for BTC.
Based on the seven-month consolidation, local tops and bottoms have formed at the end of the third and first weeks. Out of the last eight local tops, four were formed in the third week and two in the first week. If history repeats, there is a high chance that BTC has already set up a short-term top, and a correction could be made next.
Supporting this correction is the sell signal flashed by Santiment’s 30-day MVRV Ratio (Market Value to Realized Value) indicator. This indicator is used to track the average profit/loss of investors who purchased BTC in the past month. A high positive value indicates unrealized profits and serves as a sell signal and vice versa.
In Bitcoin’s seven-month consolidation, local tops have formed when the 30-day MVRV ratio hit anywhere between 4% to 8%. As of October 1, the on-chain metric has retracted from 8% to nearly 4%.

Based on the technical data points, a correction here is highly likely. If there is a reversal, let’s explore where Bitcoin price could form a base.
Bitcoin Price Forecast Hints a Revisit of $61K
From a short-term perspective, BTC is likely to correct. However, this retracment is not entirely bearish as it would provide sidelined buyers a chance to accumulate. Furthermore, the correction wouldn’t negatively impact Bitcoin’s Mars-Vesta bullish thesis, which forecasts a six-digit all-time high for BTC in October 2025.
The daily Bitcoin chart shows two scenarios – a sweep of the sell-side liquidity below $62,350, leading to a continuation of the uptrend or a deep correction toward the $61,837 to $60,345 support zone.

Regardless of the short-term setback, Bitcoin price prediction hints that the long-term outlook remains bullish as it nears the end of its seven-month consolidation. With the US Federal Reserve anticipating soft-landing and the US presidential election coming to an end, Bitcoin price will likely experience a massive volatility in the fourth quarter of 2024 and a potential retest of the all-time high at $73,777.
Frequently Asked Questions (FAQs)
The rally was driven by the US Federal Reserve’s 50 basis point rate cut and China’s interest rate cut and stimulus package.
Bitcoin’s third-quarter performance stands at 0.89% after dropping 3.47% on September 30.
Historically, the fourth quarter is Bitcoin’s best-performing quarter, with an average return of 80%, and October is the third-best performing month, with an average return of 26%.
Akash Girimath
Akash Girimath, an engineer by training, has developed a deep fascination with the complexities of cryptocurrency markets. As a senior reporter and analyst, he specializes in crypto analysis and contributes his expertise to notable platforms such as AMBCrypto and FXStreet. In addition to his analytical work, Akash actively trades cryptocurrencies and manages a small crypto fund for friends and family. His role involves providing insightful market analysis and keeping readers informed about the latest trends in the crypto world. Follow Him on Youtube , X and LInkedIn
Disclaimer: The presented content may include the personal opinion of the author and is subject to market condition. Do your market research before investing in cryptocurrencies. The author or the publication does not hold any responsibility for your personal financial loss.
Binance Coin (BNB) and Cardano (ADA) Skyrocket as BTC Hits $65K; IntelMarkets’ (INTL) 100X Upside Potential Bitcoinist
Source link ]]>
Binance Coin (BNB) and Cardano (ADA) Skyrocket as BTC Hits $65K; IntelMarkets’ (INTL) 100X Upside Potential Drive Whale Interest Bitcoinist
Source link ]]>
The Bitcoin price has hit $65,000 for the first time since early August, thanks to several recent developments that provide a bullish outlook for the flagship crypto. These developments are also why there is the belief that this BTC rally can extend, with its price rising to $80,000 in Uptober, a term used to describe Bitcoin’s bullish nature in October.
Bitcoin Price Can Reach $80,000 In Uptober
Several factors support the Bitcoin price reaching $80,000 in October. One is the macro side, which has provided a major boost for the crypto market, with investors again allocating a significant amount of their capital to risk assets. These macro developments began with the US Fed rate cuts last week when the Federal Reserve cut interest rates by 50 basis points (bps).
This week, the People’s Bank of China (PBoC) also announced interest rate cuts and stimulus policies to improve the country’s economy. CoinGape reported that that move was bullish for BTC, noting that the Bitcoin price targets $100,000 following China’s stimulus package and its crypto trade with Russia.
Meanwhile, the latest US GDP data and jobless claims showed that the US economy is healthy, supporting the Fed’s move to cut interest rates by two more 25 bps this year. These world governments will continue adopting monetary easing policies to boost their economies.
In line with this, more liquidity will flow into the BTC ecosystem in October. A Coingape report states that this market liquidity will aid Bitcoin’s surge, which is one of the reasons why its price is likely to keep rallying in October.
From A Historical And Technical Perspective
From a historical and technical perspective, the Bitcoin price also looks poised to rally to $80,000. Coinglass data shows that October has been one of the most profitable months for BTC in the last eight years.
For context, the flagship crypto has only recorded monthly losses once in October over this period. Moreover, Bitcoin’s gains in October have been double digits. The only time the crypto recorded a single-digit gain was in 2022 when it closed the month with a 5% gain.

In his recent analysis, crypto analyst Jelle suggested that Bitcoin can reach $80,000 in October. The analyst noted that the market structure is now bullish, considering that BTC has breached the $65,000 resistance level. The analyst’s accompanying chart showed that $80,000 was the price target as the flagship crypto continues its uptrend.

Market Volatility Ahead Of October
A lot could still happen between now and Uptober, with the Bitcoin price gearing up for heavy market volatility. CoinGape reported that 89,027 Bitcoin options will expire today, with a notional value of $5.8 billion. The put-call ratio is $0.64, which suggests a bullish sentiment ahead.
The US Core PCE inflation data is also set to be released today by 1:30 p.m. UTC. This could also spark a lot of volatility for the BTC price. The current forecast is that the PCE price index rose by 0.2% in August.
For now, $65,000 remains the key level that Bitcoin bulls must defend if the BTC rally is to extend. Crypto analyst Ali Martinez revealed that 57.77% of Binance users with open positions are currently shorting BTC. This is also something to watch out for, although Bitcoin is currently on course to record its most profitable September ever, having surged by over 10% this month.

At the time of writing, the BTC price is at around $65,400, up over 2% in the last 24 hours. Trading volume is up over 57%, with $39 billion traded during this period.
Boluwatife Adeyemi
Boluwatife Adeyemi is a well-experienced crypto news writer and editor who has covered topics that cut across DeFi, NFTs, smart contracts, and blockchain interoperability, among others. Boluwatife has a knack for simplifying the most technical concepts and making it easy for crypto newbies to understand. Away from writing, He is an avid basketball lover and a part-time degen.
Disclaimer: The presented content may include the personal opinion of the author and is subject to market condition. Do your market research before investing in cryptocurrencies. The author or the publication does not hold any responsibility for your personal financial loss.
Dogecoin Rips, Bitcoin And Ethereum Surge Amid Strong ETF Inflows And Supportive Economic Data: King Crypto’s ‘New Uptrend’ Anticipated After Close Above $65K Benzinga
Source link ]]>
✓ Share: