Notice: Function _load_textdomain_just_in_time was called incorrectly. Translation loading for the updraftplus domain was triggered too early. This is usually an indicator for some code in the plugin or theme running too early. Translations should be loaded at the init action or later. Please see Debugging in WordPress for more information. (This message was added in version 6.7.0.) in /home/aonyeani76/cryptocurrencypanther/wp-includes/functions.php on line 6131
Notice: Function _load_textdomain_just_in_time was called incorrectly. Translation loading for the hustle domain was triggered too early. This is usually an indicator for some code in the plugin or theme running too early. Translations should be loaded at the init action or later. Please see Debugging in WordPress for more information. (This message was added in version 6.7.0.) in /home/aonyeani76/cryptocurrencypanther/wp-includes/functions.php on line 6131
Notice: Function _load_textdomain_just_in_time was called incorrectly. Translation loading for the wpforms-lite domain was triggered too early. This is usually an indicator for some code in the plugin or theme running too early. Translations should be loaded at the init action or later. Please see Debugging in WordPress for more information. (This message was added in version 6.7.0.) in /home/aonyeani76/cryptocurrencypanther/wp-includes/functions.php on line 6131 71K – Cryptocurrencypanther
https://cryptocurrencypanther.com
Latest Crypto NewsThu, 09 Apr 2026 12:34:27 +0000en-US
hourly
1 https://wordpress.org/?v=6.9.4https://cryptocurrencypanther.com/wp-content/uploads/2021/07/cropped-Cryptocurrency-e1626714913653-32x32.png71K – Cryptocurrencypanther
https://cryptocurrencypanther.com
3232Bitcoin Price Falls Below $71K as Iran Ceasefire Frays Within 48 Hours
https://cryptocurrencypanther.com/2026/04/09/bitcoin-price-falls-below-71k-as-iran-ceasefire-frays-within-48-hours/
https://cryptocurrencypanther.com/2026/04/09/bitcoin-price-falls-below-71k-as-iran-ceasefire-frays-within-48-hours/#respondThu, 09 Apr 2026 12:34:27 +0000https://cryptocurrencypanther.com/2026/04/09/bitcoin-price-falls-below-71k-as-iran-ceasefire-frays-within-48-hours/
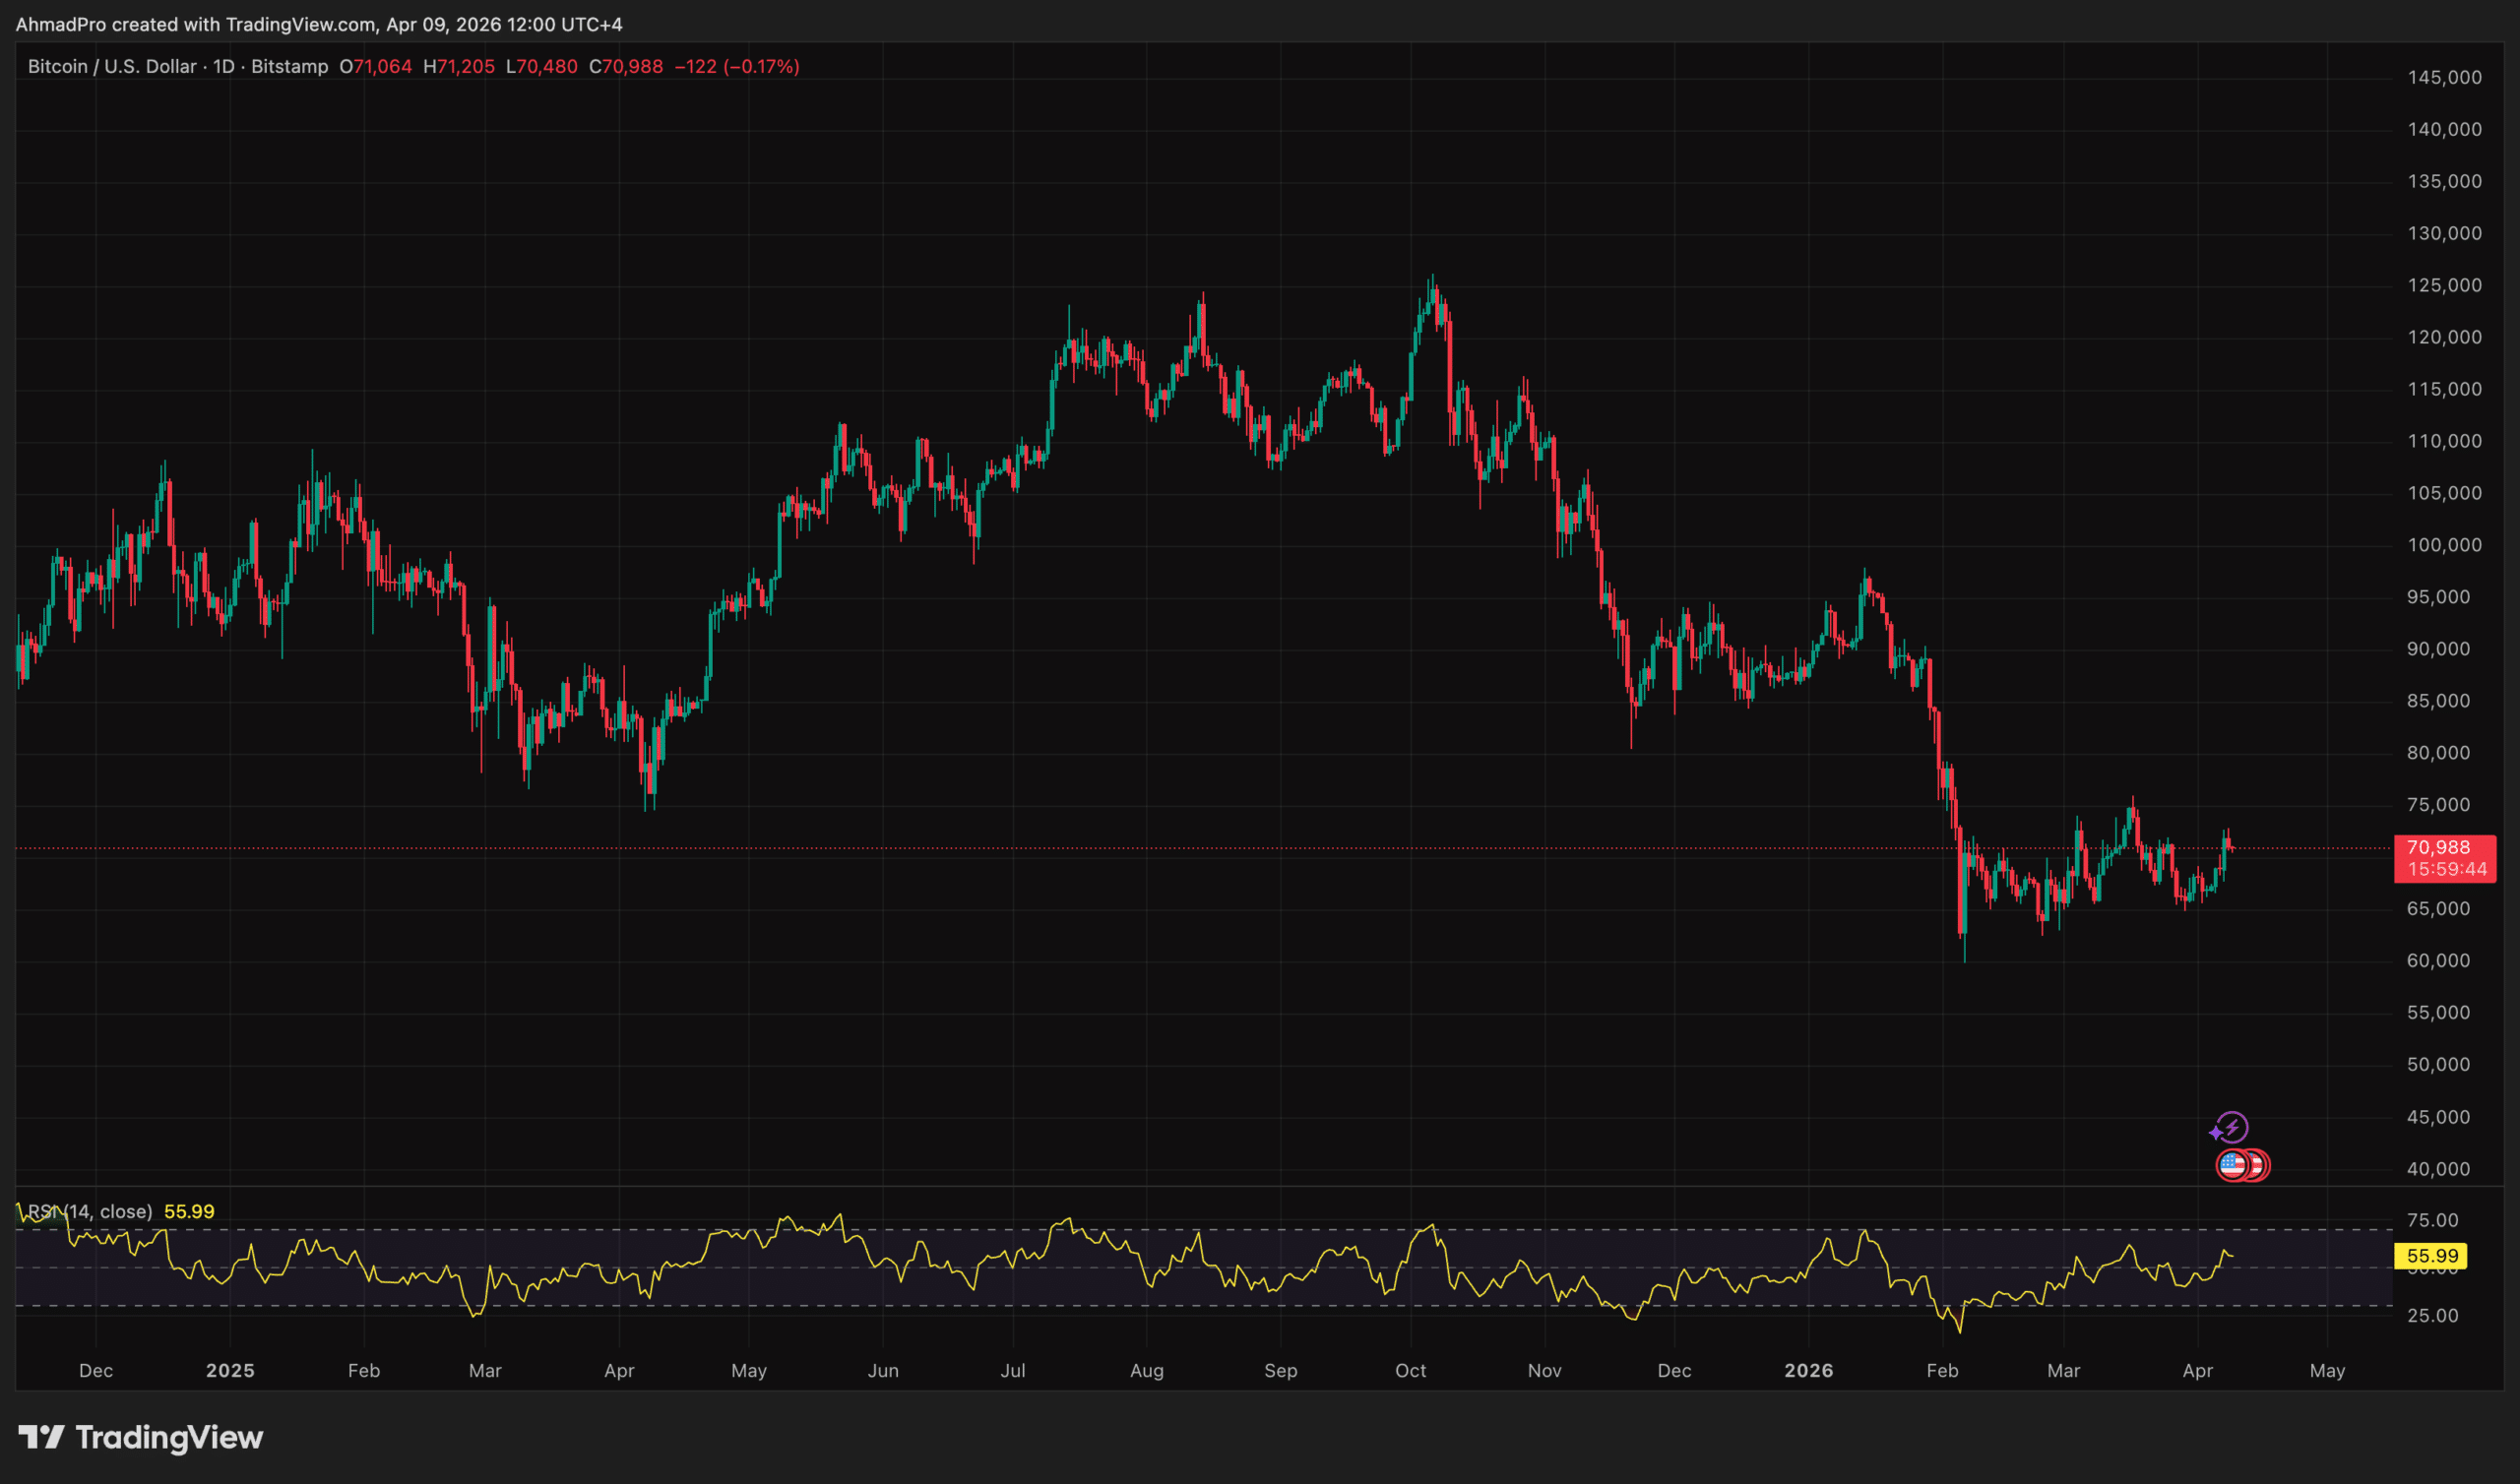
Bitcoin price is trading near $71,000, down 0.5% over the past 24 hours, as the two-week US-Iran ceasefire that drove Tuesday’s broad crypto rally began showing material signs of collapse less than 48 hours after it was announced.
The analytical question is no longer whether the relief trade can extend – it is how much of Tuesday’s gain unwinds if the ceasefire fails its first weekend stress test, and where the credible floor sits.
The Hormuz Re-Premium: How Ceasefire Doubt Transmits Into Crypto
The transmission mechanism here is direct. Iranian Parliament Speaker Mohammad Bagher Ghalibaf stated Thursday that three clauses of the ceasefire proposal had been contravened – without specifying which – while Israeli military operations continued in Lebanon and the Strait of Hormuz, nominally set to reopen under the deal, remained effectively closed with minimal tanker traffic.
— محمدباقر قالیباف | MB Ghalibaf (@mb_ghalibaf) April 8, 2026
That last point is the crux: the Hormuz reopening was the centerpiece of the agreement, and its failure to materialize means the energy risk premium the market briefly priced out on Tuesday is repricing back in.
Brent crude rebounded +2% to approximately $97 per barrel after Wednesday’s single-day collapse of more than 10% – its worst daily decline in six years. The reversal reflects a market that moved from pricing peace to pricing uncertainty within one trading session.
S&P 500 futures pointed to a 0.2% decline Thursday, signaling the end of a four-day winning streak for global equities. The MSCI Asia Pacific Index fell 0.9%, with two stocks declining for every one that rose, erasing a portion of Wednesday’s ceasefire-driven surge.
Treasuries were steady after an earlier rally faded on concern that higher oil prices would feed back into inflation expectations, which brings in the second transmission layer.
The Federal Reserve has continued to flag upside inflation risks alongside softening labor data, keeping the higher-for-longer rate narrative intact. Analysts at Bitunix characterized the combination as a dual shock from global energy repricing and Federal Reserve policy constraints, flagging that officials face a difficult balancing act between energy-driven inflation and weakening employment conditions.
Bitcoin Price: The $70,582 Floor and the $71,766 Resistance That Rejected Price
Bitcoin’s technical structure remains bounded by the $65,000–$73,000 range that has contained every significant move since late February, but the asset is now testing the upper half of that range rather than grinding along the bottom – which, under the circumstances, is the more constructive observation available.
The immediate concern is that BTC faced technical rejection at the 23.6% Fibonacci retracement at $71,766 and has since fallen below its 7-day moving average at $71,342, with futures open interest dropping 4.25% in a single session amid broader deleveraging.
Key support levels to watch: the 50% Fibonacci retracement at $70,582, the 61.8% level at $70,052, and the swing low at $68,338 – which represents the full round-trip scenario if the ceasefire formally unravels.
Bitcoin price hit an intraday peak of $76,013 earlier in the week before retreating; Thursday’s $70,981 print marks a 6.6% pullback from that high. The $65,000–$73,000 macro range is still intact, but the burden of proof has shifted back to the bull side.
Right now Bitcoin is trading straight off geopolitics, not pure technicals, because if the ceasefire actually holds and oil cools down, especially with Brent dropping under $90, that takes pressure off the macro side and gives BTC room to reclaim the short term trend above $71.3K and push back into the $73K to $74K zone.
But the market is clearly not fully buying that outcome yet, because the downside is still very real, and if tensions flare up again and oil spikes past $100, Bitcoin likely loses that $70K area and starts sliding toward the high $60s, with $65K back in play as a deeper floor.
So this is one of those moments where direction is not coming from charts alone, it is coming from headlines, and right now both paths are open, with the market actively pricing in the risk that things can turn negative just as quickly as they improve.
Disclaimer: Coinspeaker is committed to providing unbiased and transparent reporting. This article aims to deliver accurate and timely information but should not be taken as financial or investment advice. Since market conditions can change rapidly, we encourage you to verify information on your own and consult with a professional before making any decisions based on this content.
Daniel Frances is a technical writer and Web3 educator specializing in macroeconomics and DeFi mechanics. A crypto native since 2017, Daniel leverages his background in on-chain analytics to author evidence-based reports and deep-dive guides. He holds certifications from The Blockchain Council, and is dedicated to providing “information gain” that cuts through market hype to find real-world blockchain utility.
Source link
]]>https://cryptocurrencypanther.com/2026/04/08/dogecoin-shiba-inu-and-pepe-coin-price-prediction-as-btc-recovers-above-71k-coingape/feed/0Bitcoin back above $71K: is this rebound real or a bull trap?
https://cryptocurrencypanther.com/2026/03/25/bitcoin-back-above-71k-is-this-rebound-real-or-a-bull-trap/
https://cryptocurrencypanther.com/2026/03/25/bitcoin-back-above-71k-is-this-rebound-real-or-a-bull-trap/#respondWed, 25 Mar 2026 08:32:55 +0000https://cryptocurrencypanther.com/2026/03/25/bitcoin-back-above-71k-is-this-rebound-real-or-a-bull-trap/
Exchange outflows suggest long-term accumulation by investors.
Geopolitical signals and Bitcoin transfers shape near-term trends.
Bitcoin has bounced back above $71,000 after a week of mixed signals in the market.
The move comes as investors closely watch geopolitical developments, particularly efforts to ease tensions in the Middle East.
Notably, a peace proposal between the United States and Iran has sparked cautious optimism, lifting risk assets and sending Bitcoin higher.
Despite the rebound, sentiment remains cautious, with the Fear & Greed Index at 35, signalling that investors are still in the “Fear” zone.
This suggests that while the price has recovered, many market participants are hesitant to commit fully, waiting for clearer direction.
Exchange outflows signal an accumulation phase
Recent on-chain data shows that more bitcoins have been leaving crypto exchanges than entering them.
This trend is often interpreted as a sign of accumulation.
Investors appear to be moving coins into private wallets for long-term holding rather than selling immediately.
The persistent outflows indicate confidence in Bitcoin’s fundamentals and a willingness to weather short-term price swings.
This accumulation behaviour can help reduce selling pressure in the market.
When coins leave exchanges, fewer are available for immediate trading, which often supports the price even during periods of uncertainty.
Bhutan Government moves $37 BTC
Adding another layer to the market dynamic, the Royal Government of Bhutan recently moved roughly $37 million worth of Bitcoin from government-controlled wallets, according to Arkham Intelligence data.
Analysts see this as a structured transfer rather than a sudden liquidation, suggesting careful treasury management.
While the exact motives are not fully public, such large-scale movements highlight that governments and large holders can influence liquidity.
These actions can affect market psychology, especially when combined with broader investor accumulation trends.
Bitcoin price forecast for the coming days
Overall, the market is in a consolidation phase, seeking a catalyst to define the next sustained move.
Exchange outflows, government movements, and geopolitical developments are all factors that could influence the next direction.
The recent Bitcoin price movements suggest that it may have recently hit bottom around $67,500, even though the broader picture is still uncertain.
But whether the current recovery signals a true bottom or just a temporary rebound remains to be seen, although the combination of accumulation behaviour, controlled government movements, and cautious optimism on geopolitical developments has created an environment where Bitcoin can maintain support and potentially build momentum.
A daily close above $73,000 could signal strength and potentially push the price toward $75,000, according to analysts.
Conversely, a break below $70,000 might prompt a retest of $67,500 support, marking a critical line for short-term investors.
]]>https://cryptocurrencypanther.com/2026/03/25/bitcoin-back-above-71k-is-this-rebound-real-or-a-bull-trap/feed/0Bitcoin ‘Sandwiched’ Between Two Key Zones As Price Tops $71K
https://cryptocurrencypanther.com/2026/03/11/bitcoin-sandwiched-between-two-key-zones-as-price-tops-71k/
https://cryptocurrencypanther.com/2026/03/11/bitcoin-sandwiched-between-two-key-zones-as-price-tops-71k/#respondWed, 11 Mar 2026 10:27:56 +0000https://cryptocurrencypanther.com/2026/03/11/bitcoin-sandwiched-between-two-key-zones-as-price-tops-71k/
Bitcoin (BTC) is retesting resistance levels as its price recovers the $71,000 mark. However, an analyst has warned that the bear market is expected to continue and that the latest bounce could be short-lived.
Related Reading
Bitcoin Eyes Reclaim Of Former All-Time High Resistance
On Tuesday, Bitcoin surged 7.5% from the Sunday lows toward the $71,000 area, retesting this key level for the second time in a week before momentarily retracing toward the $69,000 level.
The cryptocurrency has been trading between the $63,000-$71,000 price range over the past month, briefly surging above the upper boundary during last week’s market bounce. However, BTC’s price has failed to hold its multiple breakout attempts amid the market volatility.
In a Monday analysis, market watcher Rekt Capital observed that Bitcoin is interacting with two key levels that form “an important overhead resistance”: the 2021 and 2024 all-time highs (ATHs) at $69,000 and $71,300, respectively.
As the analyst explained, these levels turned into resistance in the monthly timeframe after the flagship cryptocurrency closed February at $66,970. Since then, BTC has repeatedly tested these key levels from below in the daily timeframe but has failed to reclaim them.
Instead, it has produced upside wicks above $69,000 and $71,300, signaling that the former ATHs are acting as rejection levels in shorter timeframes and could become key resistance if it monthly closes below them.
BTC could turn its former ATHs into resistance. Source. Rekt Capital
“For Bitcoin to begin shifting this structure, price would need to Monthly Close above $69,000 by the end of March to position itself for a reclaim of the 2021 All Time High as support,” the analyst asserted.
“Similarly, the 2024 All Time High at $71,300 would likely require multiple Monthly Closes above the level in order to properly establish a reclaim process,” he added.
BTC Bounce To Be Short-Lived?
While the former ATHs risk turning into resistance, Rekt Capital noted that Bitcoin is currently finding crucial support at the 50-month Moving Average (MA), around the $64,000-$65,000 area.
Historically, the flagship crypto has initially reacted from this level in bear markets, but eventually loses it as support. The recent bounce from the 50-month MA is enabling BTC to test the 2021 and 2024 ATHs as resistance “for the time being.”
However, once the breakdown occurs, the level usually becomes a new resistance before further downside continuation follows. Now, “Bitcoin is effectively sandwiched between two key reactive zones,” he affirmed, which could lead to short-term relief before the mid-term downside continues.
Related Reading
The analyst also observed that BTC appears to be only halfway through the bear market, leaving the door open for further downside. In an X post, he noted that BTC’s shortest bear market lasted around 365 days, while it is currently just over 150 days into the current one.
Other analysts have suggested that the cryptocurrency could follow the 2022 cycle playbook. At the time, the price significantly retraced from the cycle peak, consolidated for months, and then had a final bull trap before its second major correction wave toward the market bottom.
As of this writing, Bitcoin trades at $71,307, a 3% increase in the daily timeframe.
BTC’s performance in the one-week chart. Source: BTCUSDT on TradingView
Featured Image from Unsplash.com, Chart from TradingView.com
Source link
]]>https://cryptocurrencypanther.com/2024/11/02/bitcoin-btc-stopped-at-71k-cardano-ada-jumps-6-daily-weekend-watch-cryptopotato/feed/0Will Dogecoin finally break THIS level after BTC’s surge to $71K? – AMBCrypto News
https://cryptocurrencypanther.com/2024/10/29/will-dogecoin-finally-break-this-level-after-btcs-surge-to-71k-ambcrypto-news/
https://cryptocurrencypanther.com/2024/10/29/will-dogecoin-finally-break-this-level-after-btcs-surge-to-71k-ambcrypto-news/#respondTue, 29 Oct 2024 17:03:47 +0000https://cryptocurrencypanther.com/2024/10/29/will-dogecoin-finally-break-this-level-after-btcs-surge-to-71k-ambcrypto-news/
Source link
]]>https://cryptocurrencypanther.com/2024/10/29/will-dogecoin-finally-break-this-level-after-btcs-surge-to-71k-ambcrypto-news/feed/0Bitcoin, Ethereum, Dogecoin Crack On Israel-Iran War Fears: Legendary Trader Flags Significance Of King Crypto's Close Above $71K – Benzinga
https://cryptocurrencypanther.com/2024/10/02/bitcoin-ethereum-dogecoin-crack-on-israel-iran-war-fears-legendary-trader-flags-significance-of-king-cryptos-close-above-71k-benzinga/
https://cryptocurrencypanther.com/2024/10/02/bitcoin-ethereum-dogecoin-crack-on-israel-iran-war-fears-legendary-trader-flags-significance-of-king-cryptos-close-above-71k-benzinga/#respondWed, 02 Oct 2024 02:02:51 +0000https://cryptocurrencypanther.com/2024/10/02/bitcoin-ethereum-dogecoin-crack-on-israel-iran-war-fears-legendary-trader-flags-significance-of-king-cryptos-close-above-71k-benzinga/
Source link
]]>https://cryptocurrencypanther.com/2024/10/02/bitcoin-ethereum-dogecoin-crack-on-israel-iran-war-fears-legendary-trader-flags-significance-of-king-cryptos-close-above-71k-benzinga/feed/0Top Analyst Expects Surge To $71K, Slashes Mt. Gox Selloff Concerns
https://cryptocurrencypanther.com/2024/05/28/top-analyst-expects-surge-to-71k-slashes-mt-gox-selloff-concerns/
https://cryptocurrencypanther.com/2024/05/28/top-analyst-expects-surge-to-71k-slashes-mt-gox-selloff-concerns/#respondTue, 28 May 2024 09:37:58 +0000https://cryptocurrencypanther.com/2024/05/28/top-analyst-expects-surge-to-71k-slashes-mt-gox-selloff-concerns/
The Bitcoin (BTC) price is grappling with a downtrend lately. In a recent update, Capo of Crypto, a well-known crypto analyst, shared insights on Bitcoin’s current market situation on X. Moreover, the analyst expects a surge to $71,000 despite the bearish speculations around Mt. Gox’s potential BTC selloff.
Will BTC Rally To $71,000?
According to Capo, the primary support zone for Bitcoin is at $67,000. He noted, “Demand is being added here, so this level should hold and bullish continuation is expected (main scenario).” However, if this support fails, the next level to watch is $65,000.
Source: Capo of Crypto | X
Moreover, in a chart attached to the post, Capo also projected a potential surge to $71,000 if the $67,000 support holds, breaking the $69,000 resistance. In addition, the analyst also addressed concerns surrounding the recent movements of Bitcoin linked to the defunct exchange Mt. Gox.
Additionally, he clarified that the transfers, which totaled approximately 43,000 BTC worth about $3 billion, were for repayment preparation and not for immediate user repayments. “Although there have been confirmations and some progress, the full repayment process extends until October 2024. So nothing to worry about (yet),” he explained.
Whilst, Arkham Intelligence data revealed that the above-mentioned Bitcoin reserve was moved in three transactions of 12.24k BTC, 14.05k BTC, and 16.589k BTC within a short timeframe. Despite the significant transfer, Capo’s analysis suggests that the market should not be overly concerned.
His perspective aligns with Michaël van de Poppe, another prominent analyst, who commented on the recent market reaction. “No breakout happening for #Bitcoin as $70K was rejected. I’d like $66K to be holding up as support, and then everything is fine,” van de Poppe stated. However, he described the current market environment as “quite boring.”
Adding to the analysis, Ali Martinez highlighted a potential short-term rebound. He noted that the TD Sequential indicator presented a buy signal on Bitcoin’s hourly chart. Hence, the analyst is “anticipating a one to four candlesticks rebound for BTC!”
Moreover, this optimistic outlook is bolstered by the launch of Bitcoin Exchange-Traded Products (ETPs) on the London Stock Exchange. These investment products could inject fresh interest and liquidity into the market.
As of writing, the Bitcoin price was down 0.65% to $68,032.57 on Tuesday, May 28. On the contrary, the 24-hour trading volume for BTC spiked 61.70% to $30.30 billion. Whilst, the oldest crypto held a massive market capitalization of $1.34 trillion.
Whilst, the long and short liquidations for BTC remained at par, signalling a sideways movement. However, the long liquidations were a step toward with $21.60 million liquidated, according to Coinglass. Hence, the Bitcoin price is expected to be in the red for the time being.
CoinGape comprises an experienced team of native content writers and editors working round the clock to cover news globally and present news as a fact rather than an opinion. CoinGape writers and reporters contributed to this article.
The presented content may include the personal opinion of the author and is subject to market condition. Do your market research before investing in cryptocurrencies. The author or the publication does not hold any responsibility for your personal financial loss.


✓ Share: