Crypto analyst Bobby revealed that the XRP price has completed a consolidation pattern, hinting at a potential parabolic rally for the altcoin soon. The analyst suggested that XRP’s price could rally to double digits once this rally occurs.
XRP Price Eyes Rally To $19 As It Completes Double-Bottom Pattern
In an X post, Bobby indicated that the XRP price has completed the macro double-bottom pattern, which it had spent over seven years building. The analyst’s accompanying chart showed that the altcoin is now gearing up for a rally to as high as $19 following the completion of this consolidation pattern.
Related Reading
Meanwhile, the analyst noted that the XRP price spent over nine months building support near the neckline of the massive W pattern. He added that the altcoin spent the same amount of time consolidating below the 1.618 Fibonacci extension of its latest macro swing high to swing low.

Bobby indicated that the XRP price rally will begin once it breaks through $3.02 and gains monthly acceptance above that level. He expects this move to take XRP into the take-profit levels he has highlighted on several occasions. These levels include $4.7, $6.4, $7.4, and possibly $19, all of which mark new all-time highs (ATHs) for the altcoin.
The analyst also predicts that the XRP ETFs could spark a rally to between $8 and $13 with possible wicks into the $20 range. These funds are expected to launch this month, depending on when the U.S. government shutdown ends. They provided a bullish outlook for XRP due to the amount of inflows that they could drive into the altcoin’s ecosystem. Meanwhile, it is worth mentioning that Bobby had also earlier alluded to previous cycles as the reason XRP could rally to $13.
Analyst Sounds Warning To Bulls
Crypto analyst Egrag Crypto has warned XRP bulls that the XRP price needs to close above $3.13 to $3.20 on the 3-day chart to sustain the current bullish momentum. His warning followed XRP’s reclaim of the psychological $3 level, which he noted has wrecked the bears. However, the altcoin needs to close above this range, or the bulls are also in danger of getting wrecked.
Related Reading
Egrag Crypto stated that the XRP price could follow suit if Bitcoin and Ethereum get rejected on their current rallies. He added that the altcoin could head lower, which he believes might actually be better. He assured that the last impulsive move would be explosive and could lead to life-changing gains for the bulls. However, for now, he believes that XRP is simply ranging until it closes above $3.20.
At the time of writing, the XRP price is trading at around $3, up in the last 24 hours, according to data from CoinMarketCap.
Featured image from Adobe Stock, chart from Tradingview.com
Bitrue’s Ongoing Partnership with Cardano: A 7-Year Milestone CoinCentral
Source link ]]>
The XRP price has broken out of a 7-year Double Bottom pattern, signaling what analysts predict could be the start of a major long-term rally. According to reports, a breakout and successful retest of this long-standing chart pattern could set the stage for a massive surge toward $36, ultimately repeating the bull rally seen during the 2014-2017 cycle.
XRP Price Eyes $36 After Double Bottom Breakout
Crypto analyst Gert van Lagen has drawn attention to a rare and potentially explosive technical event currently unfolding on the two-week XRP price chart. According to his analysis posted on X social media, XRP has successfully broken out of a massive 7-year Double Bottom formation—a pattern that typically signals long-term reversal from bearish to bullish market conditions.
Related Reading
Based on the analyst’s chart, XRP had breached the neckline of this Double Bottom pattern after years of accumulation, following up its momentum with a textbook retest that confirmed the breakout. This retest, occurring at a critical price point, has historically acted as the final validation before a sustained rally. Lagen has also compared the current cycle with that of the 2014-2017 phase, indicating that XRP’s price action could be repeating similar strong bullish patterns that emerged during that period.
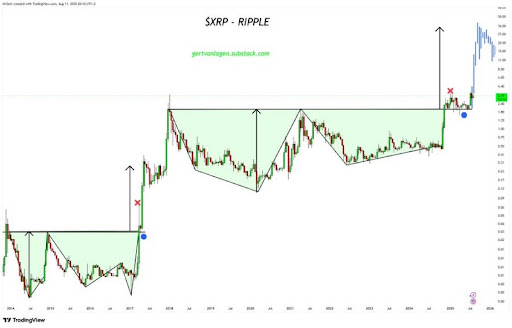
The chart suggests that XRP is poised to clear its former all-time high of $3.84, potentially removing one of the most significant technical barriers in its history. With the resistance level now flipped into support, Lagen’s price projection points to an initial target of approximately $36. This level aligns with the 2.00 Fibonacci Extension of the Double Bottom pattern.
Notably, the expert’s analysis implies that XRP’s current momentum is not just a short-term spike, but likely the early stages of a multi-month, possibly multi-year climb. If the structure follows past patterns and continues to play out as Lagen predicts, XRP could be on track to deliver one of its strongest bull runs since the 2017 rally.
XRP Mirrors Ethereum’s 2017 Breakout Pattern
In a separate bullish analysis, a crypto analyst identified as ‘Shibo’ on X compared XRP’s present market behavior to Ethereum’s historic breakout in 2017. His side-by-side chart shows an almost identical technical progression involving an extended consolidation phase forming a base, followed by a decisive breakout at a clearly defined resistance level.
Related Reading
In Ethereum’s case, this move triggered an extraordinary rally from sub-$20 levels to more than $1,400 in under twelve months, marking one of the most explosive advances in crypto history. Shibo argues that XRP is now positioned in the same “breakout zone” that the ETH price occupied before its parabolic surge.
Based on this chart historical pattern, the analyst has forecasted a rather ambitious price target for XRP. He believes that the cryptocurrency could see a massive surge to $589, representing an eye-watering increase of 18,084%.
Featured image from Getty Images, chart from Tradingview.com
Reason to trust
![]()
Strict editorial policy that focuses on accuracy, relevance, and impartiality
Created by industry experts and meticulously reviewed
The highest standards in reporting and publishing
Strict editorial policy that focuses on accuracy, relevance, and impartiality
Morbi pretium leo et nisl aliquam mollis. Quisque arcu lorem, ultricies quis pellentesque nec, ullamcorper eu odio.
Ethereum has been one of the top-performing crypto assets since early April, rallying more than 100% from its cycle lows near $1,600 to a recent high above $2,700. This sharp recovery positioned ETH as a leader in the broader market’s bullish trend, even sparking renewed discussions around a potential altseason.
Related Reading
However, momentum now appears to be fading. Over the past week, ETH has struggled to break above key resistance levels, and selling pressure is beginning to mount as global macroeconomic conditions grow increasingly uncertain.
Despite these headwinds, one key on-chain signal suggests long-term confidence remains strong: data from Glassnode reveals that Ethereum’s supply on centralized exchanges has dropped to its lowest level in seven years. This trend, typically interpreted as a sign of reduced selling pressure, indicates that investors may be increasingly moving ETH to self-custody wallets, possibly in anticipation of further upside. As ETH flirts with critical support levels, this deep reduction in exchange supply could act as a stabilizing force, reinforcing the asset’s long-term bullish case amid short-term uncertainty.
Ethereum Faces Key Breakout Test As Supply On Exchanges Plunges
Ethereum is currently trading at a critical juncture, consolidating around the $2,500 mark after a strong rally that began in early April. Many investors believe this consolidation phase could be the calm before a breakout, potentially pushing ETH into new highs and setting the stage for a broader altseason. The recent pullback has been orderly so far, with price action respecting major support zones, and market participants remain cautiously optimistic.
Despite persistent global tensions—including rising US Treasury yields and continued trade uncertainty between the US and China—Ethereum’s fundamentals appear to be strengthening. One of the most bullish signals comes from top analyst Quinten Francois, who highlighted on-chain data showing that Ethereum’s supply on centralized exchanges has now fallen to its lowest level in seven years. This development is critical because it signals a deep reduction in potential sell-side pressure.

When fewer coins are available on exchanges, it typically indicates that investors are moving their holdings to long-term cold storage rather than preparing to sell. In the past, such shifts have often preceded major price surges. If demand increases while supply remains limited, the market could face a supply shock, fueling a rapid move to the upside.
This setup has led analysts and traders to watch Ethereum closely, as it continues to form a base just below key resistance around $2,700. A confirmed breakout above this level, paired with the shrinking supply on exchanges, could trigger aggressive buying and potentially kick off a new phase of bullish momentum. With confidence building and long-term fundamentals improving, Ethereum’s current consolidation might just be the final pause before a major leg higher.
Related Reading
ETH Holds Crucial Support Amid Market Pullback
Ethereum (ETH) is currently trading around $2,484, showing signs of consolidation after several attempts to break through the $2,700 resistance zone. On the 4-hour chart, price action reveals a gradual decline from recent highs, with lower highs forming and ETH slipping below the 34 EMA ($2,557). This breakdown below the short-term moving averages suggests weakening momentum, while the price now hovers just above the 100 SMA ($2,559), a level that has acted as dynamic support in previous retracements.

Volume has also decreased slightly during this pullback, indicating that the recent selling may lack strong conviction. However, if ETH fails to reclaim $2,550 in the next few sessions, bearish momentum could accelerate toward the 200 SMA at approximately $2,358.
Related Reading
On the bullish side, this consolidation above $2,450 continues to show resilience, especially given the macroeconomic backdrop and market-wide volatility. If Ethereum can hold this range and reclaim the 34 EMA with strong volume, it could stage a rebound and retest the $2,650–$2,700 zone, a critical level for a breakout.
Featured image from Dall-E, chart from TradingView
Morgan Stanley Expert With 7-Year Win Streak Pegs Shiba Inu Price For $0.005, But This AI Altcoin Will Rally 40,000% To $6 First The Cryptonomist
Source link ]]>
Cardano Celebrates 7-Year Anniversary as ADA Looks to Continue 16% Surge Watcher Guru
Source link ]]>
The XRP price has been in a 7-year accumulation zone now and its failure to break out of this zone has been a constant worry for investors. However, it seems that the days of worry will soon be forgotten as one crypto analyst believes that the XRP price is about to break out of this accumulation zone.
XRP Price To Break Out And Complete 1,200% Rally
In an analysis posted on TradingView, crypto analyst Babenski has renewed XRP investors’ hope in the coin, predicting that it is about to break out of its drawn-out accumulation trend. According to the analyst, the altcoin is currently trying to break out of this accumulation, and could be successful this time around.
Related Reading
The 7-year accumulation had began back in 2017 when the XRP Price had gone through a notable bull run. Naturally, this accumulation was expected to break in the next bull market which was in 2021. However, due to the United States Securities and Exchange Commission (SEC) suing Ripple in 2020, it put a damper on the price, causing the XRP price to crash while others rallied.
Since then, the altcoin has maintained its position inside the accumulation range, failing to break above $1 even after securing a partial victory over the regulator in 2023. This accumulation has now carried into 2024, but with a bull run expected this year, it could be time for XRP to shine.
Babenski’s chart shows what could happen if the XRP Price were to break out of this accumulation. The crypto analyst sees a significant rally in the price, rising more than 1,200% to touch the $6. If this happens, the XRP Price would be securing a brand new all-time high.
Other Analysts See The Same Trend
Babenski is not the only crypto analyst who has predicted that the XRP price could be breaking out of its 7-year accumulation in 2024. Crypto analyst U-Copy has also pointed this out, taking to X (formerly Twitter), to share the analysis.
Related Reading
According to him, the XRP price is already close to the end of its triangle formation, which began in 2027. He revealed that the final gap was actually filled back at the $0.46 level, and with the price trading above $0.5 at the time of writing, a breakout could be imminent.
Unlike Babenski, crypto analyst U-Copy did not give a price target for where they expect the XRP price to end up. However, the analyst does believe that something is bound to happen by December 2024. “Don’t know target price but Shit could blow up big in this Bull Cycle up to December,” U-Copy stated.
Featured image created with Dall.E, chart from Tradingview.com
After a crucial week for Ethereum, a technical candlestick arrangement shows that ETH prices could prepare for a sharp upturn in the coming weeks and months.
Pointing out events in the monthly chart, one analyst notes that the ETH/BTC ratio reverses from a multi-year support trend line. Usually, the analyst continued, when prices bounce from this line, altcoin prices tend to react, trending higher.
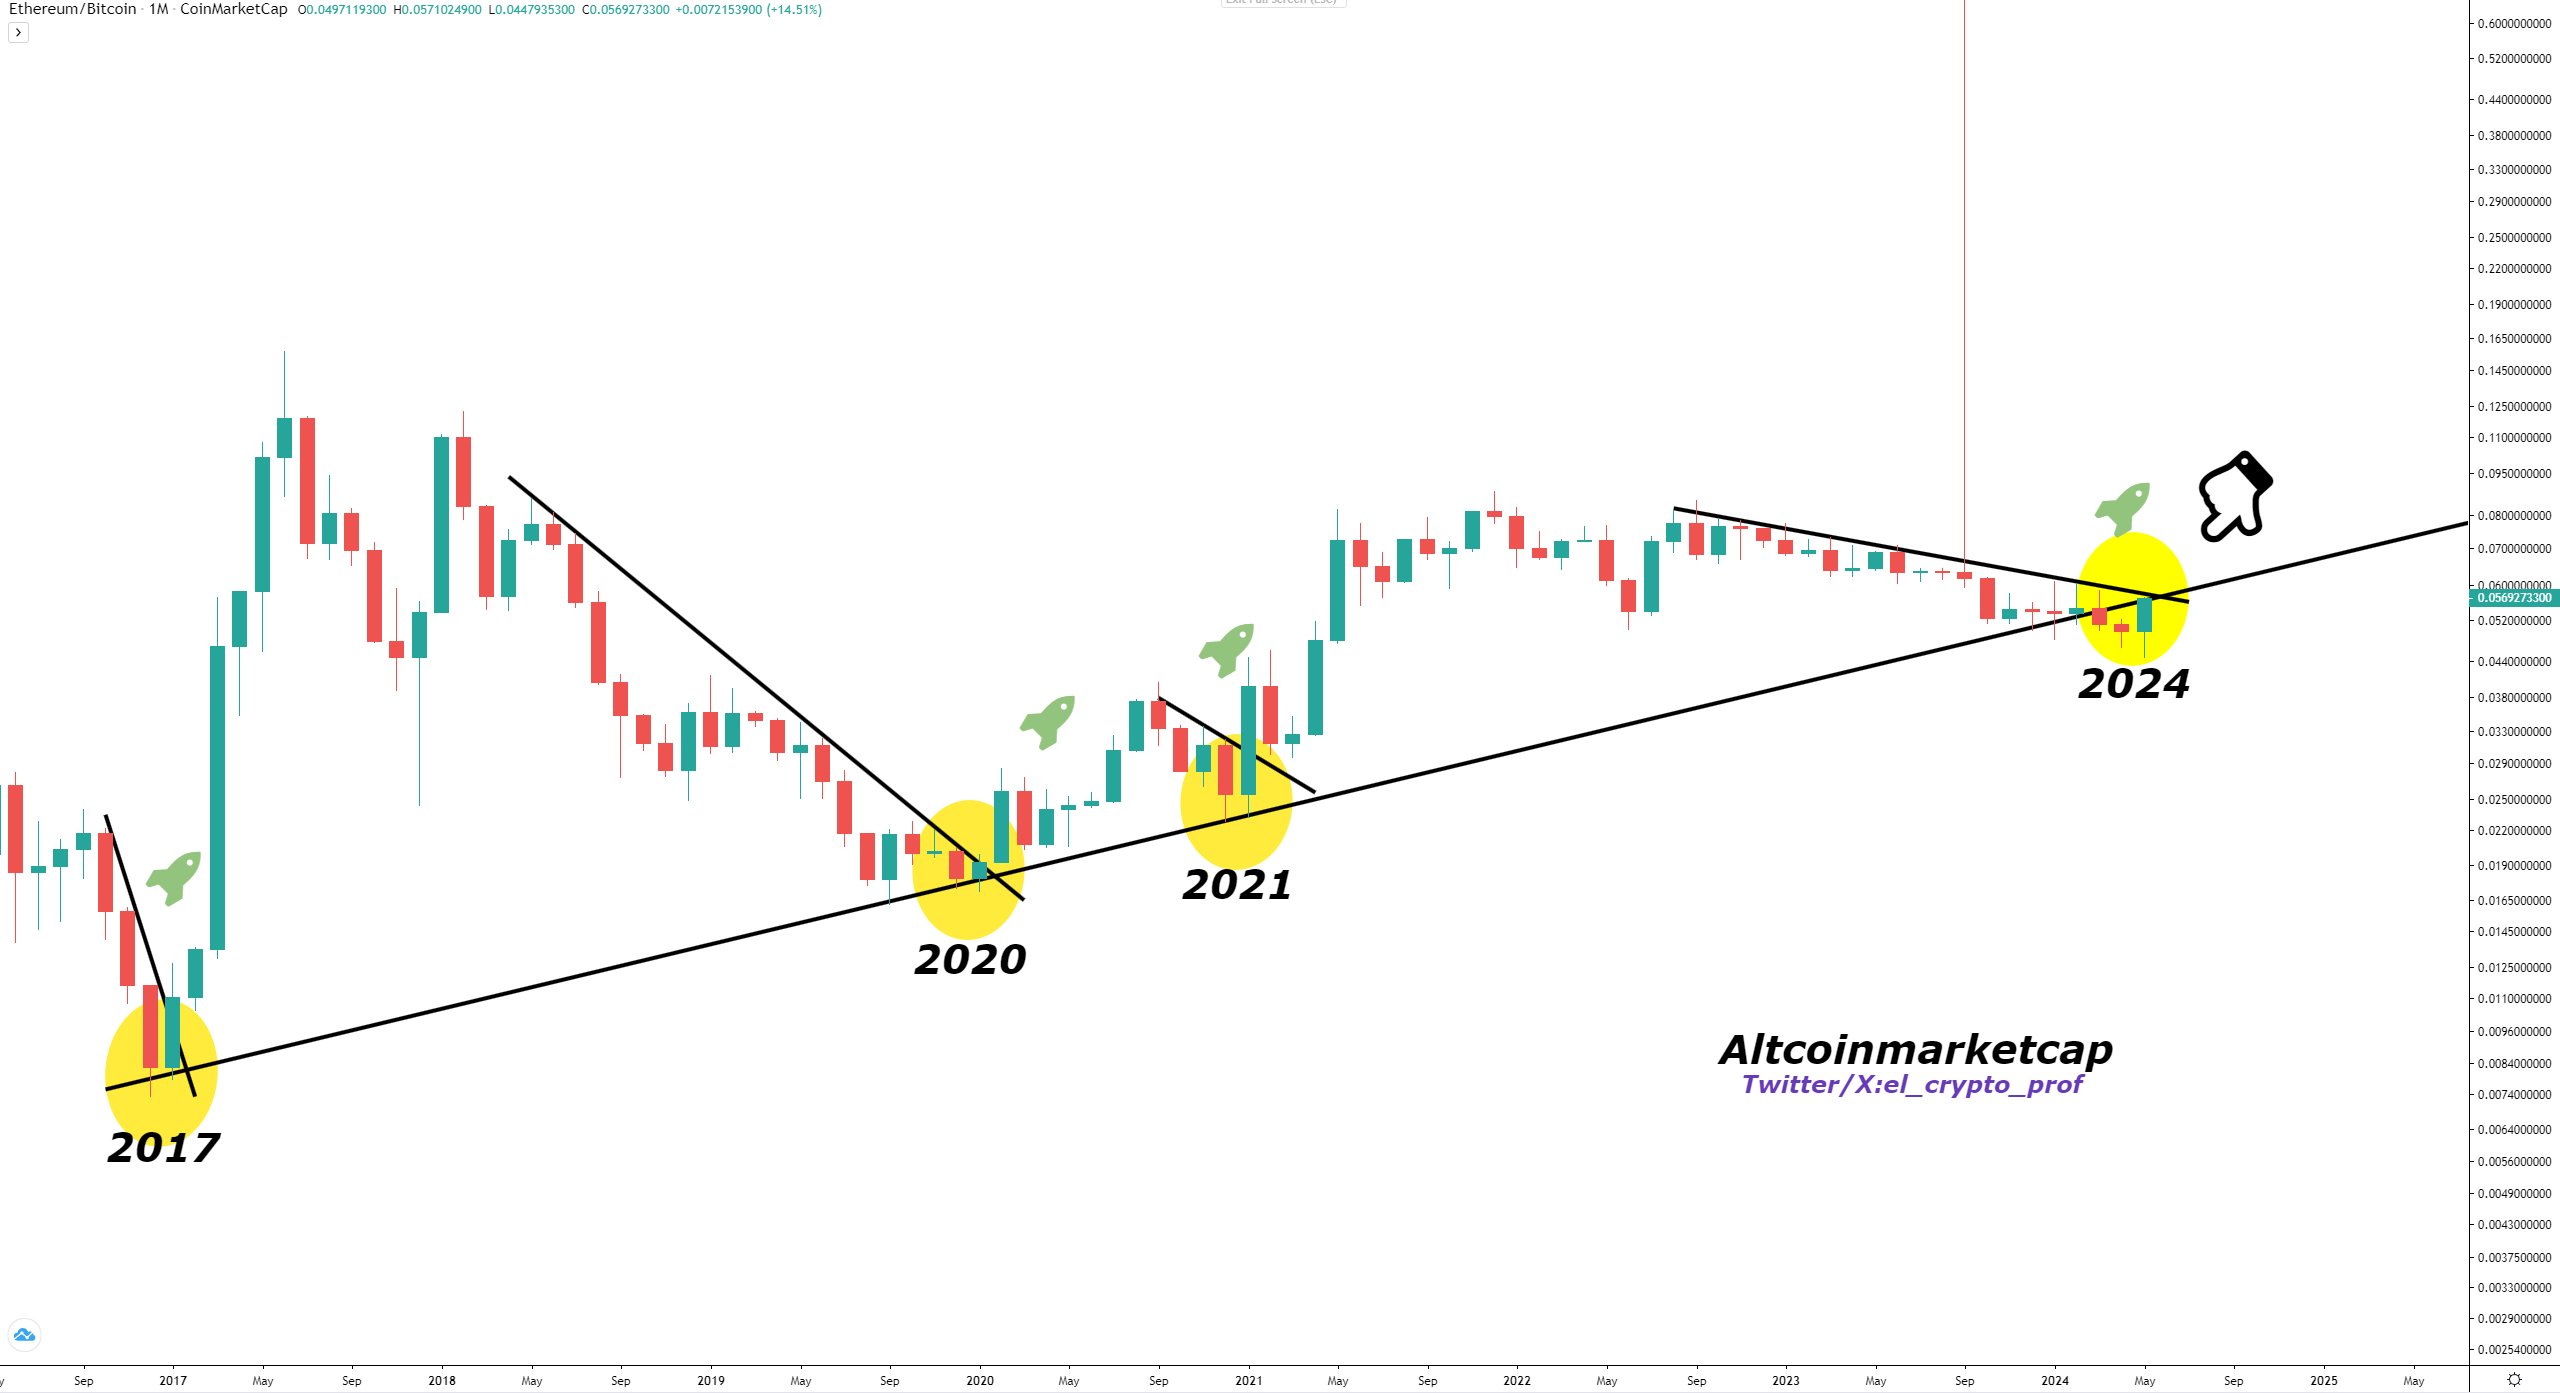
ETH/BTC Rising From Crucial Support Trend Line
The ETH/BTC is a ratio closely monitored by technical analysts. It compares the performance of the world’s first and second most valuable coins.
Although Bitcoin has been firm for the better part of the last two years, the monthly chart clearly shows a descending channel, indicating an upward trend.
So far, there have been a series of higher lows. This suggests that bulls have been soaking in selling pressure over the years, keeping prices higher.
Related Reading
Looking at the monthly chart, this month’s bar will close firmly as bullish. This will result in a double-bar bullish reversal pattern that may ignite demand.
This will subsequently help pump ETH prices even higher. Even so, the relatively lower trading volume, lower than those seen in July 2022, suggests that participation is not at historically high levels.
A bullish bar in June confirming this month’s gain could be the base of another leg up. If this happens, it will mirror those of January 2021. Another 40% gain versus Bitcoin could see ETH close above 0.08 BTC, propelling the coin closely toward 2017 highs.
Overall, Bitcoin has been firm. From September 2022, BTC has been outperforming ETH, erasing gains from 2020 and 2021. The result was a descending channel, though this phase of lower lows also had relatively low participation levels.
Technically, based on a volume analysis, this is bullish for ETH. Even so, a close above 0.08 BTC would be a strong testament from the bulls. It could potentially set a foundation to cement ETH, further narrowing BTC’s dominance.
Spot Ethereum ETFs To Drive Demand: Path To $4,900?
Over the years since launching and the final approval of spot Bitcoin exchange-traded funds (ETFs) in January, the digital asset was the only one recognized by the United States Securities and Exchange Commission (SEC).
Because of this advantage, the approval of the derivative product has seen BTC become an institution’s go-to asset. Wall Street players like Fidelity and BlackRock have been enabling exposure to BTC via spot ETFs over the past four months, resulting in billions being poured into the asset.
Related Reading
However, this changed last week when the United States SEC approved listing all spot Ethereum ETFs. ETH staking was removed from amended 19b-4 files.
Still, the fact that Ethereum is almost being clarified represents a massive boost for the network and the platform. ETH prices shot by as much as 30% in response, outperforming Bitcoin.
It is highly likely that ETH prices will continue rising in the coming weeks. Though it remains to be seen how the reception will be, especially among investors, the coin, like BTC prices post mid-January 2024, will rally, perhaps breaking $4,100 and even all-time highs of 2021.
Feature image from iStock, chart from TradingView
Dogecoin Finds A Bottom: How The 7-Year Cycle Can Send Price To $40 NewsBTC
Source link ]]>
Bitcoin price is now above $40,000, up more than 20% from the lows set in late January. Despite the recovery, common sentiment across the crypto community, analysts, and more is that the bottom is nowhere near in.
Meanwhile, BTCUSD has began its recent bounce from a seven year secular bull trend line. Could that fact combined how few are expecting a bottom be the best case for why one might already be in?
Contrarian Take: Crypto Market Sentiment Would Be Blind To A Bottom
In a flash, Bitcoin has risen back above $40,000 – still a far cry below the $100,000 end of year 2021 targets the crypto community, analysts, mathematical models, and more had been projecting.
The current collective expectation from that very same crowd is that the current rally is nothing more than a “bull trap” and a revisit to $30,000 and even lower is all but guaranteed.
Related Reading | Bitcoin Death Cross 2022: What You Need To Know About The Deadly Signal
Often when the consensus expects one direction, the market moves in a contrarian manner. With market participants sold on the idea that a downtrend will continue, the current bounce could end up leaving many behind.
Especially when the bounce itself began at a seven year secular bull trend line – and a trend line that put in two bear market bottoms.

A look at the seven year secular bull trend line | Source: BTCUSD on TradingView.com
The Bitcoin Trend Line That Just Won’t Stay Broken
The chart above shows what the nearly decade-long trend line looks like. The trend line first began at the 2014-2015 bear market bottom, and was lost only temporarily during that time period. After grinding along it for almost two entire years, Bitcoin price went parabolic and rose from around $2,500 to $20,000 in a matter of months.
The top cryptocurrency by market cap spent the entire bear market above the trend line, only touching back down on it in December 2018 to put in the most recent bear market bottom. Much like the 2014-2015 bear market, the line was briefly lost again during the current cycle during the Black Thursday market collapse.
Reclaiming the trend line is what caused fireworks in late 2020 and early 2021, and Bitcoin has been ranging since. Only now after an unexpected downtrend back to low $30,000s has the cryptocurrency touched the trend line in question since late 2020.
Related Reading | 2022: The Year The Secular Bitcoin Bull Run Could End
A bounce is beginning, but very few expect this to be the bottom. But why not? Bitcoin has bottomed more times at this trend line than any other. Back in December 2018, the common theory was that the downtrend would continue and few expected the bottom to be put in when it was.
In hindsight, that was indeed the bottom of the last bear market. Could this bottom be another example of one that’s only realized long in hindsight?
Follow @TonySpilotroBTC on Twitter or join the TonyTradesBTC Telegram for exclusive daily market insights and technical analysis education. Please note: Content is educational and should not be considered investment advice.
Featured image from iStockPhoto, Charts from TradingView.com