Crypto analyst Luke has drawn attention to an XRP bull flag breakout, which could send the price to $11, which would mark a new all-time high (ATH) for the altcoin. This comes as the altcoin faces further downside amid the U.S.-Iran war, which threatens to drag on for a long time.
XRP Eyes Rally To $11 Amid Bull Flag Breakout
In an X post, Luke stated that a bull flag breakout is forming on the XRP weekly chart, with the target being $11. The analyst noted that this is a textbook bull flag after the 8-month consolidation. A pole height measured move points to a rally to exactly $11 while the altcoin could reach $11.20 based on the 1.618 Fib extension.
Related Reading
An XRP rally to $11 from the current price represents an upside of almost 700%. Luke indicated that such a rally is possible, with institutions also accumulating, a development that shows a “parabolic leg” is incoming. However, it is worth noting that the XRP ETFs have seen daily net outflows in the last two days as tensions between the U.S. and Iran intensify.

SoSoValue data shows that the funds recorded outflows of $6.15 million and $16.62 million on March 5 and 6, respectively. As a result, the net assets of these XRP ETFs have dropped below $1 billion. The altcoin, alongside the broader crypto market, is currently facing downside pressure, with the U.S.-Iran tensions pushing oil prices to multi-year highs.
Crypto analyst CasiTrades predicted that XRP could drop to as low as $0.87, as it remains below the $1.67 resistance level. Crypto analyst Egrag Crypto also stated that XRP could drop to as low as $0.85 after facing rejection at the $1.55 level.
Insight Into the Current Price Action
In an X post, crypto analyst JB stated that all previous wicks, including the one on October 10, have been filled down into the demand zone. The analyst opined that there isn’t much additional downside fuel left if XRP is still in a higher timeframe (HTF) bullish environment. JB also mentioned that the first attempt to reclaim $1.61 failed, so a retest of the $1.25 and $1 level are now back on the table.
Related Reading
For an invalidation of this bearish structure, XRP needs to reclaim $1.61 and break the diagonal resistance. JB noted that this would significantly increase the odds of resuming the broader uptrend after about 15 months of correction. “The current area offers one of the strongest R:R setups for HTF spot longs, with invalidation below the gray demand zone,” the analyst added.
At the time of writing, the XRP price is trading at around $1.36, down over 2% in the last 24 hours, according to data from CoinMarketCap.
Featured image from Freepik, chart from Tradingview.com
Dogecoin Price Climbs as Shiba Inu Spikes to 8-Month High Decrypt
Source link ]]>
Ethereum (ETH) is gearing up for an explosive bullish phase after decisively breaking above the crucial $3,000 mark. This milestone has fueled optimism among traders and investors, signaling a potential surge to new all-time highs. ETH’s recent price action demonstrates strong momentum, suggesting that the second-largest cryptocurrency by market cap is ready to reclaim its place in the spotlight.
Renowned analyst and investor Carl Runefelt has bolstered this bullish outlook with a compelling technical analysis. Sharing his insights, Runefelt pointed out Ethereum’s impressive recovery and growing strength. He emphasized that if current momentum continues, the $6,000 milestone could be within reach sooner than many expect.
Related Reading
According to Runefelt, Ethereum’s upward trajectory is supported by increasing network activity, heightened institutional interest, and broader adoption of its smart contract capabilities.
The crypto market’s recent surge, led by Bitcoin’s new all-time highs, has created an environment ripe for Ethereum to follow suit. As traders focus on ETH’s potential to outperform other altcoins, all eyes are on whether it can sustain its breakout and push higher. The coming weeks will be crucial as Ethereum solidifies its position above $3,000, potentially paving the way for a rally that could redefine expectations for this cycle.
Ethereum Testing Supply
Ethereum is on the brink of a significant breakout as it approaches the last major supply levels before potentially embarking on a Bitcoin-like rally. After reclaiming its local highs with strong momentum, Ethereum has captured the attention of traders and investors looking for the next big move in the crypto market. Many believe the current consolidation phase is just the calm before a bullish storm.
Runefelt recently shared a detailed technical analysis on X, highlighting Ethereum’s readiness for a massive bull run. Runefelt emphasized that ETH is mirroring Bitcoin’s recent explosive breakout, suggesting that Ethereum could be next to surge.

According to his analysis, this may be the last opportunity to buy ETH at relatively low prices before the market takes off. Runefelt set an ambitious price target of $6,000, forecasting this level as attainable once Ethereum breaks through its final supply zones.
Related Reading
Ethereum’s potential rally is supported by a combination of technical strength and increasing demand for its smart contract platform. With Bitcoin setting new all-time highs, the market’s focus is gradually shifting toward altcoins, particularly Ethereum. If ETH breaks above its current resistance, it could ignite a wave of buying pressure that sends prices soaring to unprecedented levels.
ETH Testing Technical Levels
Ethereum is currently trading at $3,110, following a 12% retrace from its recent local highs. Despite the pullback, ETH continues to show resilience, holding firmly above the 200-day moving average (MA) at $2,955. This key demand level is a strong indicator of long-term market strength and suggests that Ethereum remains in bullish territory despite short-term volatility.

The 200-day MA serves as a critical support zone, and its defense could pave the way for a significant rally in the coming days. If ETH maintains its position above this level for an extended period, it would signal renewed bullish momentum and set the stage for a breakout to higher supply zones.
Related Reading
The next major resistance level for Ethereum is at $3,450. A successful breach and consolidation above this price point would confirm a breakout, positioning ETH to challenge its all-time high (ATH). Such a move could reignite bullish sentiment and attract new buying pressure from investors anticipating further gains.
Featured image from Dall-E, chart from TradingView
Analyst Predicts Shiba Inu Price to End 8-Month Correction; Is $0.00004 Rally Close? CoinGape
Source link ]]>
Polygon’s native token, MATIC, has experienced a notable disparity compared to the broader cryptocurrency market. Unlike the top cryptocurrencies that have posted double-digit gains year-to-date, MATIC has failed to post positive performance across all time frames since the 2021 bull run.
Adding to the concern, MATIC’s price has recorded losses amounting to 16.5% over the past seven days. This downward trend has prompted the token to test a crucial macro support level, raising questions about its future trajectory.
Amid these developments, Polygon has announced a strategic partnership with Aragon, a developer of decentralized autonomous organizations, to introduce a “governance hub” for the Polygon community.
Simplified Governance Hub For Polygon?
According to a recent blog post by the Layer 2 solution protocol, the governance hub is “designed to empower” users and builders, allowing them to influence the core development of Polygon’s technology. The hub will reportedly be developed in phases in collaboration with Aragon to ensure that community feedback is incorporated to create a decentralized platform that aligns with community values.
Related Reading
The governance hub will feature a unified interface for “two essential pillars” of Polygon’s governance: protocol and system smart contract governance.
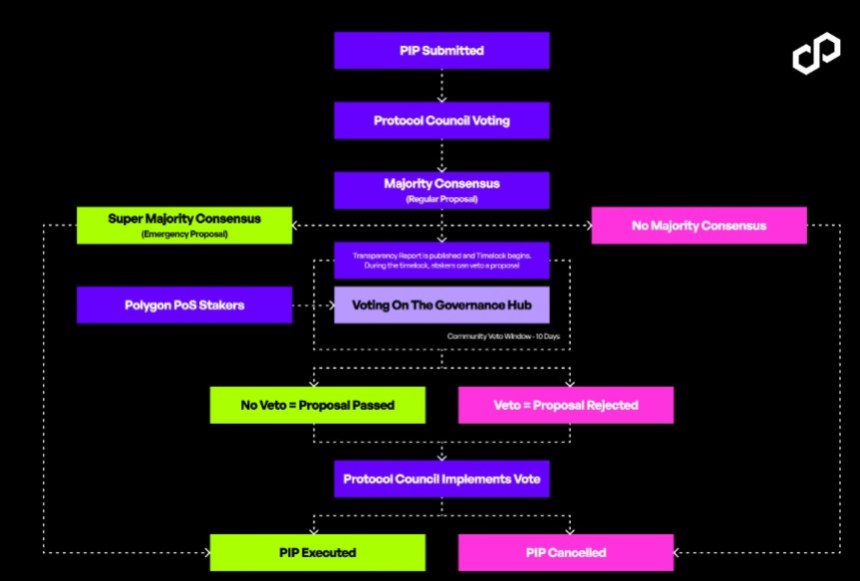
The hub seeks to increase transparency and encourage greater community participation in protocol governance. As for system smart contract governance, it introduces an upgraded framework that prioritizes structured decision-making processes while maintaining transparency and safety.
In addition, Aragon will leverage its expertise to build the Polygon Governance Hub using Aragon OSx. This tool enables the construction of customized on-chain governance solutions that can be adapted over time through a modular plugin-based architecture. Polygon stated in its announcement:
Polygon, and all related network architecture, needs flexible, transparent, and future-proof governance mechanisms and tooling. The Polygon Governance Hub is central to achieving this.
MATIC Market Capitalization Drops Dramatically
Despite the developers’ focus on community governance within the Polygon ecosystem, key metrics indicate a consistent decline in the MATIC token’s price over the past year.
For instance, the token’s market capitalization has experienced a significant drop, plummeting nearly 50% in just three months. In March, it was valued at $9.9 billion, whereas it is currently valued at $5.6 billion. This decline suggests a potential capital shift towards other large-cap tokens or profit-taking activities.
Furthermore, MATIC’s trading volume has also seen a notable decrease of approximately 18% in the past 24 hours, according to CoinGecko data. The trading volume now stands at a mere $293 million. Moreover, MATIC has witnessed a substantial 80% decline from its all-time high of $2.92 in December 2021.
Related Reading
Presently, the token faces a critical test at an 8-month support level, as depicted in the MATIC/USD daily chart below, with its current trading price at $0.5982. Should the price continue to decline without a significant catalyst to drive an upward trend and price recovery, attention should be paid to the next support level at $0.5700.
The future trajectory of the MATIC price remains uncertain, and it remains to be seen whether further downside movement is in store or if a bounce at the current support level will materialize, offering potential opportunities for bullish investors.
Featured image from DALL-E, chart from TradingView.com
Bitcoin (BTC) Exchange Outflows Soar To 8-Month High: Shiba Inu (SHIB) and NuggetRush (NUGX) Announces Major … Cryptonews
Source link ]]>
Dogecoin’s 8-month high – What does its price prediction have in store? AMBCrypto News
Source link ]]>
Bitcoin’s surge past $35,000 on the 24th and 25th of October took the crypto world by surprise, as it indicated what might be the beginning of a new bullish sentiment. Trading volumes for the world’s largest cryptocurrency hit their highest levels since March, showing that interest in Bitcoin is booming once more.
The entire crypto market saw an inflow of funds during the week, leading to a surge in market cap. Data from CoinGecko shows that the entire market cap increased from $1.184 trillion on Sunday, October 22, to $1.312 trillion on Wednesday, October 25. Most of this inflow went into Bitcoin, which saw its share of the cryptocurrency market increase from 49.58% to 51.47 % during this same time period.
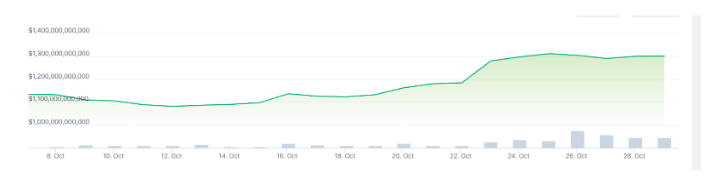
Chart From CoinGecko
Daily Crypto Exchange Volumes Reach 8-Month High
The recent boom in Bitcoin and cryptocurrency prices pushed Bitcoin daily trading volumes on crypto exchanges to their highest level since March. According to The Block’s data dashboard, the seven-day moving average for spot exchange volumes across multiple exchanges hit $24.12 billion on Thursday and $23.98 billion on Friday, respectively. In comparison, Bitcoin trading volume on exchanges was at $11.02 billion on the first day of the month.
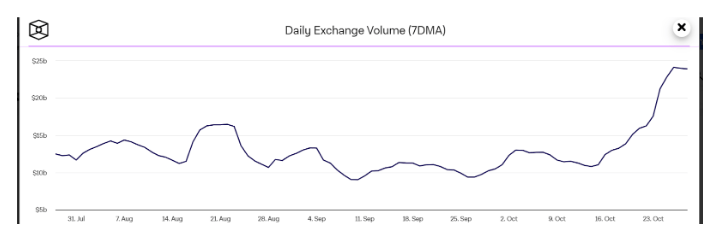
Chart from The Block
A similar metric from IntoTheBlock shows Bitcoin transactions reaching 1.4 million BTC as bulls looked to push Bitcoin to $35,000.
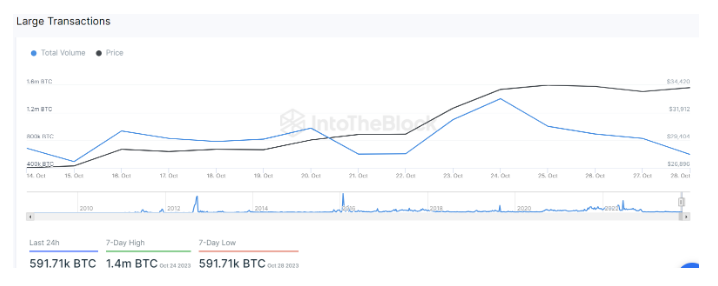
Chart from IntoTheBlock
Trading volumes are an important metric because higher volumes suggest greater interest and activity in a market. It means more people are actively buying and selling, leading to more liquidity and volatility.
Whale activity also increased during this time period, as indicated by on-chain trackers. Whale transaction tracker Whale Alerts has shown various BTC transactions amounting to millions of dollars to and from crypto exchanges.

— Whale Alert (@whale_alert) October 26, 2023
BTCUSD trading at $34,187 on the weekend chart: TradingView.com
— Whale Alert (@whale_alert) October 26, 2023
— Whale Alert (@whale_alert) October 27, 2023
What’s Next? More Bitcoin Movement?
Bitcoin has since formed a resistance level around $35,000 and is now trading in a range. At the time of writing, Bitcoin is trading at $34,150, still up by 14.47% in a 7-day timeframe. While price action seems to be moving sideways at the moment, there are still hopes of continued momentum from the bulls to push BTC past $35,000 in the new week.
Matt Hougan, CEO of crypto index fund manager Bitwise, has hinted at a further inflow of money into Bitcoin. Hougan makes this prediction on spot Bitcoin ETFs to project an inflow of around $50 billion within the first five years of its launch. Others like crypto financial services platform Matrixport have made more optimistic claims.
Data from analytics platform mempool.space has shown a sustained increase in activity on the BTC network. If bulls continue to maintain a strong push, we could see Bitcoin reach as high as $45,000 in the early days of November.
Featured image from Shutterstock
Bitcoin, Dogecoin Lead Bounce in Crypto Majors Day After Record 8-Month Liquidations CoinDesk
Source link ]]>
Bitcoin, Dogecoin lead bounce in crypto majors day after record 8-month liquidations FXStreet
Source link ]]>