Ethereum price failed to stay above $2,950 and declined again. ETH is now consolidating and might soon aim to attempt another recovery wave if it clears $2,850.
- Ethereum started a fresh decline below the $2,920 zone.
- The price is trading below $2,900 and the 100-hourly Simple Moving Average.
- There is a connecting bearish trend line forming with resistance at $2,925 on the hourly chart of ETH/USD (data feed via Kraken).
- The pair could continue to move down if it settles below the $2,800 zone.
Ethereum Price Faces Renewed Selling Pressure
Ethereum price attempted a fresh increase but struggled above $2,950, like Bitcoin. ETH price dipped below $2,920 and $2,900 to enter a bearish zone.
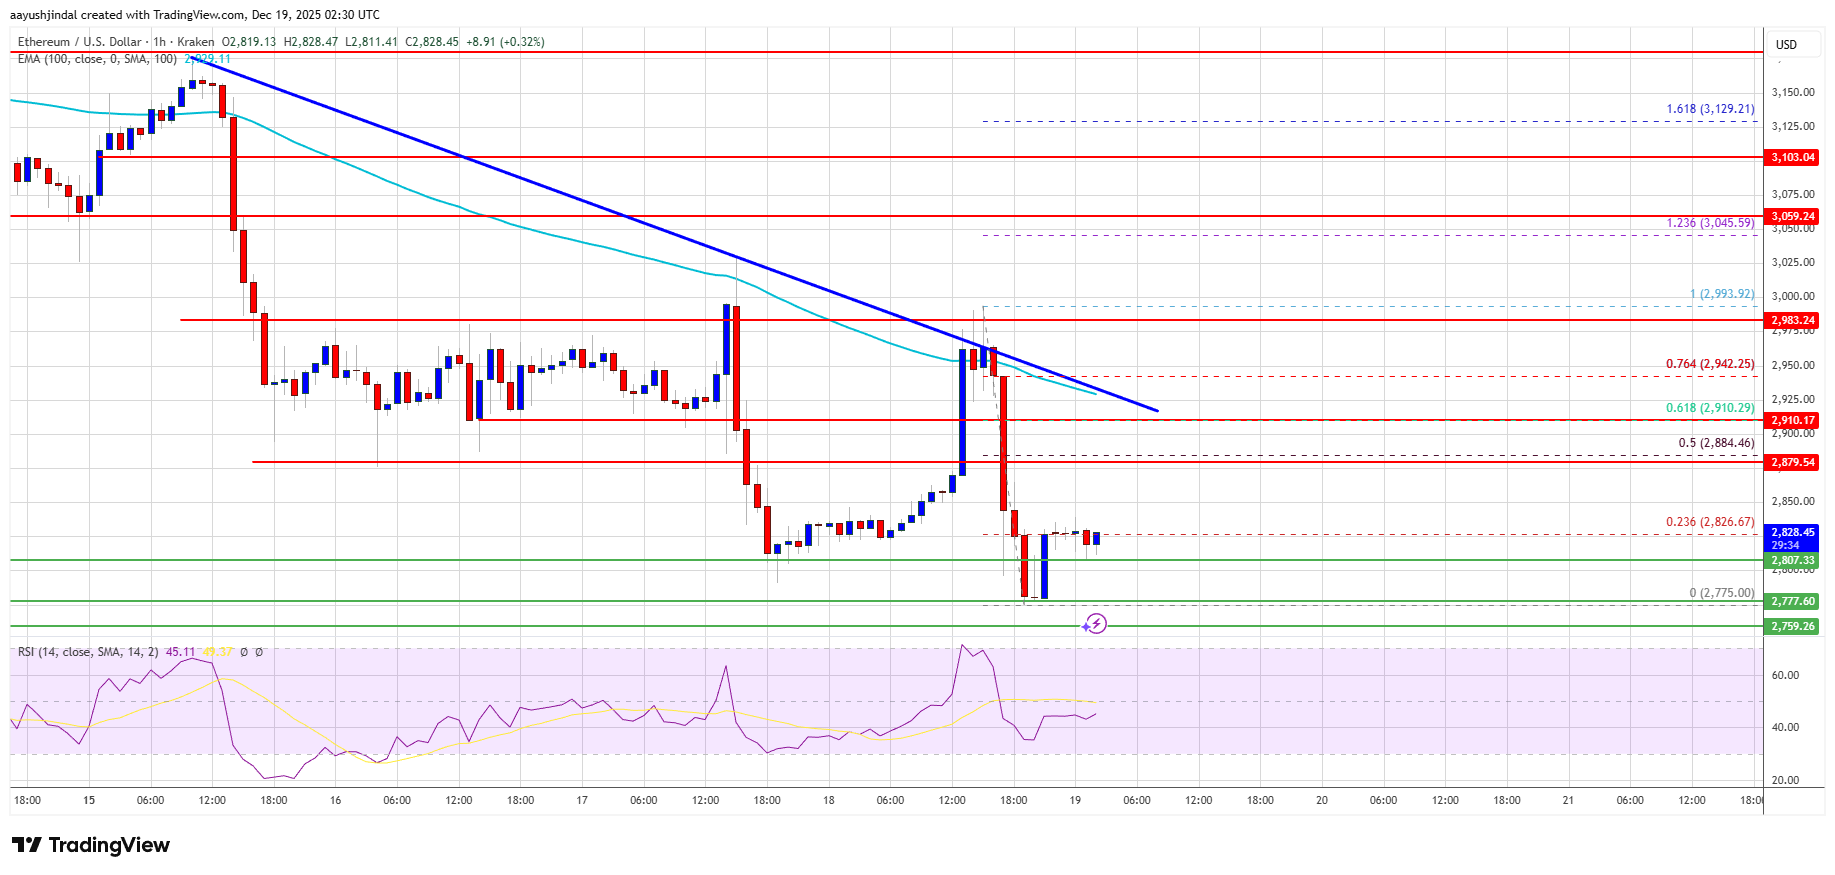
The bears even pushed the price below $2,820. A low was formed at $2,775 and the price is now consolidating losses well near the 23.6% Fib retracement level of the downward move from the $2,993 swing high to the $2,775 low.
Ethereum price is now trading below $2,870 and the 100-hourly Simple Moving Average. Besides, there is a connecting bearish trend line forming with resistance at $2,925 on the hourly chart of ETH/USD.
If there is another upward move, the price could face resistance near the $2,850 level. The next key resistance is near the $2,880 level and 50% Fib retracement level of the downward move from the $2,993 swing high to the $2,775 low. The first major resistance is near the $2,925 level and the trend line.
A clear move above the $2,925 resistance might send the price toward the $3,000 resistance. An upside break above the $3,000 region might call for more gains in the coming days. In the stated case, Ether could rise toward the $3,080 resistance zone or even $3,120 in the near term.
Downside Continuation In ETH?
If Ethereum fails to clear the $2,850 resistance, it could start a fresh decline. Initial support on the downside is near the $2,800 level. The first major support sits near the $2,775 zone.
A clear move below the $2,775 support might push the price toward the $2,720 support. Any more losses might send the price toward the $2,640 region. The next key support sits at $2,620.
Technical Indicators
Hourly MACD – The MACD for ETH/USD is losing momentum in the bearish zone.
Hourly RSI – The RSI for ETH/USD is now below the 50 zone.
Major Support Level – $2,775
Major Resistance Level – $2,880
Reason to trust
![]()
Strict editorial policy that focuses on accuracy, relevance, and impartiality
Created by industry experts and meticulously reviewed
The highest standards in reporting and publishing
Strict editorial policy that focuses on accuracy, relevance, and impartiality
Morbi pretium leo et nisl aliquam mollis. Quisque arcu lorem, ultricies quis pellentesque nec, ullamcorper eu odio.
Bitcoin price started a fresh increase above the $106,000 zone. BTC is now consolidating and might attempt to clear the $110,500 resistance.
- Bitcoin started a fresh upward move above the $107,000 zone.
- The price is trading above $107,000 and the 100 hourly Simple moving average.
- There is a bullish trend line forming with support at $106,850 on the hourly chart of the BTC/USD pair (data feed from Kraken).
- The pair could start a fresh decline if it breaks the $105,000 support zone.
Bitcoin Price Gains Pace
Bitcoin price started a fresh increase after it settled above the $103,500 support zone. BTC was able to surpass the $104,400 and $105,000 resistance levels.
The bulls even pumped the price above the $108,000 resistance. A high was formed at $110,550 and the price is now consolidating gains above the 23.6% Fib retracement level of the upward move from the $100,400 swing low to the $110,550 high.
Bitcoin is now trading above $108,000 and the 100 hourly Simple moving average. There is also a bullish trend line forming with support at $106,850 on the hourly chart of the BTC/USD pair.
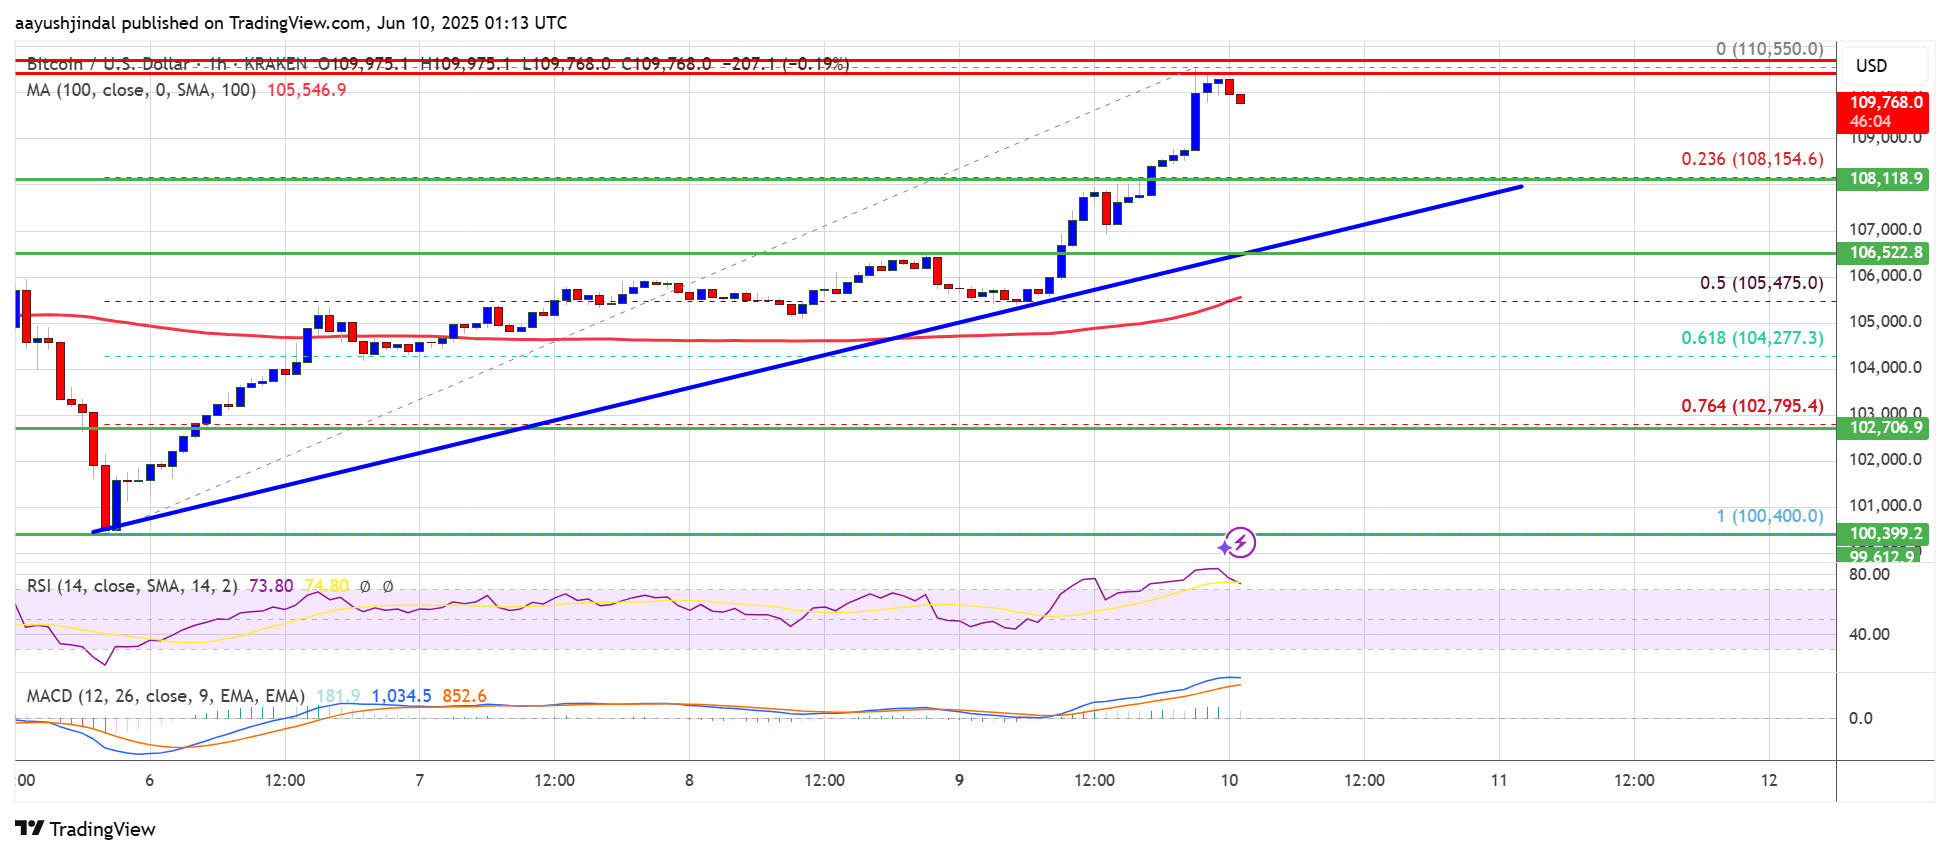
On the upside, immediate resistance is near the $110,000 level. The first key resistance is near the $110,500 level. The next key resistance could be $112,500. A close above the $112,500 resistance might send the price further higher. In the stated case, the price could rise and test the $113,800 resistance level. Any more gains might send the price toward the $115,000 level.
Another Decline In BTC?
If Bitcoin fails to rise above the $110,500 resistance zone, it could start another decline. Immediate support is near the $108,200 level. The first major support is near the $106,500 level and the trend line.
The next support is now near the $105,500 zone and the 50% Fib retracement level of the upward move from the $100,400 swing low to the $110,550 high. Any more losses might send the price toward the $103,500 support in the near term. The main support sits at $102,000, below which BTC might gain bearish momentum.
Technical indicators:
Hourly MACD – The MACD is now gaining pace in the bullish zone.
Hourly RSI (Relative Strength Index) – The RSI for BTC/USD is now above the 50 level.
Major Support Levels – $108,000, followed by $106,500.
Major Resistance Levels – $110,500 and $112,500.