Cardano (ADA) Price Prediction: Weekly Bullish Engulfing Aligns with Four-Month Whale Wallet High openPR.com
Source link ]]>
XRP is showing signs of hesitation after a strong rebound, struggling to push past key resistance levels. The recent price action fits neatly within an Elliott Wave pattern, suggesting the market may be entering its final consolidation phase before the next major move unfolds.
Market Pauses After The Storm
CasiTrades, in a recent market update, explained that following last Friday’s sharp wipeout, prices managed to rebound impressively, but that momentum now appears to be losing steam. According to the analyst, such pauses are natural after strong moves. In Elliott Wave Theory (EWT), this type of slowdown aligns with Wave 4, a stage where the market consolidates before preparing for the final impulsive wave.
The analyst emphasized that markets rarely pivot directly after a major Wave 3 decline. Instead, they often complete an exhausted Wave 5 move to wrap up the impulse cycle before a fresh uptrend begins. However, CasiTrades noted that the market has not yet shown the kind of strength needed to invalidate the final dip.
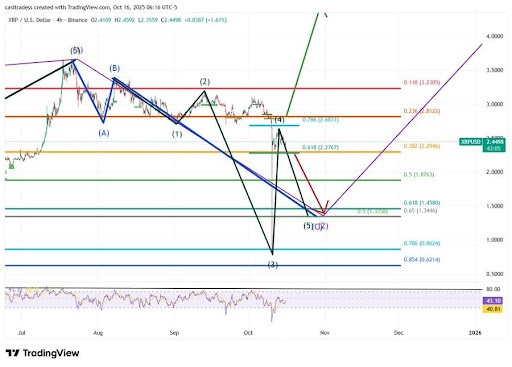
Price action is currently stalling around Wave 4 resistance levels. If the market were truly in a sharp V-shaped recovery, it should have already cleared the $2.82 resistance mark with strong momentum, but that has yet to happen. Given these conditions, the analyst believes that the market may still need one more wave down to fully exhaust selling pressure and reset sentiment.
Market Data Chaos: No “Universal” XRP Chart
CasiTrades went on to emphasize that market data across exchanges has become highly inconsistent, making accurate analysis challenging. The analyst pointed out that each trading platform displayed a different low during the recent crash, with some pairs dipping below $1, while others managed to hold at much higher levels. With this disparity, CasiTrades advised traders to focus on the exchange they are personally trading on to ensure precision, as there is no “universal” XRP chart.
According to the analyst, on Binance USD, XRP’s price wicked as low as $0.77, marking a sharp 72% drop from local highs and falling below the 0.786 Fibonacci retracement level. While CasiTrades believes such extreme lows are unlikely to repeat, the next potential retracement levels around $1.46 (0.618 Fib) and the golden pocket near $1.35 remain key areas of interest. These zones align with multiple technical factors, including Wave 5 extensions, macro Fibonacci retracements, and Wave 2 targets.
The analyst explained that if XRP were to retest these deeper levels, it could trigger a powerful reversal, potentially setting the stage for the long-anticipated impulsive wave that targets the $6.50 to $10.00 range.
Despite the chaos caused by the recent market crash, CasiTrades sees a potential silver lining. She noted that the crash might have shifted XRP’s structure from a shallow Wave 4 correction to a broader macro Wave 2 retracement, which may precede the strongest impulse waves in the cycle.
]]>Dogecoin Price Prediction: DOGE Coils for a $0.46 Breakout as 42-Day Cycle Aligns with Key SMA200 Support Brave New Coin
Source link ]]>
MAGACOIN FINANCE Stage 3 Momentum Aligns With XRP Breakout Setup — While Cardano Lags Behind MSN
Source link ]]>
Cardano Price Prediction: Bullish Setup Aligns With Institutional Interest as $1.50 Target Emerges Brave New Coin
Source link ]]>
Cardano Price Prediction Hints at $1.50 as M2 Liquidity Aligns With Technicals Brave New Coin
Source link ]]>
Bitcoin volatility aligns with stocks, Dogecoin gets ETP boost, says 21Shares exec Crypto News
Source link ]]>
The price of Bitcoin (BTC) is undergoing bullish consolidation at the moment after the intense selloff in the broader market cooled off. The current outlook shows relief for a coin that dropped as low as $76,624.25 in the past week. Per the historical trend of BTC prices, this consolidation might be a buildup to a massive rally for the top coin.
Bitcoin Price and Potential $200,000 Play
When writing, the BTC price changed hands for $83,927.24, up by 1.38% in 24 hours. The coin has jumped from a low of $82,017.90 to a high of $84,725.32, a show of brewing breakout.
Market analyst Rekt Capital analyzed whether this current price is a short-term relief. He spotlighted a trend from June 2021, when the price of Bitcoin was consolidating between the 21-week EMA and the 50-week EMA. The consolidation came just after a crash.
About a week ago, the BTC price crashed, triggering millions in liquidation across the market. Following this price slump, the coin is consolidating between the same EMA showcased by Rekt Capital.
In June 2021, Bitcoin prices increased from $33,000 to $42,000. This gives an average price of $37,500. From here, the coin jumped by over 123.95% to its current price of $83,927.24. If history repeats, Bitcoin Bitcoin may soar to almost $187,280 or approximately $200,000.
BTC Price and Accumulation Trend
According to market data from Glassnode, Bitcoin currently has a high of 0.1. According to the market analytics platform, this figure indicates sustained buying pressure despite the market selloff.
Rather than steer clear of the market, Glassnode hinted that the coin’s distribution remains dominant overall. Other onchain indications also point to reboot from BTC proponents. IntoTheBlock data points to a 5.34% surge in large transactions to $34.7 billion.
This whale transaction is important as it shows a trend shift among market players that can impact prices. It is also complemented by the 24% surge in BTC trading volume of crypto exchanges, a sign of sustained positive sentiment.
What Next for the Crypto Market?
The growth or fall in the price of Bitcoin has a way of impacting the broader market. In an earlier cryptocurrency price prediction, the impact of Trump and Putin’s peace deal over Ukraine was considered. Experts are convinced the broader market may ignite a bullish rally if the conversations turn positive.
Although spot Bitcoin ETF market has been showcasing outflows over the past week, the coin is positioned to be the biggest beneficiary in this shift. While the Rekt Capital historic forecast teases $200,000, experts like Cathie Wood predict deflationary boom for the market, riding on massive BTC adoption rate by institutions and governments.
Godfrey Benjamin
Benjamin Godfrey is a blockchain enthusiast and journalists who relish writing about the real life applications of blockchain technology and innovations to drive general acceptance and worldwide integration of the emerging technology. His desires to educate people about cryptocurrencies inspires his contributions to renowned blockchain based media and sites. Benjamin Godfrey is a lover of sports and agriculture.
Disclaimer: The presented content may include the personal opinion of the author and is subject to market condition. Do your market research before investing in cryptocurrencies. The author or the publication does not hold any responsibility for your personal financial loss.
Cardano Shows Positive Surge, ADA Aligns With Broader Market Trends By The News Crypto Investing.com Canada
Source link ]]>
Crypto Market News: Janet Yellen, the US Treasury, on Wednesday acknowledged there was some stress in the financial markets, amid uncertainty around the impending debt ceiling deal deadline. Yellen reiterated that the US government was highly likely to run out of sufficient cash in early June 2023. Meanwhile, top Republican Kevin McCarthy said earlier on Wednesday that there was no progress in the talks since his meeting with US President Joe Biden. Any indication of failure to reach the deal before the June 1 deadline could potentially lead to financial markets catastrophe, similar to that of the July 2011 market crash.
Also Read: Billionaire Mark Cuban Believes SECs Attack On Crypto Tokens Won’t Work
In this context, McCarthy is set to speak in a press conference on Wednesday. Overall, a word of commitment about efforts to avoid the default is the need of the hour, not just for the stock markets but also the crypto market.
Bitcoin Price Lacks Support Ahead Of US Debt Ceiling Deadline
The US Treasury Secretary said it would be hard to predict the exact timeline for when the default will kick in if a deal is not met. Earlier, Yellen warned that in case of a US debt default, there could be massive losses in stock markets, to the tune of around 45%.
“Even in the run up to possible default, there will likely be substantial financial market distress. We are committed to not having missed payments, (I am) not involved in planning for what happens if there is a default.”
Meanwhile, not all is favorable for a Bitcoin price jump, despite chances of a debt default. Going by the recent US regional banking crisis experience, the crypto market could see some positive momentum. However, the top cryptocurrency shows signs of probability of a Bitcoin price correction between the $23,200 and $24,000 range, according to Ali Charts.
“Notice that #Bitcoin appears to be losing all major areas of support. This increases the probability of a correction to the next important demand wall between $23,200 and $24,000, where 850,000 addresses had previously purchased 340,000 $BTC.”
Also Read: Bitcoin (BTC) Price Breaking Under Crucial Support Levels, $23,000 Coming?
The presented content may include the personal opinion of the author and is subject to market condition. Do your market research before investing in cryptocurrencies. The author or the publication does not hold any responsibility for your personal financial loss.
✓ Share: