Notice: Function _load_textdomain_just_in_time was called incorrectly. Translation loading for the updraftplus domain was triggered too early. This is usually an indicator for some code in the plugin or theme running too early. Translations should be loaded at the init action or later. Please see Debugging in WordPress for more information. (This message was added in version 6.7.0.) in /home/aonyeani76/cryptocurrencypanther/wp-includes/functions.php on line 6131
Notice: Function _load_textdomain_just_in_time was called incorrectly. Translation loading for the hustle domain was triggered too early. This is usually an indicator for some code in the plugin or theme running too early. Translations should be loaded at the init action or later. Please see Debugging in WordPress for more information. (This message was added in version 6.7.0.) in /home/aonyeani76/cryptocurrencypanther/wp-includes/functions.php on line 6131
Notice: Function _load_textdomain_just_in_time was called incorrectly. Translation loading for the wpforms-lite domain was triggered too early. This is usually an indicator for some code in the plugin or theme running too early. Translations should be loaded at the init action or later. Please see Debugging in WordPress for more information. (This message was added in version 6.7.0.) in /home/aonyeani76/cryptocurrencypanther/wp-includes/functions.php on line 6131 Appeared – Cryptocurrencypanther
https://cryptocurrencypanther.com
Latest Crypto NewsTue, 10 Mar 2026 21:13:50 +0000en-US
hourly
1 https://wordpress.org/?v=6.9.4https://cryptocurrencypanther.com/wp-content/uploads/2021/07/cropped-Cryptocurrency-e1626714913653-32x32.pngAppeared – Cryptocurrencypanther
https://cryptocurrencypanther.com
3232Bitcoin Candlestick Structure That Led To Crash To Below $20,000 Last Cycle Just Appeared Again
https://cryptocurrencypanther.com/2026/03/10/bitcoin-candlestick-structure-that-led-to-crash-to-below-20000-last-cycle-just-appeared-again/
https://cryptocurrencypanther.com/2026/03/10/bitcoin-candlestick-structure-that-led-to-crash-to-below-20000-last-cycle-just-appeared-again/#respondTue, 10 Mar 2026 21:13:50 +0000https://cryptocurrencypanther.com/2026/03/10/bitcoin-candlestick-structure-that-led-to-crash-to-below-20000-last-cycle-just-appeared-again/
Bitcoin (BTC) is showing technical warning signs that have caught the attention of market watchers, with one analyst nowpredicting a dramatic price collapse in the world’s largest cryptocurrency. The analyst noted that a Bitcoin candlestick pattern that previously preceded a devastating crash to below $20,000 has reappeared on the weekly chart, reigniting fears that history may be repeating itself. If it does, it could completely rewrite the narrative of this entire market cycle.
Historical Setup Signals Bitcoin Potential Crash To $19,000
Market analyst Tony Severino has issued a stark warning to Bitcoin investors and holders, sharing a technical analysis on X that draws a chilling comparison betweencurrent price action and a previous cycle crash. The analyst has projected that Bitcoin could decline as low as $19,000 inthis bear market.
Related Reading
The chart shared by Severino places two Bitcoin weekly candlestick patterns side by side, revealing a near-identical structural setup between the current market cycle and a previous bear phase. The left panel shows Bitcoin’s recent trajectory from late 2025 to early 2026, while the right panel displays a historical period that ultimately saw prices collapse below $20,000.
Severino expressed his surprise at the chart patterns, noting that it was “absolutely wild” how similar the candlestick structures are between the two periods. He added that even the technical indicators are “almost exactly the same.”
Both chart panels feature a prominent rectangular consolidation zone followed by a pink-highlighted rebound area. The visual symmetry between the two timeframes underpins the analyst’s bearish thesis, suggesting that the current rebound around the pink zone could be short-lived, followed by a potential crash below $19,000 if historical trends repeat.
Notably, the analyst’s bearish forecast drew skepticism from some members of the crypto community. One member argued that a drop to such levels would not simply represent a routine cycle correction, butthe largest retracement in Bitcoin’s history. Severino, however, stood firmly on his analysis and forecast, stating that a 74% correction was entirely possible and even normal within Bitcoin’s historical framework. Not backing down, he insisted again that the market maystill have significant downside to navigate before any meaningful bottom is established.
However, CoinMarketCap data shows that Bitcoin has gained over 4.8% in the last 24 hours, with its daily trading volume up by more than 23.4%. The sudden price increase has been attributed to sustained inflows into Spot Bitcoin ETFs and easing geopolitical tensions in the Middle East.
BTC trading at $70,764 on the 1D chart | Source: BTCUSDT on Tradingview.com
Featured image from Pixabay, chart from Tradingview.com
]]>https://cryptocurrencypanther.com/2026/03/10/bitcoin-candlestick-structure-that-led-to-crash-to-below-20000-last-cycle-just-appeared-again/feed/0Bitcoin Bullish Divergence That Appeared Before The May ATH Has Returned Again
https://cryptocurrencypanther.com/2025/06/20/bitcoin-bullish-divergence-that-appeared-before-the-may-ath-has-returned-again/
https://cryptocurrencypanther.com/2025/06/20/bitcoin-bullish-divergence-that-appeared-before-the-may-ath-has-returned-again/#respondFri, 20 Jun 2025 22:37:46 +0000https://cryptocurrencypanther.com/2025/06/20/bitcoin-bullish-divergence-that-appeared-before-the-may-ath-has-returned-again/
Reason to trust
Strict editorial policy that focuses on accuracy, relevance, and impartiality
Created by industry experts and meticulously reviewed
The highest standards in reporting and publishing
Strict editorial policy that focuses on accuracy, relevance, and impartiality
Morbi pretium leo et nisl aliquam mollis. Quisque arcu lorem, ultricies quis pellentesque nec, ullamcorper eu odio.
Bitcoin is currently hovering in a tightly compressed price range after failing multiple times to break above $110,000 earlier this month. The past few days have been characterized by the leading cryptocurrency trading around $105,000, with neither bulls nor bears taking control. Despite the overall consolidation, a subtle yet significant signal is starting to flash beneath the surface, particularly on the 4-hour chart, that might send Bitcoin to a new all-time high soon.
Return Of Rare Divergence Pattern On Bitcoin’s 4H Chart
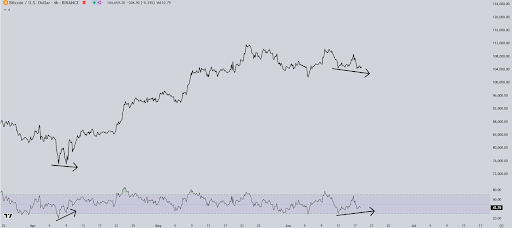
Crypto analyst Luca (@CrypticTrades_) took to social media platform X to share a chart that highlights an important technical development on Bitcoin’s 4-hour timeframe: the return of a bullish divergence. This signal, which previously appeared in early April, preceded the massive rally that catapulted Bitcoin to its May 22 all-time high of $111,800. The same divergence is forming once again and another Bitcoin price breakout may be very close.
Related Reading
As shown in the 4-hour candlestick timeframe chart below, the divergence is clearly illustrated between price action and the Relative Strength Index (RSI). Price has been forming lower lows, while the RSI has been printing higher lows. This mismatch serves as an early indicator that selling momentum is fading, and a reversal to the upside could follow. The previous instance of this pattern directly preceded a sharp move from a $74,000 low in early April to above $111,000 in just a few weeks.
What Does This Divergence Mean For Bitcoin’s Price?
Bullish divergences on mid-timeframe charts like the 4-hour have a reputation for being the first reversal signals when supported by rising volume. In Bitcoin’s current case, the appearance of this pattern again could mean that the recent retracement from $111,800 has run its course. With RSI now trending upward even as price presses slightly lower, Bitcoin may be witnessing another hidden accumulation phase before its next leg higher.
Related Reading
If the pattern holds true to its previous performance in April, the leading cryptocurrency could be setting up for another push toward new all-time high levels. Bitcoin is currently not far off from a new all-time high, as it is only about 5.5% away from its price peak. Based on this, another strong breakout could easily aim beyond the previous $111,800 high.
Although Bitcoin’s price is relatively stagnant for now, the presence of this bullish divergence is a reminder of how quickly things can change. The previous bullish divergence ended up with a 50% price surge. A similar performance from the current price level would translate to another target above $160,000.
At the time of writing, Bitcoin is trading at $105,700, up by 1.4% in the past 24 hours, already showing signs of the bullish divergence signal coming into action.
BTC trading at $106,072 on the 1D chart | Source: BTCUSDT on Tradingview.com
Featured image from Getty Images, chart from Tradingview.com
]]>https://cryptocurrencypanther.com/2025/06/20/bitcoin-bullish-divergence-that-appeared-before-the-may-ath-has-returned-again/feed/0Here’s What Happened To Bitcoin The Last Time It Appeared
https://cryptocurrencypanther.com/2023/12/05/heres-what-happened-to-bitcoin-the-last-time-it-appeared/
https://cryptocurrencypanther.com/2023/12/05/heres-what-happened-to-bitcoin-the-last-time-it-appeared/#respondTue, 05 Dec 2023 23:09:57 +0000https://cryptocurrencypanther.com/2023/12/05/heres-what-happened-to-bitcoin-the-last-time-it-appeared/
Bitcoin is on an impressive run and finally broke above $40,000 for the first time in over a year. This run has been in the making for a few months with the climax coming between the months of October and December. As a result, Bitcoin has now recorded 8 green candles on the weekly chart and historical performance suggests that this is bullish for the price.
8 Green Candles For BTC On The Weekly Chart
In the last two months, the Bitcoin price has consistently closed in the green, a trend that seemed foreign only a few months ago. This green trend has continued through November which was expected to be a bearish month and with the start of December, Bitcoin saw another green weekly close.
During this time that the BTC price has seen consistent green closes on the weekly chart, the price has gone from as low as $27,000 to as high as $42,000. This means that the price has risen approximately 50%, adding around $15,000 to its value in this two-month period.
This comes amid a time of polarizing views between the bulls and the bears despite the bullish indicators continuously winning out. The gains of the last eight weeks have completely washed out a year of intense bearish headwinds and have seen the Bitcoin price completely recover all its losses from the FTX collapse, as well as its far-reaching contagion.
With Bitcoin, historical performance can often be a good pointer to future performance, especially when important trends are being repeated. For example, the last time that the digital asset confirmed 8 green candles on the weekly chart, the price exploded not too long after.
This is seen back in 2017 right at the start of the bull market where the price went from around $1,100 to $2,900 before a slight pullback. However, once the pullback was over, the price would begin another uptrend that would send Bitcoin above $10,000 for the first time ever.
If this trend were to repeat itself this time around, then a pullback from this level is likely, but not expected to last. The resulting pump from the pullback will likely be the confirmation of the bull market, leading to a new all-time high price.
Bitcoin has also done incredibly well following 8 green candles on the daily charts. As reported by NewBTC, the Bitcoin price has also risen quickly when these green candles appear. As such, it is an all-around bullish signal for Bitcoin.
]]>https://cryptocurrencypanther.com/2023/12/05/heres-what-happened-to-bitcoin-the-last-time-it-appeared/feed/0BlackRock iShares Bitcoin ETF Appeared on DTCC Website since August
https://cryptocurrencypanther.com/2023/10/25/blackrock-ishares-bitcoin-etf-appeared-on-dtcc-website-since-august/
https://cryptocurrencypanther.com/2023/10/25/blackrock-ishares-bitcoin-etf-appeared-on-dtcc-website-since-august/#respondWed, 25 Oct 2023 16:08:56 +0000https://cryptocurrencypanther.com/2023/10/25/blackrock-ishares-bitcoin-etf-appeared-on-dtcc-website-since-august/
A DTCC spokesperson confirmed that the IBTC ticker for the BlackRock iShares Bitcoin ETF has appeared since August through a unique ID code called CUSIP.
Bitcoin has made a strong move moving to $35,000 earlier this week and clocking more than 20% gains on the weekly chart. This typically happened as the BlackRock iShares Bitcoin ETF ticker IBTC surfaced on the Depository Trust and Clearing Corporation’s (DTCC) website.
Interestingly, one spokesperson from DTCC recently confirmed with CoinDesk that the appearance of the ticker is nothing new. Rather, it’s present on the DTCC website since August 2023.
This week, crypto traders saw the appearance of BlackRock Inc‘s (NYSE: BLK) product on the page as a potential sign that its ETF might receive approval soon. However, DTCC clarified that having an ETF listed on the page doesn’t imply regulatory approval. It’s a preliminary step in the process, including securing a ticker symbol and a unique ID code called a CUSIP, which any ETF must complete while awaiting approval from the US Securities and Exchange Commission. The spokesperson added:
“It is standard practice for DTCC to add securities to the NSCC security eligibility file in preparation for the launch of a new ETF to the market”.
Market Analysts Share Views on BlackRock Bitcoin ETF
Amid the back and forth of the BlackRock iShares Spot Bitcoin ETF on the DTCC website, market experts shared their views on the development.
Joe Light, from Barron’s Online, observed a noticeable change in the new ETF listing compared to its previous version. The earlier listing had a “Y” indicating “yes” under the create/redeem section, while the updated version displayed an “N” for “no.” Light publicly wondered whether this change could suggest a launch without that attribute, similar to existing Bitcoin trusts, or if there were other reasons for this modification.
James Seyffart responded by suggesting that the alteration likely signifies BlackRock’s preparations for a potential launch. He explained that it indicates BlackRock is making the necessary preparations, pending SEC approval, and the “N” indicates that it’s not open for redemption because it’s not yet operational. Light speculated that the initial “Y” might have been a mistake that needed correction, which would make sense.
Gabor Gurbacs, founder of PointsVille and advisor to Tether and VanEck, provided some context for the situation. He emphasized that major institutions are actively working on creating spot Bitcoin ETFs, demonstrating their commitment to the space. Gurbacs also cautioned against drawing exaggerated conclusions from operational details, noting that the media often sensationalizes such filings. He stressed that the industry and regulatory collaboration are moving in the right direction and are positive developments.
Bhushan is a FinTech enthusiast and holds a good flair in understanding financial markets. His interest in economics and finance draw his attention towards the new emerging Blockchain Technology and Cryptocurrency markets. He is continuously in a learning process and keeps himself motivated by sharing his acquired knowledge. In free time he reads thriller fictions novels and sometimes explore his culinary skills.
Source link
]]>https://cryptocurrencypanther.com/2023/09/09/shibarium-optimized-and-almost-ready-for-reopening-xrp-lawyer-says-sec-caused-inestimable-damage-new-shiba-inu-scam-appeared-crypto-news-digest-by-u-today-u-today/feed/0Dogecoin’s value dropped as much as 9% after its logo on Elon Musk’s Twitter vanished as mysteriously as it had appeared – Fortune
https://cryptocurrencypanther.com/2023/04/07/dogecoins-value-dropped-as-much-as-9-after-its-logo-on-elon-musks-twitter-vanished-as-mysteriously-as-it-had-appeared-fortune/
https://cryptocurrencypanther.com/2023/04/07/dogecoins-value-dropped-as-much-as-9-after-its-logo-on-elon-musks-twitter-vanished-as-mysteriously-as-it-had-appeared-fortune/#respondFri, 07 Apr 2023 04:00:53 +0000https://cryptocurrencypanther.com/2023/04/07/dogecoins-value-dropped-as-much-as-9-after-its-logo-on-elon-musks-twitter-vanished-as-mysteriously-as-it-had-appeared-fortune/
Source link
]]>https://cryptocurrencypanther.com/2023/04/07/dogecoins-value-dropped-as-much-as-9-after-its-logo-on-elon-musks-twitter-vanished-as-mysteriously-as-it-had-appeared-fortune/feed/0A Rare Bullish Bitcoin Signal Has Finally Appeared
https://cryptocurrencypanther.com/2021/07/19/a-rare-bullish-bitcoin-signal-has-finally-appeared/
https://cryptocurrencypanther.com/2021/07/19/a-rare-bullish-bitcoin-signal-has-finally-appeared/#respondMon, 19 Jul 2021 15:17:34 +0000https://www.cryptocurrencypanther.com/2021/07/19/a-rare-bullish-bitcoin-signal-has-finally-appeared/
A rare bullish bitcoin signal, the difficulty ribbon compression, has started pumping up for the first time since the bull run started.
The Bitcoin Difficulty Ribbon Compression Goes Up
As pointed out by a BTC analyst on Twitter, the difficulty ribbon compression seems to be going up for the first time since the bull run started.
The indicator is a measure of the moving averages of bitcoin mining difficulty. The mining difficulty metric can be calculated by estimating the number of hashes for mining a block.
To properly quantify these values, the BTC difficulty ribbon compression uses a normalized standard deviation. Higher values have historically been associated with the price moving up, while lower values suggest a downward trend.
Now, here is how the chart looks like for the BTC difficulty ribbon compression in the past decade:
BTC difficulty ribbon compression seems to be sharply rising | Source: glassnode
The above graph reveals some interesting features about the indicator. It does seem like that the difficulty ribbon compression has a historic relationship with the price.
It looks like when the value of the indicator drops very low, BTC hits a low on the curve. And when it rises, like it is doing right now, the price also moves up.
However, there is something to consider here. The indicator is a measure of the mining difficulty, and right now the world hash rate is facing some special circumstances due to the China crackdowns.
After massively dropping for a while, the global Bitcoin hash rate has started to go up again as miners migrate from China to other countries like the US. This should mean the difficult would go up quickly as the usual mining farms start their operations again.
Such a ramp up in difficulty might look like what the chart is showing right now.
BTC Price
Bitcoin price is around $32k at the time of writing, down 4% in the last 7 days. Over the last month, the coin has dropped almost 17% in value.
Here is a chart showing the trend in the crypto’s value over the past 6 months:
Bitcoin seems to be on a downtrend | Source: BTCUSD on TradingView
BTC’s price continues to be range bound as the crypto remains stuck in the $30k to $35k range. It’s unclear when the coin might escape these levels, and which direction it might go in next.
If the difficulty ribbon compression is anything to go by, Bitcoin’s price might be seeing an increase soon. On the other hand, due to the special mining conditions, this rise in the value of the indicator might not directly translate to the price this time.