Cardano leads top 10 with 10% gain – But sentiment says bulls aren’t back AMBCrypto
Source link ]]>

Ethereum (ETH) has slipped 5.5% in the past seven days, with today’s decline adding another 1.4% as prices struggle near $4,400. Yet, despite the turbulence, derivatives data shows remarkable resilience.
According to CryptoQuant, Binance’s Ethereum open interest (OI) has remained steady above $8.4 billion, even after ETH dipped below $4,400 this week.
Typically, sharp price pullbacks trigger a significant drop in OI as traders unwind leveraged positions. This time, however, ETH traders are holding firm, suggesting either expectations of a rebound or a lack of conviction in further downside momentum.
The moderation in OI contraction, down just 3.4% in 24 hours compared to -6.25% earlier this week, further supports the idea that aggressive deleveraging is losing steam.
Ethereum Buyers Absorbing Pressure Despite Negative Flows
Market sentiment still leans bearish, with Binance’s Net Taker Volume consistently negative, ranging between -1.08 billion and -1.11 billion. This indicates sellers remain aggressive. However, the fact that OI is holding steady suggests buyers are quietly absorbing pressure rather than retreating completely.
Spot market activity adds another layer of optimism. Daily exchange withdrawals have regularly exceeded 120,000 ETH across platforms like Binance and Kraken. Such outflows reduce sell-side liquidity and hint at longer-term accumulation strategies.
Whether these flows reflect institutional custodial moves or retail positioning, they tighten exchange reserves and create conditions less favorable for extended sell-offs.
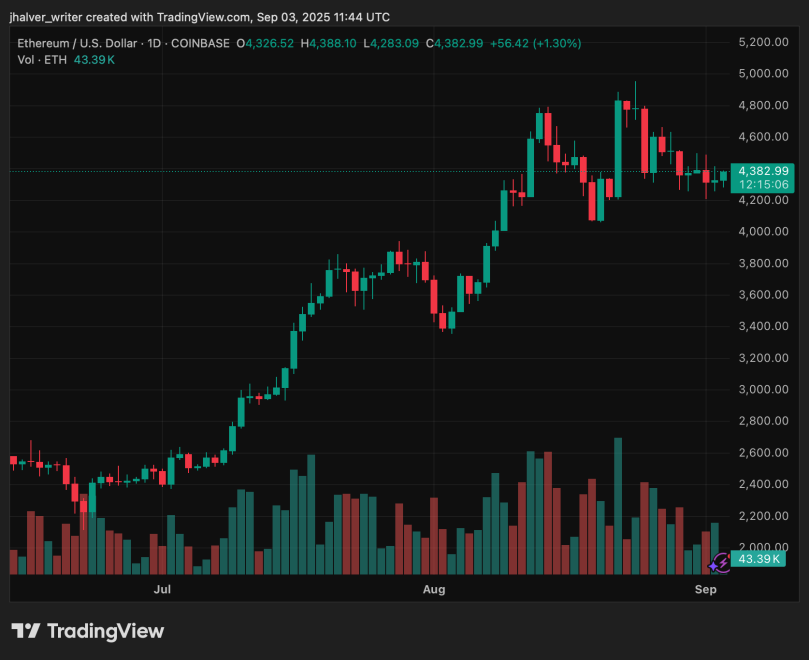
ETH's price trends to the upside on the daily chart. Source: ETHUSD on Tradingview
A Possible Bear Trap Before “Uptober”?
Technically, Ethereum’s chart resembles a bearish head-and-shoulders formation, raising alarms about further downside. Yet, some analysts argue this could be one of the “biggest bear traps” forming in the market. Crypto strategist Johnny Woo pointed to the $3,800–$4,100 range as a key support zone.
Should ETH hold above this level, traders sidelined by bearish sentiment may be forced to re-enter at higher levels, fueling an upside reversal. Historically, October has often brought relief rallies, dubbed “Uptober” by traders, suggesting that Ethereum’s current weakness might set the stage for a surprise rebound.
For now, Ethereum faces the challenge of shaking off September’s pressure while holding critical support. If buyers continue absorbing sell-side flows and OI stability persists, the stage could be set for a bullish counterattack heading into the final quarter of 2025.
Cover image from ChatGPT, ETHUSD chart from Tradingview
Editorial Process for bitcoinist is centered on delivering thoroughly researched, accurate, and unbiased content. We uphold strict sourcing standards, and each page undergoes diligent review by our team of top technology experts and seasoned editors. This process ensures the integrity, relevance, and value of our content for our readers.
Why Meme Coin Traders Looking for 100x Gains in 2025 Aren’t Touching Shiba Inu (SHIB) and Dogecoin (DOGE). Here’s Their Top Buy ThePrint
Source link ]]>
Why a 10x Run for Shiba Inu (SHIB) and a 21530% Surge for Rexas Finance (RXS) Aren’t as Crazy as They Sound The Tribune
Source link ]]>
SEC Confirms Meme Coins Like Shiba Inu and Dogecoin Aren’t Securities The Crypto Basic
Source link ]]>
Bitcoin price saw a short-term correction below the $90,000 zone. BTC is now again rising and the bulls could now aim for a move above $94,000.
- Bitcoin started a fresh increase from the $86,600 zone.
- The price is trading above $88,000 and the 100 hourly Simple moving average.
- There is a connecting bearish trend line forming with resistance at $91,000 on the hourly chart of the BTC/USD pair (data feed from Kraken).
- The pair could gain bullish momentum if it clears the $91,000 resistance zone.
Bitcoin Price Aims Higher
Bitcoin price started a short-term downside correction below the $90,000 level. BTC traded below the $88,000 level before the bulls appeared.
A low was formed at $86,622 and the price is now recovering higher. There was a move above the $90,000 level. A high was formed at $91,839 and the price is now consolidating. It tested the 50% Fib retracement level of the upward move from the $86,621 swing low to the $91,839 high.
Bitcoin price is now trading above $88,000 and the 100 hourly Simple moving average. On the upside, the price could face resistance near the $91,000 level. There is also a connecting bearish trend line forming with resistance at $91,000 on the hourly chart of the BTC/USD pair.
The first key resistance is near the $91,850 level. A clear move above the $91,850 resistance might send the price higher. The next key resistance could be $92,500.

A close above the $92,500 resistance might initiate more gains. In the stated case, the price could rise and test the $93,450 resistance level. Any more gains might send the price toward the $95,000 resistance level.
Another Decline In BTC?
If Bitcoin fails to rise above the $91,000 resistance zone, it could start a downside correction. Immediate support on the downside is near the $89,250 level.
The first major support is near the $87,850 level or the 76.4% Fib retracement level of the upward move from the $86,621 swing low to the $91,839 high. The next support is now near the $86,620 zone. Any more losses might send the price toward the $83,500 support in the near term.
Technical indicators:
Hourly MACD – The MACD is now losing pace in the bearish zone.
Hourly RSI (Relative Strength Index) – The RSI for BTC/USD is now above the 50 level.
Major Support Levels – $89,250, followed by $87,850.
Major Resistance Levels – $91,000, and $92,500.
Looking for Life-Changing Crypto Gains? Dogecoin and Shiba Inu Aren’t the Top Picks Anymore CryptoDaily
Source link ]]>
Dogecoin ETFs Aren’t as Crazy as They Sound, Analysts Say Decrypt
Source link ]]>
Crypto Experts Reveal Bold Predictions for Next Bull Run Leaders – And XRP and Cardano Aren’t on the List CryptoDaily
Source link ]]>
Dogecoin failed to surpass $0.1120 and corrected gains against the US Dollar. DOGE bulls are active near $0.1080 and might push it higher again.
- DOGE price is eyeing an upside break above $0.1120.
- The price is trading above the $0.1080 level and the 100-hourly simple moving average.
- There was a break below a key bullish trend line with support at $0.1090 on the hourly chart of the DOGE/USD pair (data source from Kraken).
- The price could start another increase if it clears the $0.1100 and $0.1120 resistance levels.
Dogecoin Price Eyes Upside Break
Dogecoin price extended its increase above the $0.1100 resistance zone. It even spiked above $0.1110 before the bears appeared. DOGE started a downside correction from the $0.1111 high like Bitcoin and Ethereum.
There was a move below the $0.1100 and $0.1095 levels. The price dipped below the 23.6% Fib retracement level of the upward move from the $0.1037 swing low to the $0.1111 high. Besides, there was a break below a key bullish trend line with support at $0.1090 on the hourly chart of the DOGE/USD pair.
However, the bulls were active near $0.1075. They protected the 50% Fib retracement level of the upward move from the $0.1037 swing low to the $0.1111 high. Dogecoin price is now trading above the $0.1080 level and the 100-hourly simple moving average.

Immediate resistance on the upside is near the $0.1095 level. The next major resistance is near the $0.1120 level. A close above the $0.1120 resistance might send the price toward the $0.1132 resistance. Any more gains might send the price toward the $0.1150 level. The next major stop for the bulls might be $0.1200.
More Losses In DOGE?
If DOGE’s price fails to climb above the $0.1095 level, it could start another decline. Initial support on the downside is near the $0.1080 level. The next major support is near the $0.1065 level.
The main support sits at $0.1050. If there is a downside break below the $0.1050 support, the price could decline further. In the stated case, the price might decline toward the $0.1000 level or even $0.0950 in the near term.
Technical Indicators
Hourly MACD – The MACD for DOGE/USD is now losing momentum in the bullish zone.
Hourly RSI (Relative Strength Index) – The RSI for DOGE/USD is now below the 50 level.
Major Support Levels – $0.1065 and $0.1050.
Major Resistance Levels – $0.1095 and $0.1120.
]]>