
- Dogecoin (DOGE) stalls near $0.095 as profit-taking caps upside.
- DOGE price is currently compressing between the $0.089 and $0.095 range.
- A breakout is likely as volatility builds ahead of April 20.
The price action around Dogecoin continues to sit in a tight and indecisive range, with recent trading showing very little directional strength.
At the time of writing, DOGE was trading around $0.092, moving inside a narrow 24-hour band between $0.091 and $0.0947.
Each attempt to push higher has been met with immediate resistance at $0.0947, while pullbacks continue to find support around $0.091, creating a balanced but fragile structure, where price remains stable on the surface but increasingly tense underneath.
Profit-taking pressure keeps bulls in check
A key factor limiting DOGE’s upside momentum is consistent profit-taking near local highs.
Over the past trading sessions, price has repeatedly failed to hold above $0.094–$0.095, with every move into this zone triggering selling and pushing price back toward the mid-range near $0.092.
This behaviour is reinforced by the broader weekly structure.
Despite minor gains of around 1% over the past 7 days, DOGE remains largely unchanged across longer timeframes, with only +0.8% over 30 days.
This lack of trend continuation suggests that buyers are not committing beyond short-term trades.
On top of that, derivatives positioning has added scepticism to the upside.
The presence of notable short positions in the market shows that some traders are actively betting against sustained rallies.
This does not guarantee downside movement, but it does explain why upward pushes struggle to build momentum.
Compression builds as technical structure tightens
From a technical perspective, DOGE is clearly in a compression phase.
The 24-hour range of roughly $0.091 to $0.0947, combined with a 7-day range of just over $0.089 to $0.095, highlights how tightly the price is coiling.
This structure aligns with a descending triangle pattern, where lower highs continue to form while support remains anchored near the $0.089–$0.090 zone.

At the same time, price is also trading inside a broader Ichimoku cloud on the 4-hour chart, which typically signals indecision and equilibrium rather than a trending market.
These overlapping structures matter because they all point to the same conclusion: volatility is being compressed.
When multiple technical signals converge like this, the market often prepares for a sharp expansion move.
However, direction remains undefined until either support or resistance breaks convincingly.
Liquidity positioning and the “Doge Day” factor
Beyond chart structure, short-term market dynamics are also shaping sentiment.
Robinhood transferred 327 million DOGE (valued at about $30 million) from cold storage to hot wallets on April 9.
While this is not direct buying pressure, it is widely interpreted as preparation for increased trading activity.
This timing is notable as it coincides with growing attention toward the upcoming “Doge Day” period around April 20.
Historically, these events tend to increase retail participation and short-term volatility, even if they do not always produce sustained trends.
At the same time, broader crypto conditions have provided only mild support.
Bitcoin’s modest gains have helped stabilise sentiment across the market, but DOGE has not shown strong independent momentum. Instead, it continues to trade within its own compressed structure.
Key Dogecoin price levels that will define the next move
For now, DOGE remains in a consolidation phase where patience matters more than prediction.
Once price finally breaks out of the current range, the move is likely to be fast, sharp, and decisive, simply because the market has already spent days building pressure without releasing it.
As the market awaits the next move, the most important DOGE price level for traders remains the $0.09 psychological support zone.
Dogecoin price has held above this level consistently, and any sustained breakdown below $0.089 would mark a clear shift in structure.
Below that, the next area of interest sits near $0.088, where previous accumulation has occurred.
On the upside, resistance remains firmly in place between $0.094 and $0.095.
A daily close above $0.095 would be an important technical signal, suggesting that buyers are finally absorbing overhead supply.
If that happens, the next potential target would be the $0.104 region, which marks a previous local high.
Dogecoin price analysis: profit-taking stalls rally attempts as breakout setup forms CoinJournal
Source link ]]>
Dogecoin Price Prediction: DOGE at $0.092 Attempts $0.10 as openPR.com
Source link ]]>
Cardano Price Prediction: Pepeto’s Final Stretch Heats Up as the Binance Listing Approaches and ADA Attempts a Comeback CoinCentral
Source link ]]>
Cardano Price Prediction: DeepSnitch AI’s Final Stretch Heats Up as March 31 Approaches, ADA Attempts Comeback, Hype Remains Stable Blockonomi
Source link ]]>
Shiba Inu (SHIB) Attempts Recovery While Mutuum Finance (MUTM) Advances DeFi Utility openPR.com
Source link ]]>
Bitcoin price failed to stay above $65,000 and dipped further. BTC is now recovering losses from $62,500 and faces hurdles near the $66,500 zone.
- Bitcoin started a fresh decline and traded below the $65,000 support.
- The price is trading below $66,500 and the 100 hourly simple moving average.
- There is a bearish trend line forming with resistance at $66,600 on the hourly chart of the BTC/USD pair (data feed from Kraken).
- The pair might dip again if it trades below the $65,500 and $65,000 levels.
Bitcoin Price Recovers Some Ground
Bitcoin price failed to remain stable above the $66,000 zone. BTC started a fresh decline and traded below the $65,000 support zone. There was a push below $64,000.
The price even spiked below $63,000. A low was formed at $62,500, and the price is now correcting some losses. There was a move above $65,000 and the 50% Fib retracement level of the recent decline from the $68,654 swing high to the $62,500 low.
Bitcoin is now trading below $66,500 and the 100 hourly simple moving average. If the price remains stable above $65,000, it could attempt a fresh increase. Immediate resistance is near the $66,500 level. There is also a bearish trend line forming with resistance at $66,600 on the hourly chart of the BTC/USD pair.
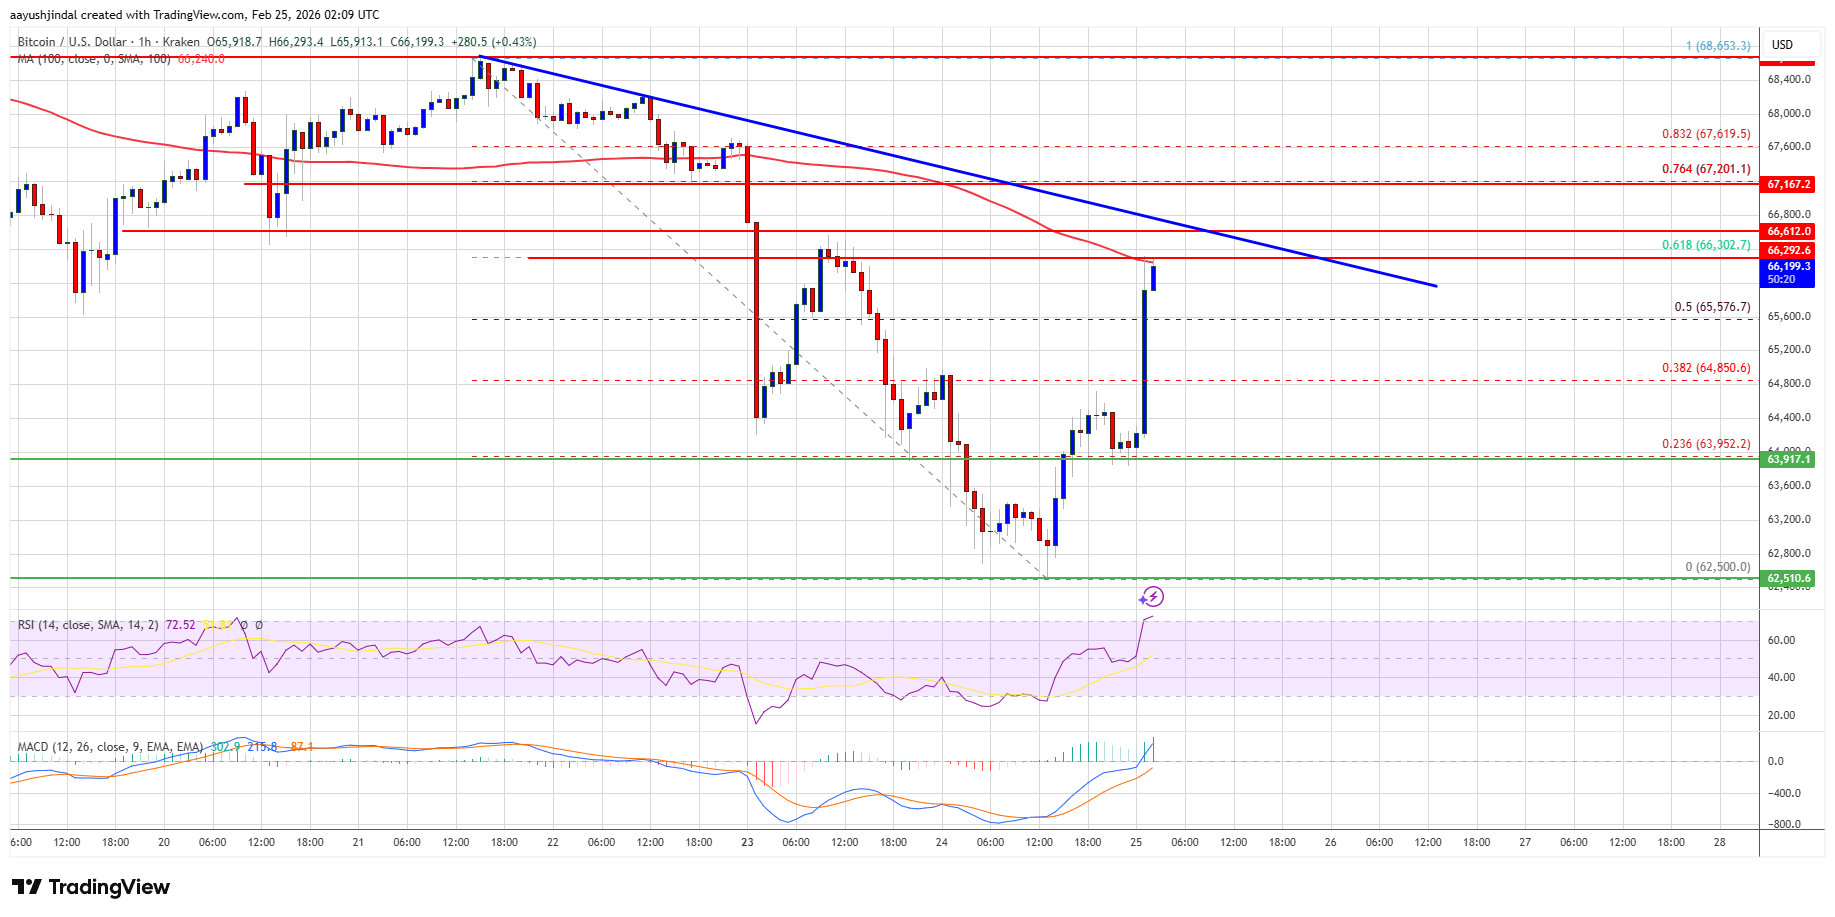
The first key resistance is near the $67,200 level or the 76.4% Fib retracement level of the recent decline from the $68,654 swing high to the $62,500 low. A close above the $67,200 resistance might send the price further higher. In the stated case, the price could rise and test the $68,000 resistance. Any more gains might send the price toward the $68,800 level. The next barrier for the bulls could be $69,200 and $69,500.
Another Decline In BTC?
If Bitcoin fails to rise above the $66,500 resistance zone, it could start another decline. Immediate support is near the $65,500 level. The first major support is near the $65,000 level.
The next support is now near the $64,200 zone. Any more losses might send the price toward the $63,500 support in the near term. The main support now sits at $62,500, below which BTC might struggle to recover in the near term.
Technical indicators:
Hourly MACD – The MACD is now gaining pace in the bullish zone.
Hourly RSI (Relative Strength Index) – The RSI for BTC/USD is now above the 50 level.
Major Support Levels – $65,500, followed by $65,000.
Major Resistance Levels – $66,500 and $67,200.
Cardano Price Prediction: ADA Sees Decline While BlackRock Attempts First DeFi Move With Uniswap But DeepSnitch AI Continues To Dominate Headlines As Presale Gains Near $1.6M BlockchainReporter
Source link ]]>
Bitcoin price extended its decline below $78,000. BTC is now attempting to recover from $74,500 but faces many hurdles near $80,000.
- Bitcoin is attempting to recover above $77,000 and $78,000.
- The price is trading below $80,000 and the 100 hourly simple moving average.
- There was a break above a bearish trend line with resistance at $78,400 on the hourly chart of the BTC/USD pair (data feed from Kraken).
- The pair might dip again if it trades below the $77,000 and $76,000 levels.
Bitcoin Price Faces Resistance
Bitcoin price failed to remain stable above the $82,000 zone. BTC extended its decline below the $80,000 and $79,500 levels. The bears were able to push the price below $78,000.
It spared major bearish moves, pushing the price below $76,000. A low was formed at $74,543, and the price is now attempting to recover. There was a move above $78,000. The price surpassed the 23.6% Fib retracement level of the downward move from the $90,440 swing high to the $74,543 low.
Besides, there was a break above a bearish trend line with resistance at $78,400 on the hourly chart of the BTC/USD pair. Bitcoin is now trading below $80,000 and the 100 hourly simple moving average.
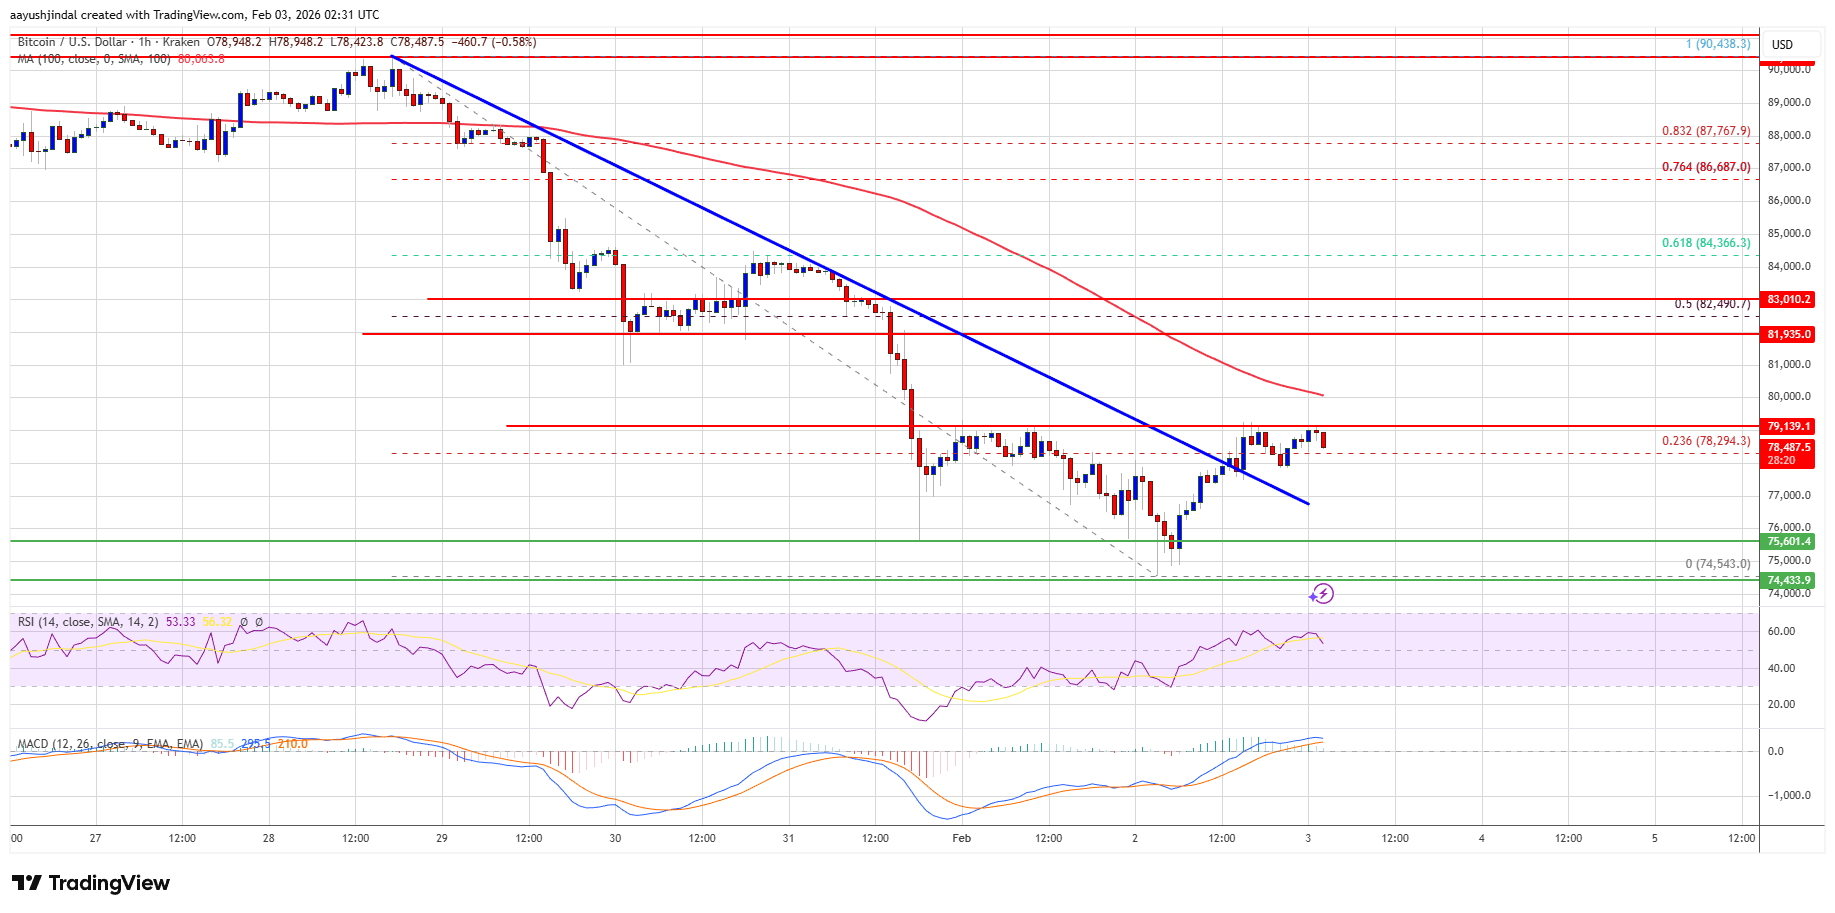
If the price remains stable above $77,000, it could attempt a fresh increase. Immediate resistance is near the $79,200 level. The first key resistance is near the $80,000 level. A close above the $80,000 resistance might send the price further higher. In the stated case, the price could rise and test the $82,500 resistance or the 50% Fib retracement level of the downward move from the $90,440 swing high to the $74,543 low. Any more gains might send the price toward the $84,000 level. The next barrier for the bulls could be $85,000 and $85,500.
Another Decline In BTC?
If Bitcoin fails to rise above the $79,200 resistance zone, it could start another decline. Immediate support is near the $78,000 level. The first major support is near the $77,000 level.
The next support is now near the $76,000 zone. Any more losses might send the price toward the $74,500 support in the near term. The main support sits at $72,000, below which BTC might struggle to recover in the near term.
Technical indicators:
Hourly MACD – The MACD is now losing pace in the bearish zone.
Hourly RSI (Relative Strength Index) – The RSI for BTC/USD is now above the 50 level.
Major Support Levels – $77,000, followed by $76,000.
Major Resistance Levels – $79,200 and $80,000.
Bitcoin price started a recovery wave from $86,000. BTC is slowly moving higher and might rise further if it clears $89,500.
- Bitcoin started a minor recovery wave from the $86,000 level.
- The price is trading near $88,500 and the 100 hourly simple moving average.
- There was a break above a bearish trend line with resistance at $88,000 on the hourly chart of the BTC/USD pair (data feed from Kraken).
- The pair might recover if it manages to settle above $88,800 and $89,500.
Bitcoin Price Attempts Rebound
Bitcoin price extended losses and traded below the $87,200 support. BTC even declined below $86,500 before the bulls appeared. A low was formed at $86,007, and the price is now attempting a recovery wave.
The price climbed above the $87,000 and $87,500 levels. There was a move above the 50% Fib retracement level of the downward move from the $91,099 swing high to the $86,007 low. Besides, there was a break above a bearish trend line with resistance at $88,000 on the hourly chart of the BTC/USD pair.
Bitcoin is now trading near $88,500 and the 100 hourly simple moving average. If the price remains stable above $87,500, it could attempt a fresh increase. Immediate resistance is near the $88,800 level.
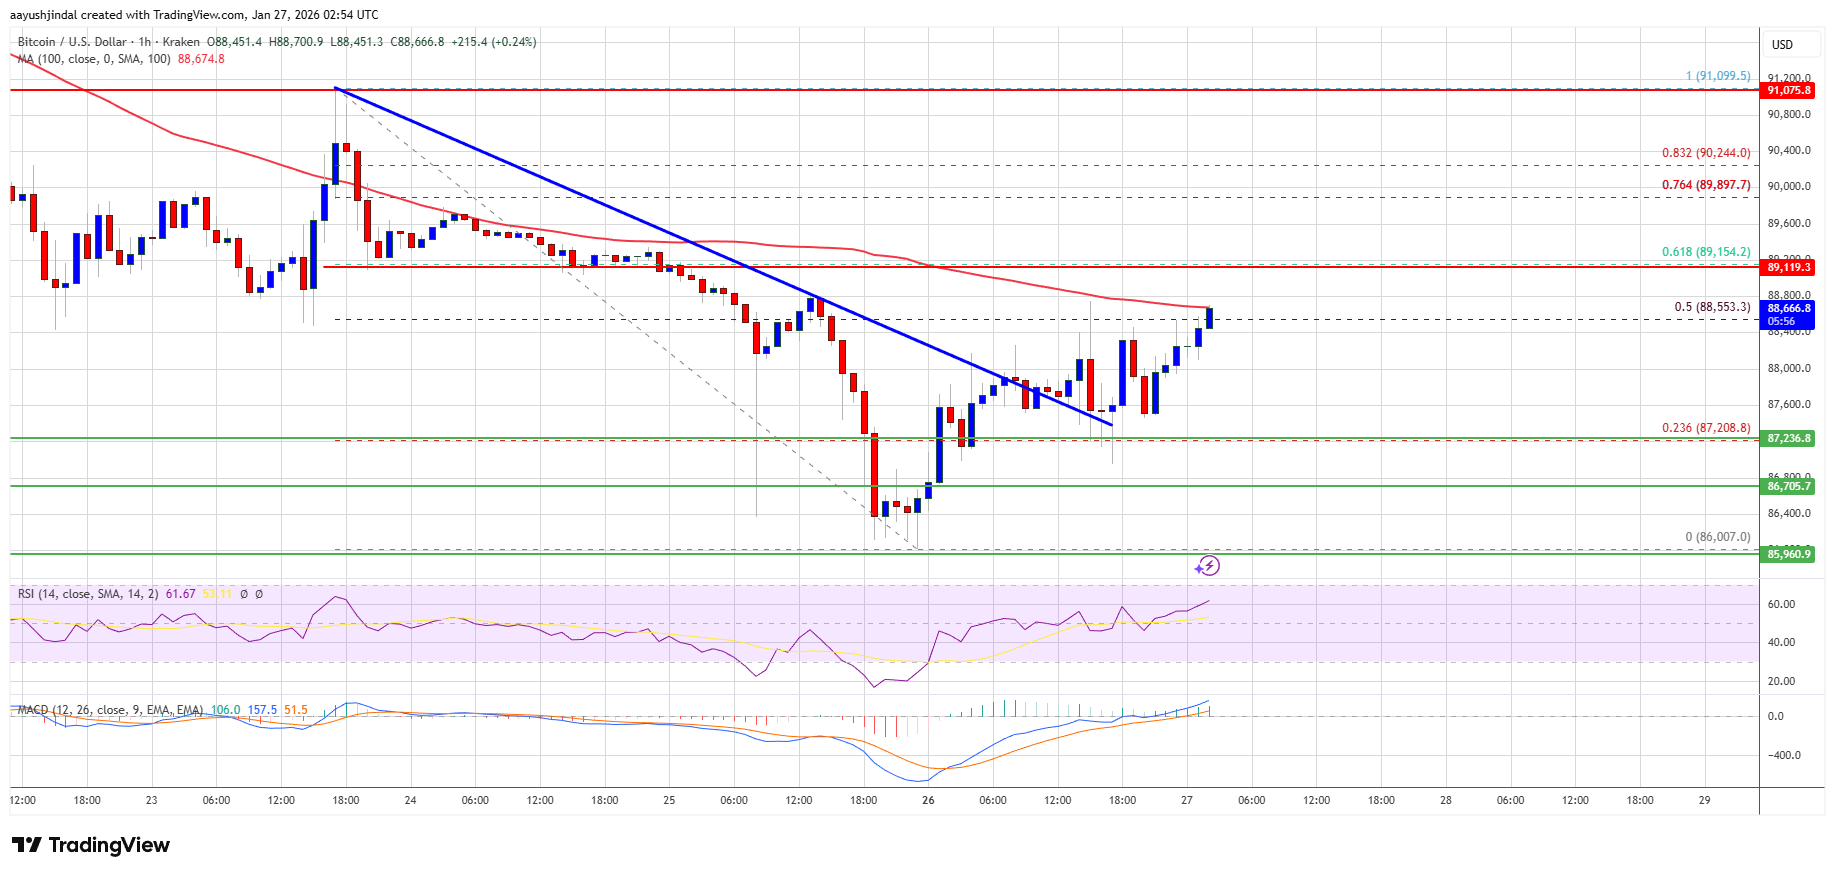
The first key resistance is near the $89,150 level since it is close to the 61.8% Fib retracement level of the downward move from the $91,099 swing high to the $86,007 low. A close above the $89,150 resistance might send the price further higher. In the stated case, the price could rise and test the $89,500 resistance. Any more gains might send the price toward the $90,000 level. The next barrier for the bulls could be $91,000 and $91,500.
Another Decline In BTC?
If Bitcoin fails to rise above the $88,800 resistance zone, it could start another decline. Immediate support is near the $88,000 level. The first major support is near the $87,200 level.
The next support is now near the $86,700 zone. Any more losses might send the price toward the $86,200 support in the near term. The main support sits at $86,000, below which BTC might struggle to recover in the near term.
Technical indicators:
Hourly MACD – The MACD is now gaining pace in the bullish zone.
Hourly RSI (Relative Strength Index) – The RSI for BTC/USD is now above the 50 level.
Major Support Levels – $88,000, followed by $87,200.
Major Resistance Levels – $88,800 and $89,500.