Bitcoin has been moving sideways, and traders are starting to lose patience. The world’s largest cryptocurrency couldn’t hold recent highs, sparking talk about whether the market is bracing for a sharper swing. Some analysts say the pause is normal, others warn it could be the calm before the storm.
Related Reading
Traders Watch Price Levels Closely
Popular market watcher Daan Crypto Trades pointed out that Bitcoin’s struggle to pick a direction isn’t unusual. He noted the coin has been locked between support and resistance zones, with neither bulls nor bears taking control. It’s the kind of setup that often leads to big moves once one side gives in.
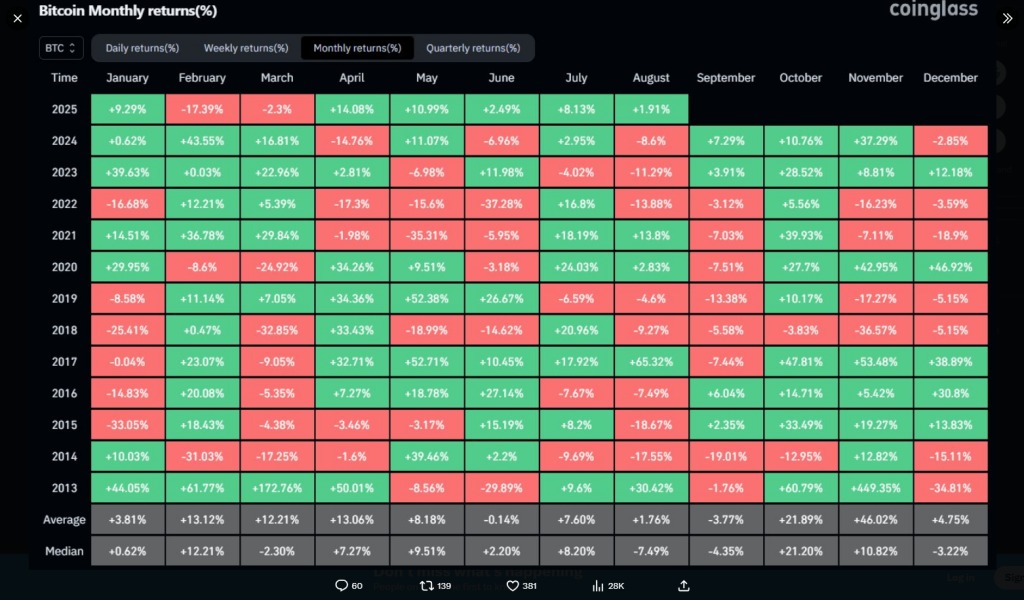
$BTC August has been pretty uneventful for Bitcoin so far. We’ve seen some movement but no clear direction as price consolidates in this current range.
Never in history, has BTC seen both a green August and September. We tend to see a quick flush followed by an explosive Q4 in… pic.twitter.com/cClxJUG6Vh
— Daan Crypto Trades (@DaanCrypto) August 17, 2025
Meanwhile, technical evidence sends mixed signals. By September 16, 2025, Bitcoin will reportedly hit at least $130,266, which is a 13.07% increase compared to the previous prediction.
The Fear & Greed Index is currently at 60, indicating that greed is on the menu, while sentiment indicators are neutral.
In the last 30 days, Bitcoin had 14 green sessions out of 30, and the average performance remained on the positive at 1.63%. That isn’t extreme, but it does indicate that traders are being cautious.
Analysts Split On What’s Next
There are a few investors who believe the current lull is nothing but a breather before another rally. They say that buying interest remains high, particularly with long-term demand coming from institutions.
Skeptics, however, believe the latest rejection at higher levels is a sign of weakness and that another pullback opportunity has opened up.
Jitters in the marketplace always invite disorientation, and this moment is no exception. A 13% gain sounds exciting, but sentiment may change in a heartbeat if the Bitcoin price loses the entire support level.
Traders are keen to see if momentum will pick up or if the sideways chop will continue.
Related Reading
Is It A Good Time To Buy?
Based on technical indicators, reports suggest it may still be a decent entry point. But timing is tricky. With price forecasts pointing toward $130K and resistance overhead, the next few weeks could decide the short-term trend.
Some see this as a chance to accumulate, while others would rather wait for a clearer breakout.
For now, Bitcoin sits in limbo. Traders are scanning the charts, looking for clues on whether the path to $135K is still alive — or if the market is setting up for another surprise.
Featured image from Adobe Stock, chart from TradingView
XRP price started a fresh decline below the $2.080 zone. The price is now recovering some losses and might face hurdles near the $2.150 level.
- XRP price started a fresh decline after it failed to clear the $2.20 resistance zone.
- The price is now trading below $2.120 and the 100-hourly Simple Moving Average.
- There is a connecting bearish trend line forming with resistance at $2.10 on the hourly chart of the XRP/USD pair (data source from Kraken).
- The pair might extend losses if it fails to clear the $2.150 resistance zone.
XRP Price Faces Resistance
XRP price failed to continue higher above the $2.20 resistance zone and reacted to the downside, like Bitcoin and Ethereum. The price declined below the $2.150 and $2.10 levels.
The pair even declined below the $2.050 zone. A low was formed at $2.023 and the price is now attempting a recovery wave. There was a move above the $2.050 level. The price cleared the 23.6% Fib retracement level of the recent decline from the $2.215 swing high to the $2.023 low.
The price is now trading below $2.120 and the 100-hourly Simple Moving Average. On the upside, the price might face resistance near the $2.10 level. There is also a connecting bearish trend line forming with resistance at $2.10 on the hourly chart of the XRP/USD pair. The trend line is near the 50% Fib retracement level of the recent decline from the $2.215 swing high to the $2.023 low.

The first major resistance is near the $2.150 level. The next resistance is $2.1680. A clear move above the $2.1680 resistance might send the price toward the $2.20 resistance. Any more gains might send the price toward the $2.220 resistance or even $2.250 in the near term. The next major hurdle for the bulls might be $2.2880.
Another Decline?
If XRP fails to clear the $2.120 resistance zone, it could start another decline. Initial support on the downside is near the $2.050 level. The next major support is near the $2.020 level.
If there is a downside break and a close below the $2.020 level, the price might continue to decline toward the $2.00 support. The next major support sits near the $1.880 zone.
Technical Indicators
Hourly MACD – The MACD for XRP/USD is now losing pace in the bearish zone.
Hourly RSI (Relative Strength Index) – The RSI for XRP/USD is now above the 50 level.
Major Support Levels – $2.050 and $2.020.
Major Resistance Levels – $2.120 and $2.150.
]]>