Bitcoin price started a recovery wave above $70,000. BTC is now consolidating above $70,200 and might aim for a steady increase if it clears $71,650.
- Bitcoin started a decent recovery wave above $69,800 and $70,200.
- The price is trading above $70,200 and the 100 hourly simple moving average.
- There is a bullish trend line forming with support at $70,400 on the hourly chart of the BTC/USD pair (data feed from Kraken).
- The pair might start another decline if it stays below the $71,000 and $71,650 levels.
Bitcoin Price Faces Hurdles
Bitcoin price started a recovery wave above the $69,5500 resistance level. BTC climbed above the $70,200 and $70,500 resistance levels.
The price even spiked above the 50% Fib retracement level of the downward move from the $75,998 swing high to the $67,342 low. The price even climbed toward the $72,000 zone before the bears took a stand and protected more gains.
Bitcoin is now trading above $70,200 and the 100 hourly simple moving average. There is also a bullish trend line forming with support at $70,400 on the hourly chart of the BTC/USD pair.
If the price remains stable above $70,200, it could attempt a fresh increase. Immediate resistance is near the $71,200 level. The first key resistance is near the $71,650 level. A close above the $71,650 resistance might send the price further higher.
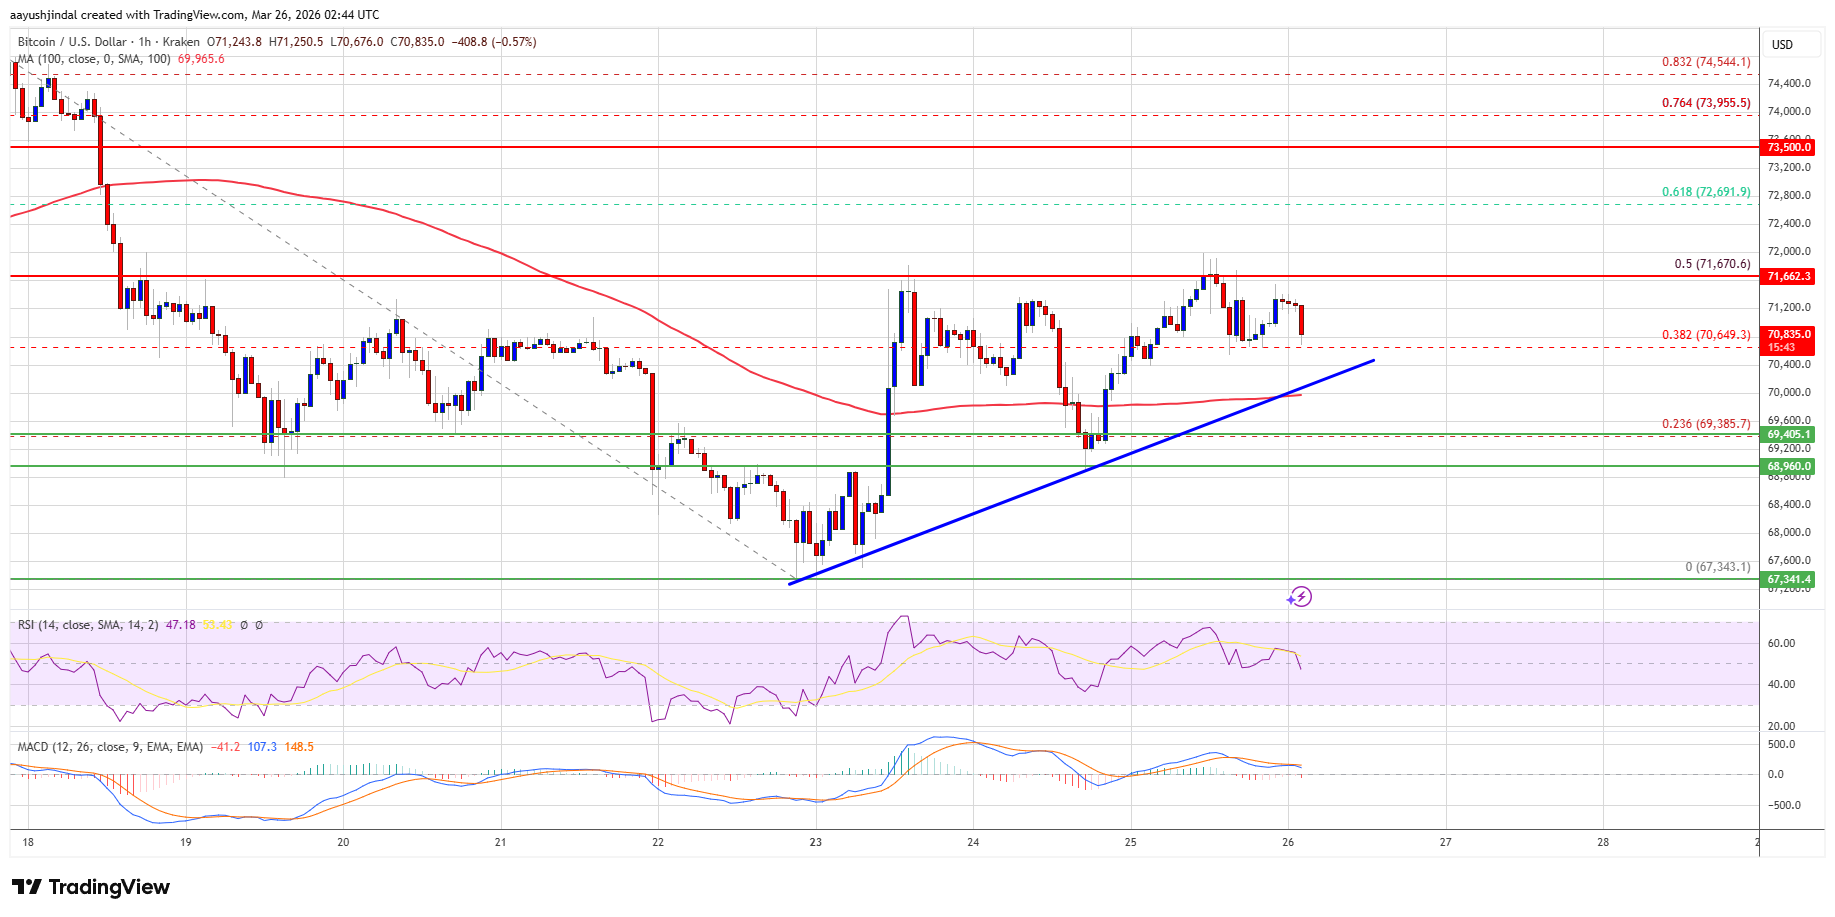
In the stated case, the price could rise and test the $72,650 resistance or the 61.8% Fib retracement level of the downward move from the $75,998 swing high to the $67,342 low. Any more gains might send the price toward the $73,200 level. The next barrier for the bulls could be $73,500.
Another Decline In BTC?
If Bitcoin fails to rise above the $71,650 resistance zone, it could start another decline. Immediate support is near the $70,400 level. The first major support is near the $70,000 level.
The next support is now near the $69,200 zone. Any more losses might send the price toward the $68,800 support in the near term. The main support now sits at $67,500, below which BTC might struggle to recover in the near term.
Technical indicators:
Hourly MACD – The MACD is now losing pace in the bullish zone.
Hourly RSI (Relative Strength Index) – The RSI for BTC/USD is now below the 50 level.
Major Support Levels – $70,000, followed by $69,200.
Major Resistance Levels – $71,200 and $71,650.
Cardano: The Only Chain Without Validator Barriers Live Bitcoin News
Source link ]]>
Ethereum price failed to stay above $2,800 and tested $2,620. ETH is now attempting to recover but faces resistance near $2,890.
- Ethereum started a fresh decline after it failed to stay above $2,800.
- The price is trading near $2,840 and the 100-hourly Simple Moving Average.
- There is a key bearish trend line forming with resistance at $2,960 on the hourly chart of ETH/USD (data feed via Kraken).
- The pair could continue to move down if it settles below the $2,720 zone.
Ethereum Price Attempts Recovery
Ethereum price failed to continue higher above $3,000 and started a fresh decline, like Bitcoin. ETH price dipped below $2,880 and entered a bearish zone.
The decline gathered pace below $2,800 and the price dipped below $2,700. A low was formed at $2,621 and the price is now attempting to recover. There was a move above the 23.6% Fib retracement level of the recent decline from the $3,058 swing high to the $2,621 low.
Ethereum price is now trading near $2,840 and the 100-hourly Simple Moving Average. If there is another recovery wave, the price could face resistance near the $2,890 level and the 61.8% Fib retracement level of the recent decline from the $3,058 swing high to the $2,621 low.
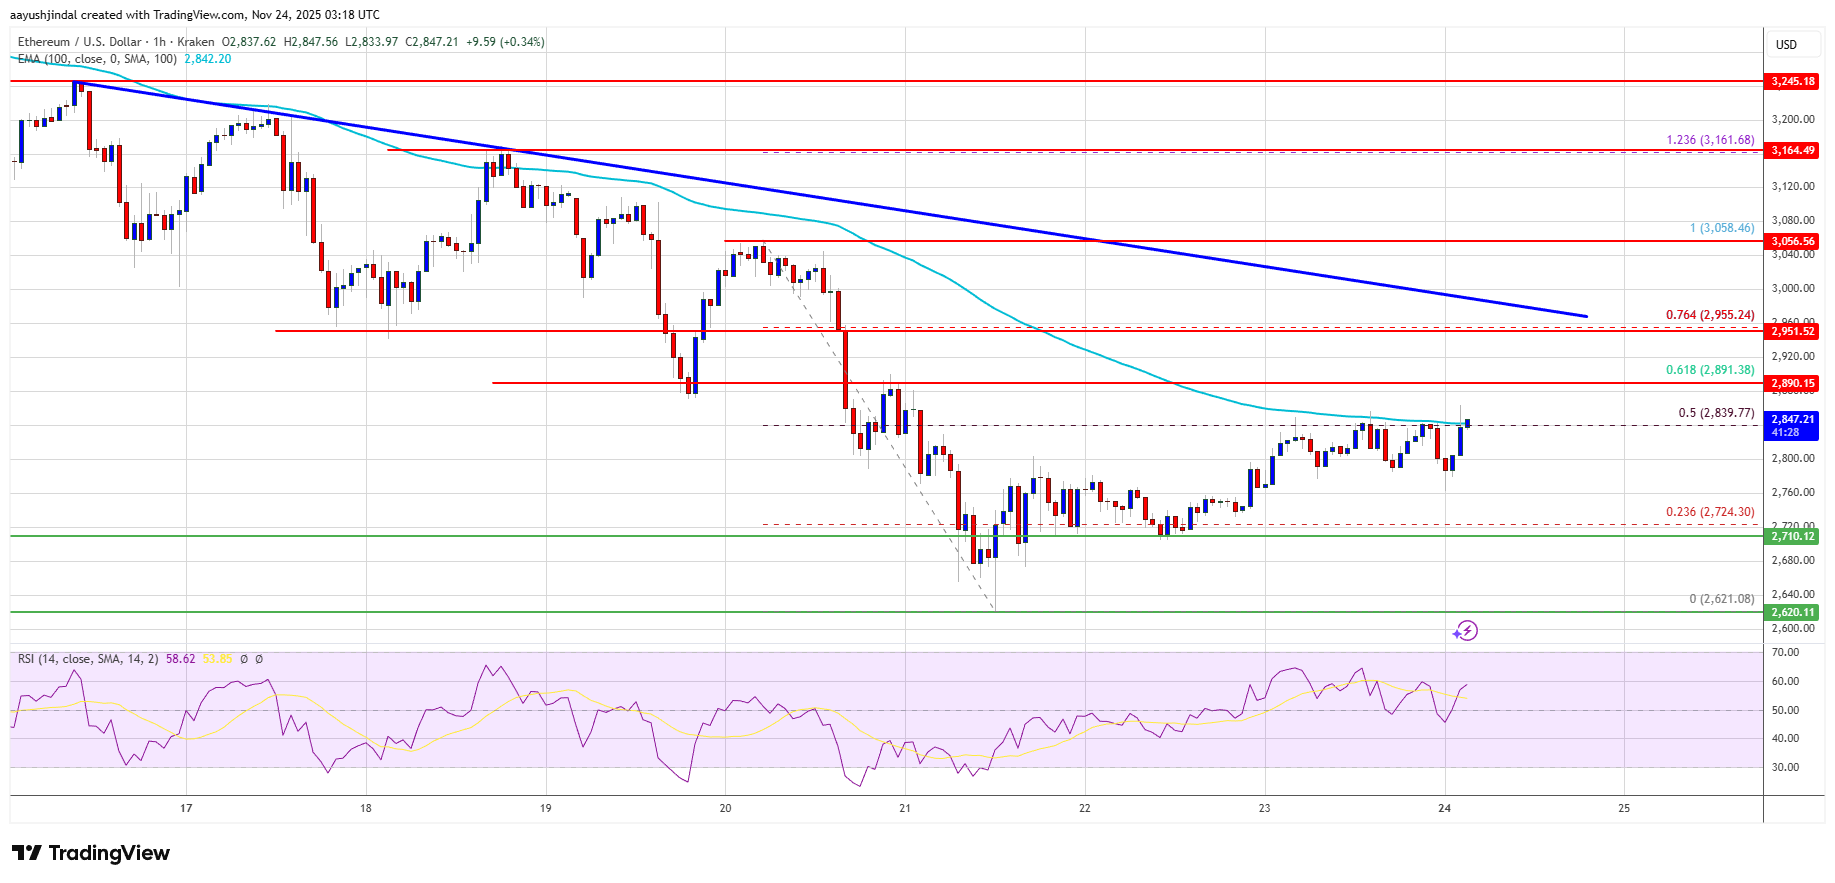
The next key resistance is near the $2,920 level. The first major resistance is near the $2,950 level. There is also a key bearish trend line forming with resistance at $2,960 on the hourly chart of ETH/USD. A clear move above the $2,960 resistance might send the price toward the $3,020 resistance. An upside break above the $3,020 region might call for more gains in the coming days. In the stated case, Ether could rise toward the $3,120 resistance zone or even $3,250 in the near term.
Another Drop In ETH?
If Ethereum fails to clear the $2,890 resistance, it could start a fresh decline. Initial support on the downside is near the $2,800 level. The first major support sits near the $2,720 zone.
A clear move below the $2,720 support might push the price toward the $2,650 support. Any more losses might send the price toward the $2,620 region in the near term. The next key support sits at $2,550 and $2,500.
Technical Indicators
Hourly MACD – The MACD for ETH/USD is losing momentum in the bearish zone.
Hourly RSI – The RSI for ETH/USD is now above the 50 zone.
Major Support Level – $2,720
Major Resistance Level – $2,890
XRP and Cardano Face Barriers While BlockDAG Raises $435 Million NFT Plazas
Source link ]]>
Aayush Jindal, a luminary in the world of financial markets, whose expertise spans over 15 illustrious years in the realms of Forex and cryptocurrency trading. Renowned for his unparalleled proficiency in providing technical analysis, Aayush is a trusted advisor and senior market expert to investors worldwide, guiding them through the intricate landscapes of modern finance with his keen insights and astute chart analysis.
From a young age, Aayush exhibited a natural aptitude for deciphering complex systems and unraveling patterns. Fueled by an insatiable curiosity for understanding market dynamics, he embarked on a journey that would lead him to become one of the foremost authorities in the fields of Forex and crypto trading. With a meticulous eye for detail and an unwavering commitment to excellence, Aayush honed his craft over the years, mastering the art of technical analysis and chart interpretation.
As a software engineer, Aayush harnesses the power of technology to optimize trading strategies and develop innovative solutions for navigating the volatile waters of financial markets. His background in software engineering has equipped him with a unique skill set, enabling him to leverage cutting-edge tools and algorithms to gain a competitive edge in an ever-evolving landscape.
In addition to his roles in finance and technology, Aayush serves as the director of a prestigious IT company, where he spearheads initiatives aimed at driving digital innovation and transformation. Under his visionary leadership, the company has flourished, cementing its position as a leader in the tech industry and paving the way for groundbreaking advancements in software development and IT solutions.
Despite his demanding professional commitments, Aayush is a firm believer in the importance of work-life balance. An avid traveler and adventurer, he finds solace in exploring new destinations, immersing himself in different cultures, and forging lasting memories along the way. Whether he’s trekking through the Himalayas, diving in the azure waters of the Maldives, or experiencing the vibrant energy of bustling metropolises, Aayush embraces every opportunity to broaden his horizons and create unforgettable experiences.
Aayush’s journey to success is marked by a relentless pursuit of excellence and a steadfast commitment to continuous learning and growth. His academic achievements are a testament to his dedication and passion for excellence, having completed his software engineering with honors and excelling in every department.
At his core, Aayush is driven by a profound passion for analyzing markets and uncovering profitable opportunities amidst volatility. Whether he’s poring over price charts, identifying key support and resistance levels, or providing insightful analysis to his clients and followers, Aayush’s unwavering dedication to his craft sets him apart as a true industry leader and a beacon of inspiration to aspiring traders around the globe.
In a world where uncertainty reigns supreme, Aayush Jindal stands as a guiding light, illuminating the path to financial success with his unparalleled expertise, unwavering integrity, and boundless enthusiasm for the markets.
Ethereum price started a recovery wave from the $4,050 zone. ETH is now back above $4,220 but it faces many hurdles near $4,400.
- Ethereum started a recovery wave above the $4,150 and $4,220 levels.
- The price is trading below $4,350 and the 100-hourly Simple Moving Average.
- There is a bearish trend line forming with resistance at $4,355 on the hourly chart of ETH/USD (data feed via Kraken).
- The pair could continue to move down if it settles below the $4,220 zone in the near term.
Ethereum Price Faces Resistance
Ethereum price extended losses after there was a close below the $4,250 level, like Bitcoin. ETH price gained bearish momentum and traded below the $4,150 support zone.
The bears were able to push the price below the $4,120 support zone. Finally, the price tested the $4,065 zone. A low was formed at $4,065 and the price recently started a recovery wave above the 23.6% Fib retracement level of the recent decline from the $4,580 swing high to the $4,065 low.
However, the bears are active near the $4,350 zone and the 61.8% Fib retracement level of the recent decline from the $4,580 swing high to the $4,065 low. There is also a bearish trend line forming with resistance at $4,355 on the hourly chart of ETH/USD.
Ethereum price is now trading below $4,355 and the 100-hourly Simple Moving Average. On the upside, the price could face resistance near the $4,350 level. The next key resistance is near the $4,380 level.

The first major resistance is near the $4,460 level. A clear move above the $4,460 resistance might send the price toward the $4,500 resistance. An upside break above the $4,500 resistance might call for more gains in the coming sessions. In the stated case, Ether could rise toward the $4,550 resistance zone or even $4,565 in the near term.
Another Decline In ETH?
If Ethereum fails to clear the $4,380 resistance, it could continue to move down. Initial support on the downside is near the $4,240 level. The first major support sits near the $4,200 zone.
A clear move below the $4,200 support might push the price toward the $4,120 support. Any more losses might send the price toward the $4,050 support level in the near term. The next key support sits at $4,000.
Technical Indicators
Hourly MACD – The MACD for ETH/USD is losing momentum in the bearish zone.
Hourly RSI – The RSI for ETH/USD is now above the 50 zone.
Major Support Level – $4,220
Major Resistance Level – $4,380
Will Cardano (ADA) Break Through Barriers and Take Over Momentum? Pintu
Source link ]]>
Can Trending Shiba Inu (SHIB) Rival Rexas Finance (RXS) Break Barriers and Skyrocket 17088% ET Now
Source link ]]>
Shiba Inu Breaks Through Barriers, Set For Significant Surge To $0.0000246 TronWeekly
Source link ]]>
Dogecoin Breaks Barriers: Poised For A Massive 2x Surge TronWeekly
Source link ]]>