On-chain data shows the Ethereum MVRV ratio is currently testing a level that has historically served as the boundary between bear and bull markets.
Ethereum MVRV Ratio Is Retesting Its 180-Day SMA Right Now
The “Market Value to Realized Value (MVRV) ratio” is an indicator that measures the ratio between the Ethereum market cap and realized cap. The former is naturally just the total supply valuation at its spot price. At the same time, the latter is an on-chain capitalization model that calculates the value differently.
The realized cap assumes that the real value of any coin in circulation isn’t the spot price (which the market cap refers to) but the price at which it was last bought/transferred on the blockchain.
One way to look at the realized cap is that it represents the total amount of capital that the investors have put into the cryptocurrency, as it considers each holder’s cost basis or buying price.
Since the MVRV ratio compares these two capitalization models, it can tell us whether the investors hold more or less value than they initially invested in Ethereum.
The indicator’s usefulness is that it may serve as a way to determine whether the asset’s price is fair or not right now. When the investors hold a value significantly more than they put in (that is, they are in high profits), they would be more tempted to sell, and hence, the spot price could face a correction.
Similarly, the holders as a whole being in deep losses can instead be a signal that the bottom might be near for the cryptocurrency, as it’s becoming quite underpriced.
Now, here is a chart shared by analyst Ali on X, which shows the trend in the Ethereum MVRV ratio, as well as its 180-day simple moving average (SMA), over the past few years:
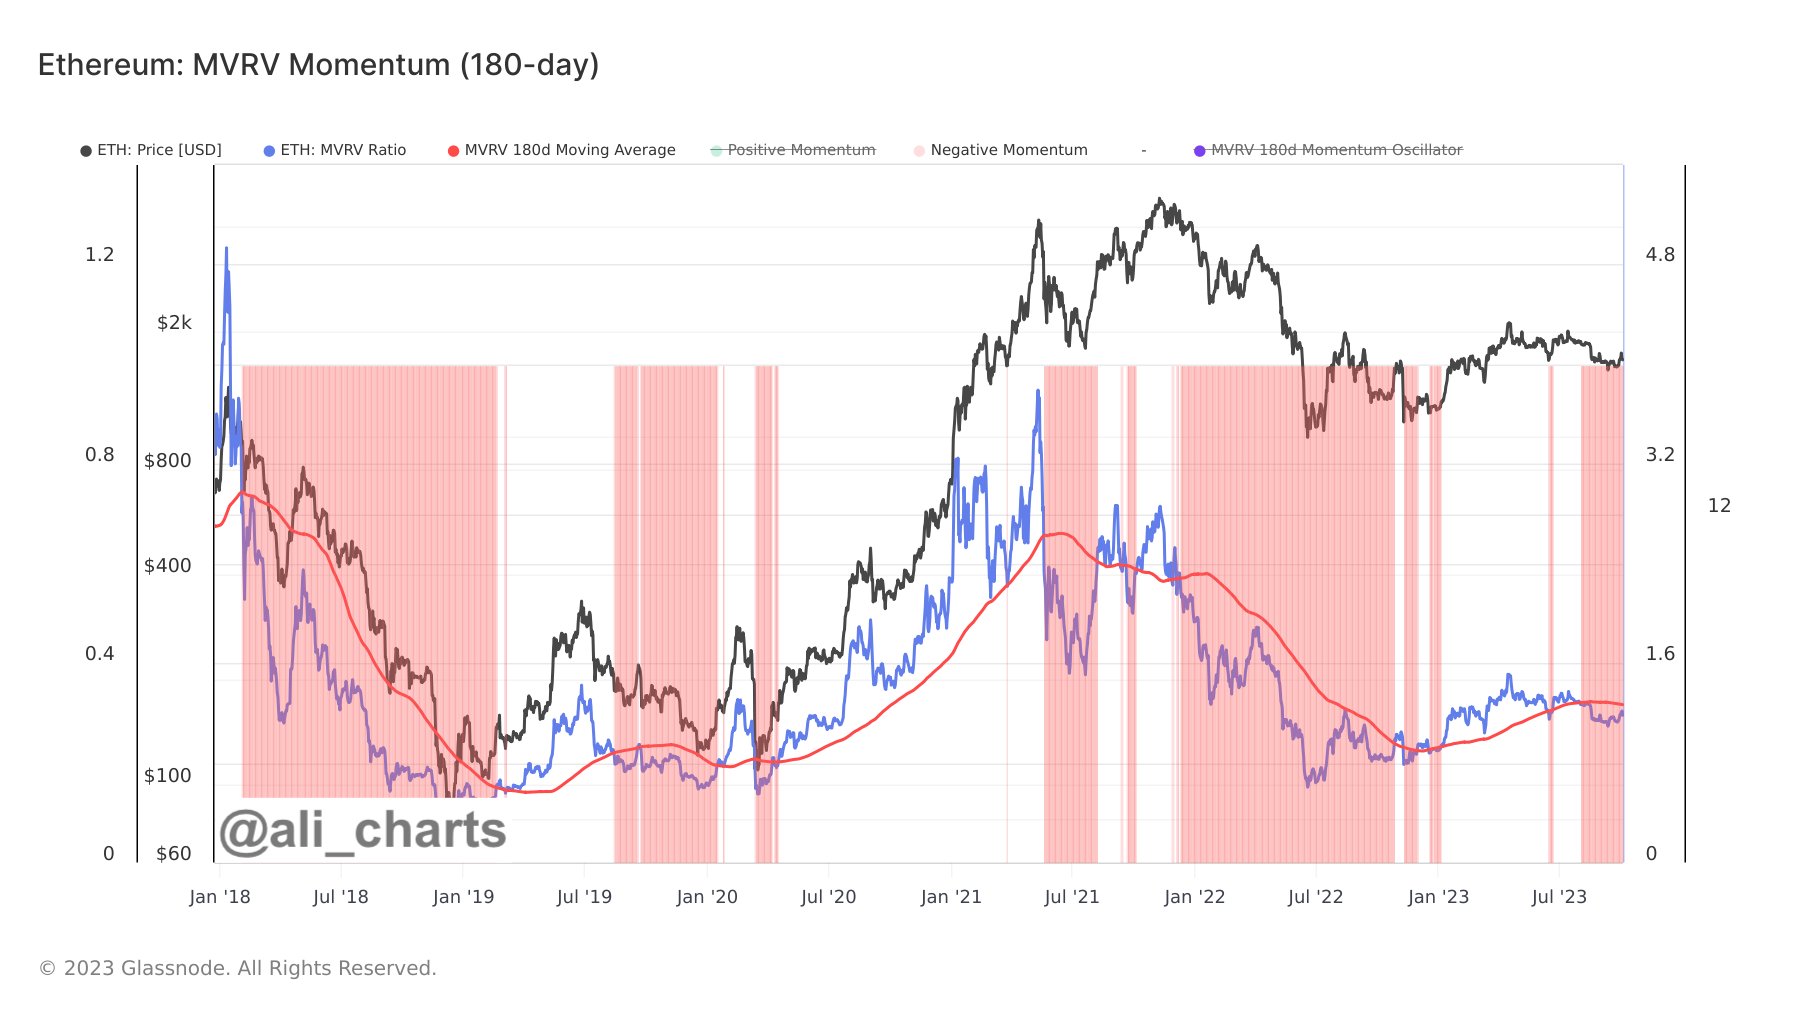
The value of the metric seems to have been going up in recent days | Source: @ali_charts on X
The 180-day SMA of the ETH MVRV ratio has interestingly held significance for the cryptocurrency. According to Ali, “Ethereum market cycles transition from bearish to bullish when the MVRV (blue line) breaks strongly above the MVRV 180-day SMA (red line).”
During the bear market last year, the ratio had been below the 180-day SMA line, but with the rally that began this year in January, the metric had managed to break above the level, and bullish winds supported the asset once more. During the recent struggle for the asset, however, the MVRV has again slipped under the level.
Nonetheless, in the past few days, the ETH MVRV has been trending up a bit and approaching another retest of this historical junction between bearish and bullish trends.
It remains to be seen whether a retest will happen in the coming days for Ethereum and if a break towards the bullish territory can be found.
ETH Price
Looks like ETH has been trending sideways in the past few days | Source: ETHUSD on TradingView
Featured image from Kanchanara on Unsplash.com, charts from TradingView.com, Glassnode.com
Data shows the Bitcoin Adjusted Spent Output Profit Ratio (aSOPR) is retesting the historical bull-bear junction. Will a break be found this time?
Bitcoin aSOPR Is Currently Doing Another Rest Of 1.0 Level
As per the latest weekly report from Glassnode, a successful retest here could suggest a meaningful regime shift in the BTC market. The “Spent Output Profit Ratio” (SOPR) is an indicator that tells us whether Bitcoin investors are selling their coins at a profit or at a loss right now.
When the value of this metric is greater than 1, it means the average holder in the market is moving coins at some profit currently. On the other hand, values below the threshold imply the overall market is realizing some loss at the moment. The SOPR being exactly equal to 1 naturally suggests that investors are just breaking even on their selling right now.
A modified version of this indicator is the “Adjusted SOPR” (aSOPR), which filters out all selling of coins that was done within only an hour of said coins being first acquired. The main advantage of this modification is that it removes noise from the data that wouldn’t have any noticeable impacts on the market anyways.
Now, here is a chart that shows the trend in the 7-day exponential moving average (EMA) Bitcoin aSOPR over the last couple of years:
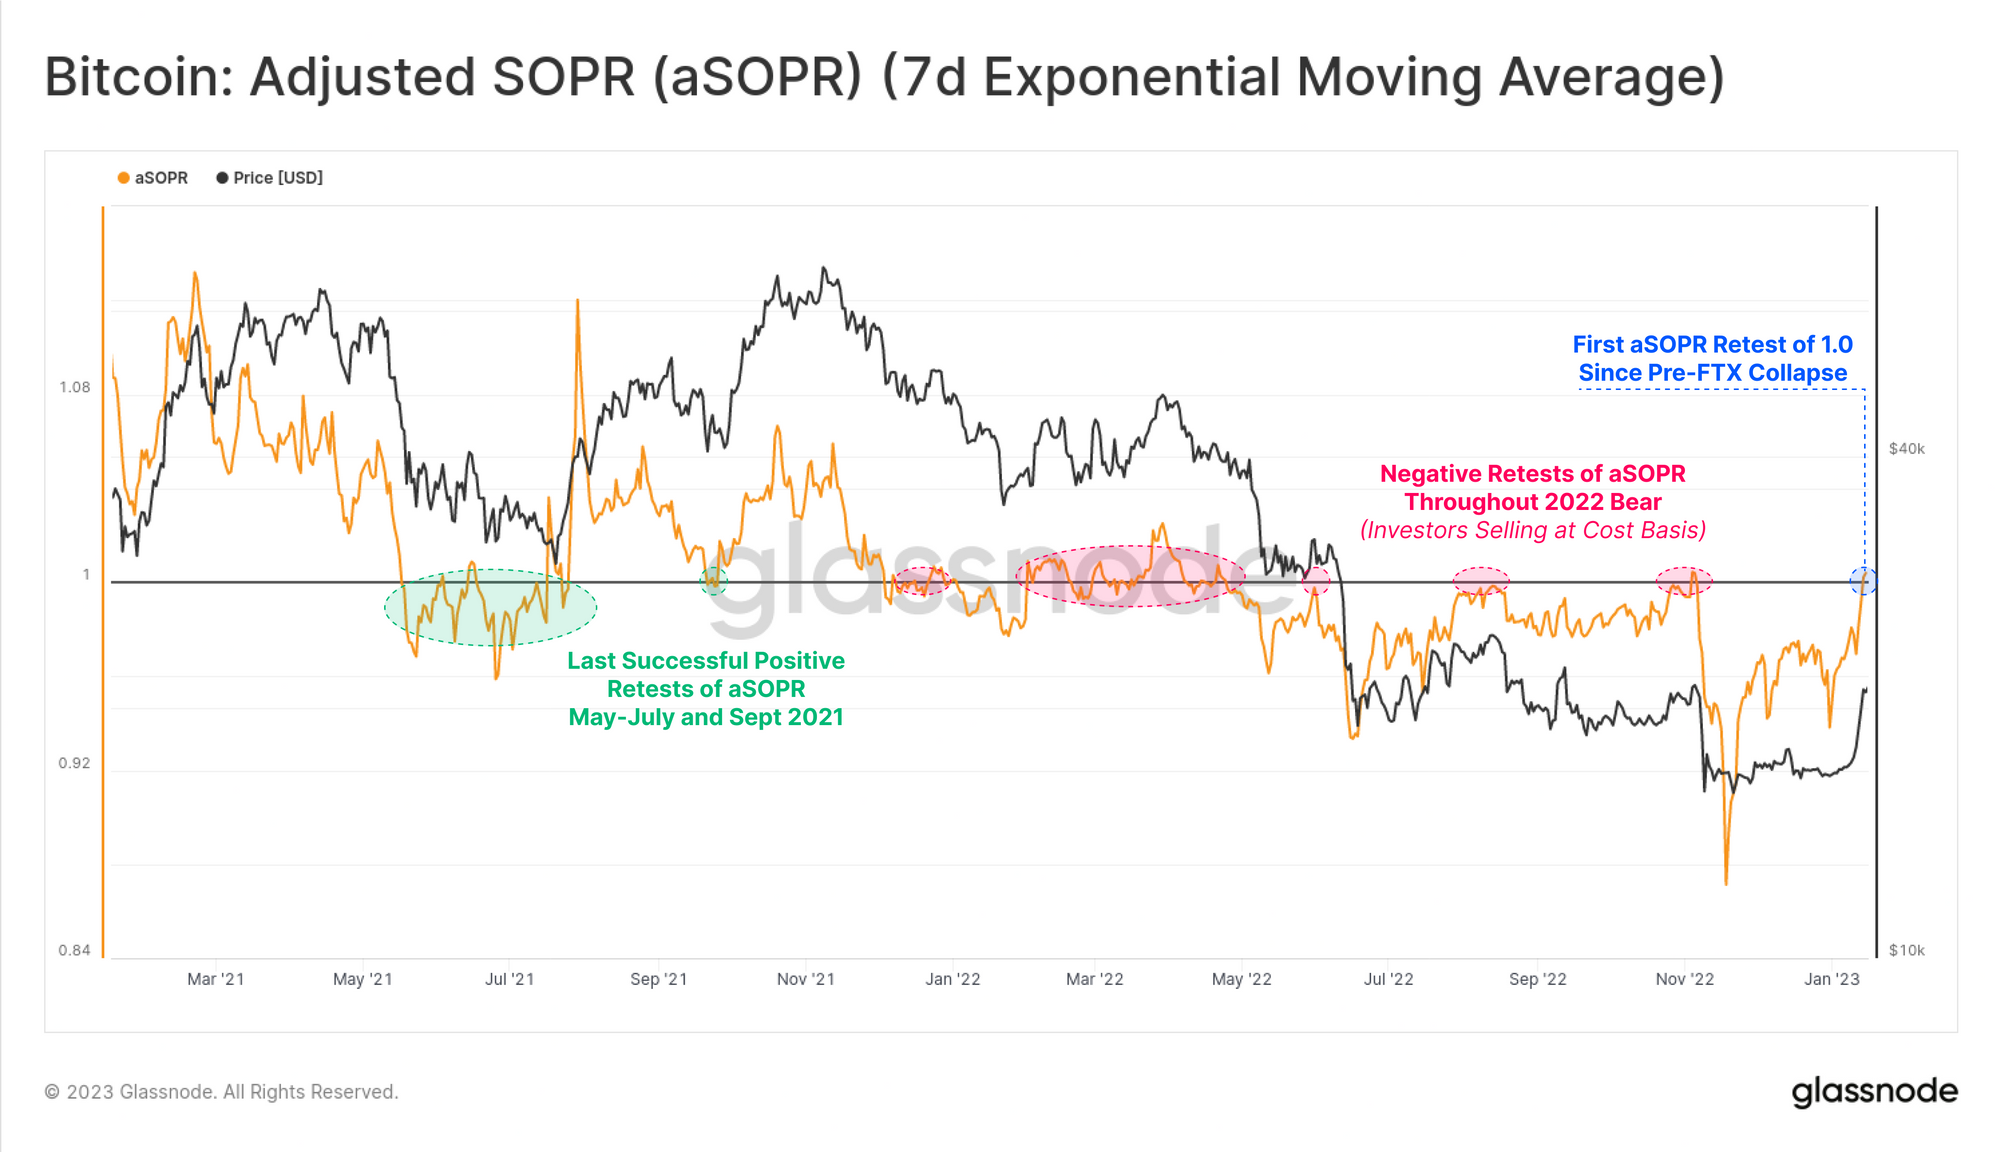
The 7-day EMA value of the metric seems to have gone up in recent days | Source: Glassnode's The Week Onchain - Week 3, 2023
As shown in the above graph, the 7-day EMA Bitcoin aSOPR has sharply risen recently and has reached the 1 level for the first time since the pre-FTX crash. This level has been historically significant for BTC, as the crypto has often encountered resistance at it during bear market periods.
The reason behind this is the fact that the aSOPR equal to 1 line represents the break-even mark. Whenever the metric increases to this mark, it means enough holders are back in a state of neutrality that they are able to recoup their investment.
Psychologically, investors see this as getting their previously lost money “back” and hence large-scale dumping takes place here, thus providing impedance to the crypto’s price.
A successful break above this level would suggest, however, that there is enough demand in the Bitcoin market right now that holders are able to realize their profits and buyers are present to absorb this selling. Because of this, such breaks have usually led to a transition from bear to bull markets.
When bull markets take hold, the effect of the aSOPR 1 level flips, and the line instead starts providing support to the price of BTC.
BTC Price
At the time of writing, Bitcoin is trading around $21,200, up 23% in the last week.

Looks like the rally has come to a halt since hitting the $21,000 level | Source: BTCUSD on TradingView
Featured image from Kanchanara on Unsplash.com, charts from TradingView.com, Glassnode.com