Crypto Expert Calls Cardano (ADA) a Ticking Time Bomb – Here’s Why MEXC
Source link ]]>
Cardano In Danger Zone? Trader Drops ‘Time Bomb’ Claim TradingView
Source link ]]>
Ethereum co-founder Vitalik Buterin is urging the Ethereum ecosystem to treat oracle design and decentralization as a priority security problem, warning that key parts of DeFi’s stack still hide uncomfortable fragilities behind the industry’s recent growth.
In a post outlining how the Ethereum Foundation is thinking about DeFi, Buterin framed decentralized finance as “a central part of the value that Ethereum provides” and argued that its next phase must pair renewed innovation with a harder line on security and centralization risks.
“Defi is a central part of the value that Ethereum provides. Financial empowerment is a central part of what it means to have agency and freedom in our current world. Finance is far from the only thing that Ethereum is good for, but it is an important thing,” Buterin wrote, positioning DeFi not as a side quest, but as one of Ethereum’s flagship deliverables.
Related Reading
Ethereum Foundation’s DeFi Crackdown: No Centralized Shortcuts
Buterin’s thesis has two edges. The first is aspirational: DeFi should return to the early-era willingness to invent new primitives rather than iterating on the same product shapes. He pointed to AMMs as an example of the kind of paradigm shift he wants developers to chase again, arguing that teams should “dig a layer deeper” than surface-level improvements like “make a better stablecoin” and instead attack the underlying financial problems: risk management and hedging future expenses with new mechanisms.
The second edge is a filter. Buterin said the Ethereum Foundation is not looking to support “onchain finance” or “defi” indiscriminately, but to push toward a narrower vision: “permissionless, open-source, private, security-first global finance that maximizes people’s control over their own assets, minimizes centralized chokepoints and trusted third parties, and democratizes risk management and wealth building … as well as payments.”
A key standard in that vision is operational resilience. Buterin said the ecosystem should prefer protocols that “pass the walkaway test”: systems that keep functioning even if the founding team disappears overnight or worse, “becomes hostile / compromised without warning.” It’s a stark yardstick in a sector where governance keys, upgrade mechanisms, and offchain dependencies often concentrate power long after a protocol looks “decentralized” in marketing.
Related Reading
Where the alarm bell rings loudest is oracles: the bridge between onchain logic and offchain reality. In a list of priority areas, Buterin singled out “oracle security and decentralization,” adding a blunt aside: “there’s A LOT of skeletons in the closet here, we as an ecosystem really need to point a big eye of sauron at it for a while.” The line is telling: it implies risks that are known, tolerated, or under-discussed, despite oracles sitting on the critical path for lending, stablecoins, derivatives, and liquidations.
Buterin framed DeFi as a “complex toolchain” that mixes onchain components with user-side and other offchain pieces — wallets, local agents, and more. His roadmap-like list reflects that breadth: classic security work such as audits, standards, and wallet-side safeguards; newer approaches like “AI-assisted formal verification” and “user-side agents as safeguards”; privacy for both payments and more complex positions, including the question of what a “maximally privacy-preserving CDP” would look like; and renewed emphasis on open source licensing and forkability.
The closing message is permissive but not passive. Ethereum will always allow people to deploy “insecure protocols” or systems that embed “ultimately unneeded centralized trust in the name of convenience,” Buterin wrote, as well as what he called “dopamine-maximizing gambleslop.”
But he signaled the Foundation’s intent to actively collaborate with builders aligned around minimizing intermediaries and maximizing user agency, with the aim of making that version of DeFi not just Ethereum’s best option, but “a globally compelling way to manage funds” for anyone who values those properties.
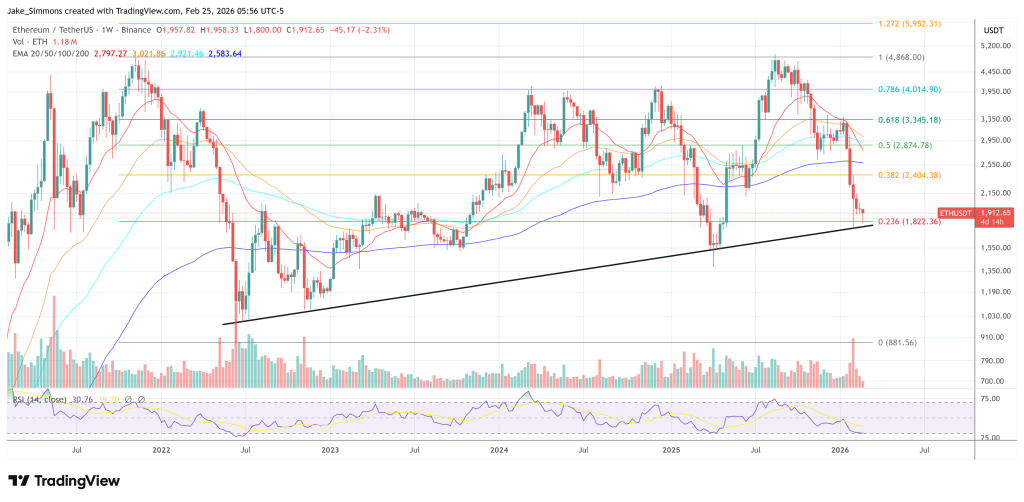
At press time, ETH traded at $1,912.
Featured image created with DALL.E, chart from TradingView.com
Trump’s Tariff Bomb… Bloomberg Reports Dogecoin Investors Fleeing 블루밍비트
Source link ]]>
Data shows the Ethereum derivatives-related metrics have shot up recently, a sign that the price is at risk of going through a volatile storm.
Ethereum Open Interest & Leverage Ratio Have Both Spiked Recently
In a CryptoQuant Quicktake post, an analyst has discussed about the trend in the derivatives indicators of Ethereum. The metrics in question are the Open Interest and the Estimated Leverage Ratio.
First, the Open Interest keeps track of the total amount of ETH-related contracts that are currently open on all derivatives platforms. The metric naturally takes into account for both long and short positions.
When the value of this metric rises, it means the investors are opening up fresh positions on the market. Such a trend suggests derivatives trading interest in the coin is going up.
On the other hand, the indicator registering a drawdown implies positions in the market are going down. This could be because of investors willfully closing them up, or due to exchanges forcibly liquidating them.
Now, here is a chart that shows the trend in the Ethereum Open Interest over the last few years:

The value of the metric appears to have been shooting up in recent days | Source: CryptoQuant
The above graph shows that the Ethereum Open Interest has witnessed rapid growth recently. It has surpassed the previous all-time high (ATH) to set a new record above $13 billion.
When considering the timeframe of the past four months, the indicator has increased by over 40%, which suggests an explosion in speculative interest around the cryptocurrency has occurred.
This development, however, may not be the healthiest, as the trend in the second indicator of relevance, the Estimated Leverage Ratio, would suggest. This metric measures the ratio between the Open Interest and the Derivatives Exchange Reserve.
The Derivatives Exchange Reserve is naturally just the total amount of the cryptocurrency sitting in wallets associated with all centralized derivatives exchanges.
The Estimated Leverage Ratio tells us the amount of leverage or loan that the average derivatives user in the Ethereum market is currently opting for.
Below is a chart for this indicator.

Looks like the value of the metric has been heading up over the last few weeks | Source: CryptoQuant
From the graph, it’s apparent that the Ethereum Estimated Leverage Ratio has shot up recently. This would mean that the increase in the Open Interest has been more rapid than the rise in the Derivatives Exchange Reserve.
The investors are now sitting on all-time high (ATH) leverage, which can be a bad sign for ETH as it implies any volatility in the future could take down the overleveraged positions and induce a mass liquidation event called a squeeze.
The quant has pointed out that the Ethereum Funding Rate, a ratio between long and short positions, is positive right now, which suggests that if a squeeze is to happen shortly, it’s more likely to involve the bullish side of the market.
ETH Price
At the time of writing, Ethereum is floating around $3,000, down almost 7% over the past week.
The price of the coin seems to have been consolidating sideways recently | Source: ETHUSDT on TradingView
Featured image from Dall-E, CryptoQuant.com, chart from TradingView.com
Tesla Billionaire Elon Musk Declares ‘Financial Emergency’ As $35.7 Trillion ‘Debt Bomb’ Primes A Bitcoin Price Boom To Rival Gold Forbes
Source link ]]>
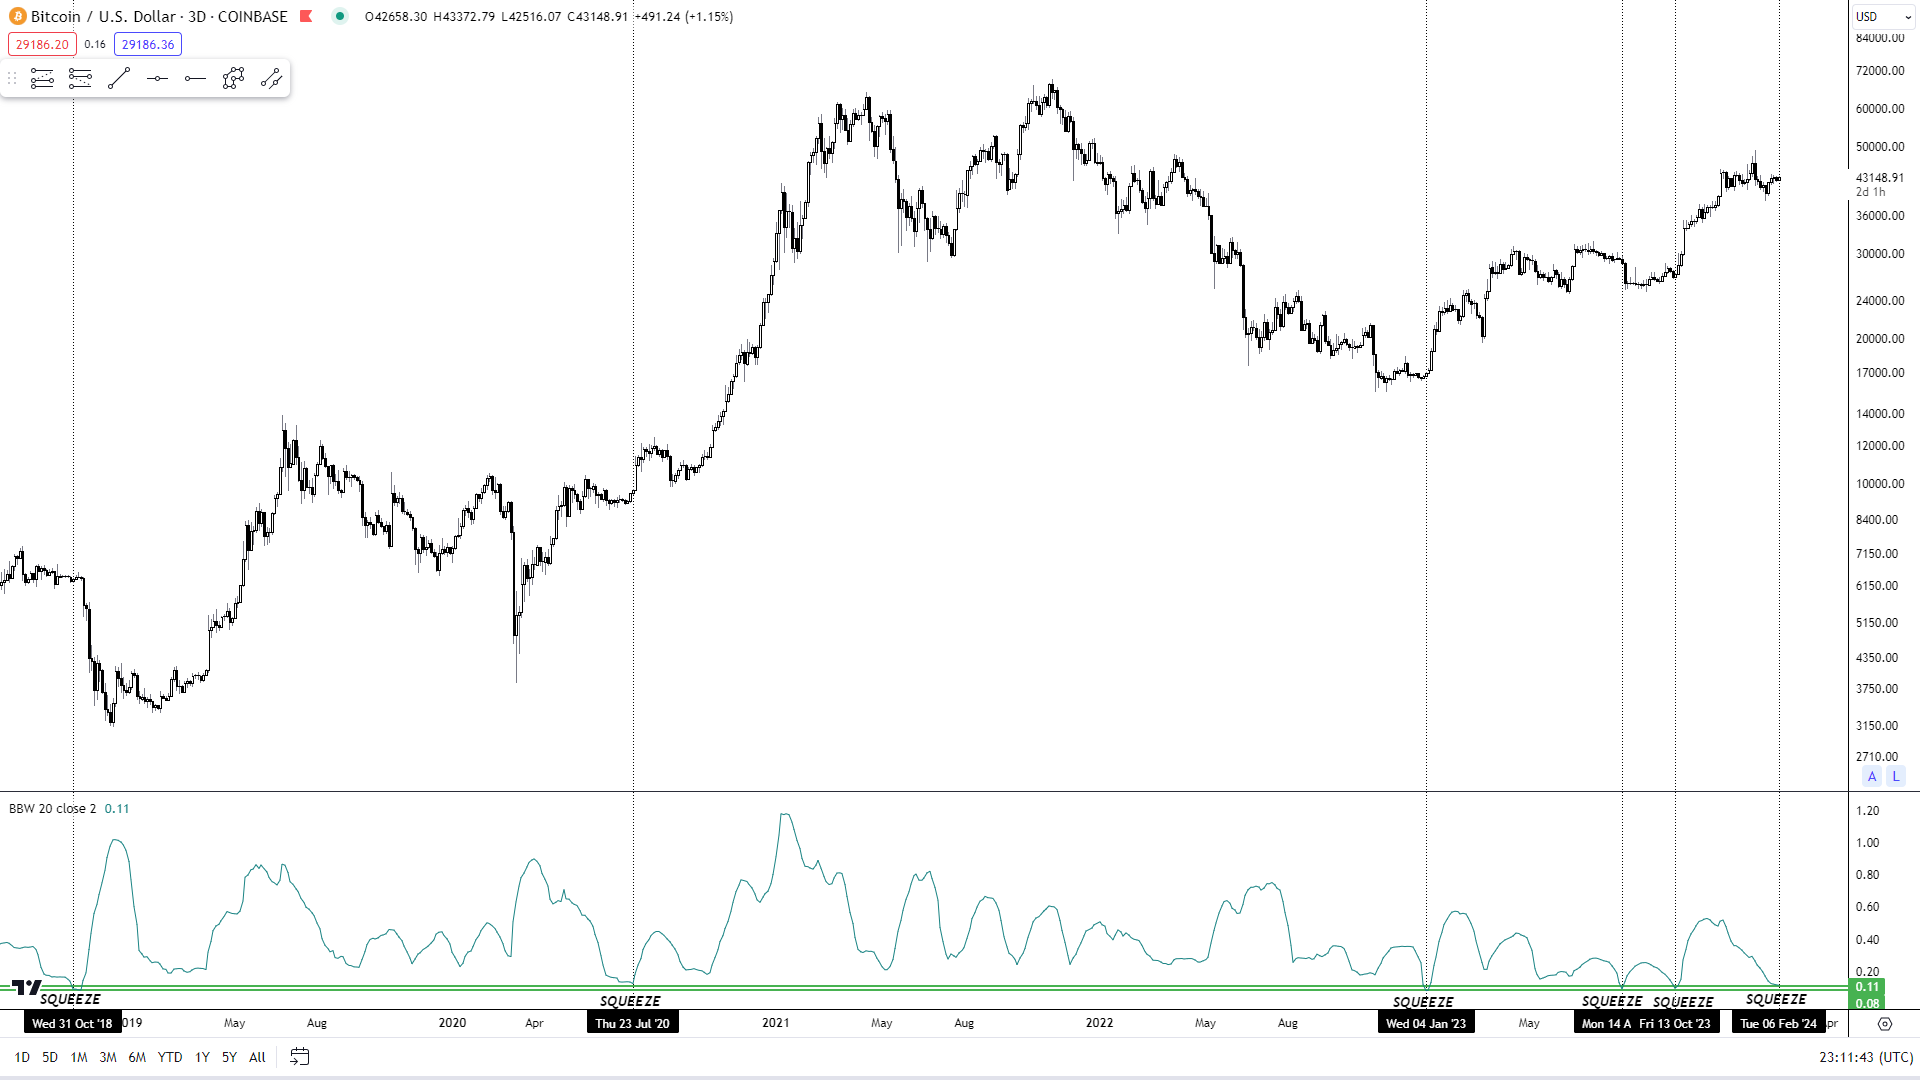
Bitcoin has been moving sideways since mid-January, when the price broke out of a parallel upward channel to the downside. The BTC price is currently around the same price as on January 13. However, the time of dullness could soon be over, as the Bollinger Band Width (BBW) indicator signals.
The BBW is derived from the Bollinger Bands themselves, which consist of a middle line (typically a simple moving average) surrounded by an upper and lower band. These bands expand and contract based on the standard deviation of the price from the mean, which is a measure of volatility. The BBW quantifies the degree of these bands’ divergence or convergence by calculating the ratio of the difference between the upper and lower bands to the middle band.
Bitcoin Mega Squeeze Incoming
In an analysis on X (formerly Twitter), crypto analyst HornHairs has drawn attention to the BBW which currently shows a reading close to 0.11. This number is significant because it suggests that the bands are very close together, indicating a period of low volatility or a ‘squeeze.’ He remarked:
BTC MEGA VOL SQUEEZE: We probably have 10 days MAX before a huge move on BTC. Now’s the time to get your plan ready for either direction, don’t want to be stuck in a frozen panic with no plan if things launch upwards or nuke lower. It’s coming very soon.
Historically, such a squeeze is often followed by a period of high volatility, as the market moves to find a new price equilibrium. The key takeaway from the BBW’s current low reading is that the market should prepare for a sharp increase in volatility, leading to a strong upward or downward movement in Bitcoin’s price.
The term “Mega Squeeze” used by HornHairs points to the unusually tight convergence of the Bollinger Bands, implying that the subsequent market move could be more pronounced than what is typically observed following a BBW contraction. The last few times the BBW approached such low levels, Bitcoin experienced significant price swings shortly thereafter. These historical precedents serve as a guide to what might occur in the days ahead.
The last instance of the BBW reaching its current low was observed on October 13 last year. Subsequent to this indicator, BTC experienced a significant rally, ascending over 30% in a mere 10 days. In a contrasting scenario, mid-August 2023 saw the BTC value decline by 15% in just 8 days. Additionally, at the outset of January 2023, Bitcoin showcased a remarkable surge, escalating by 40% within a span of 17 days.
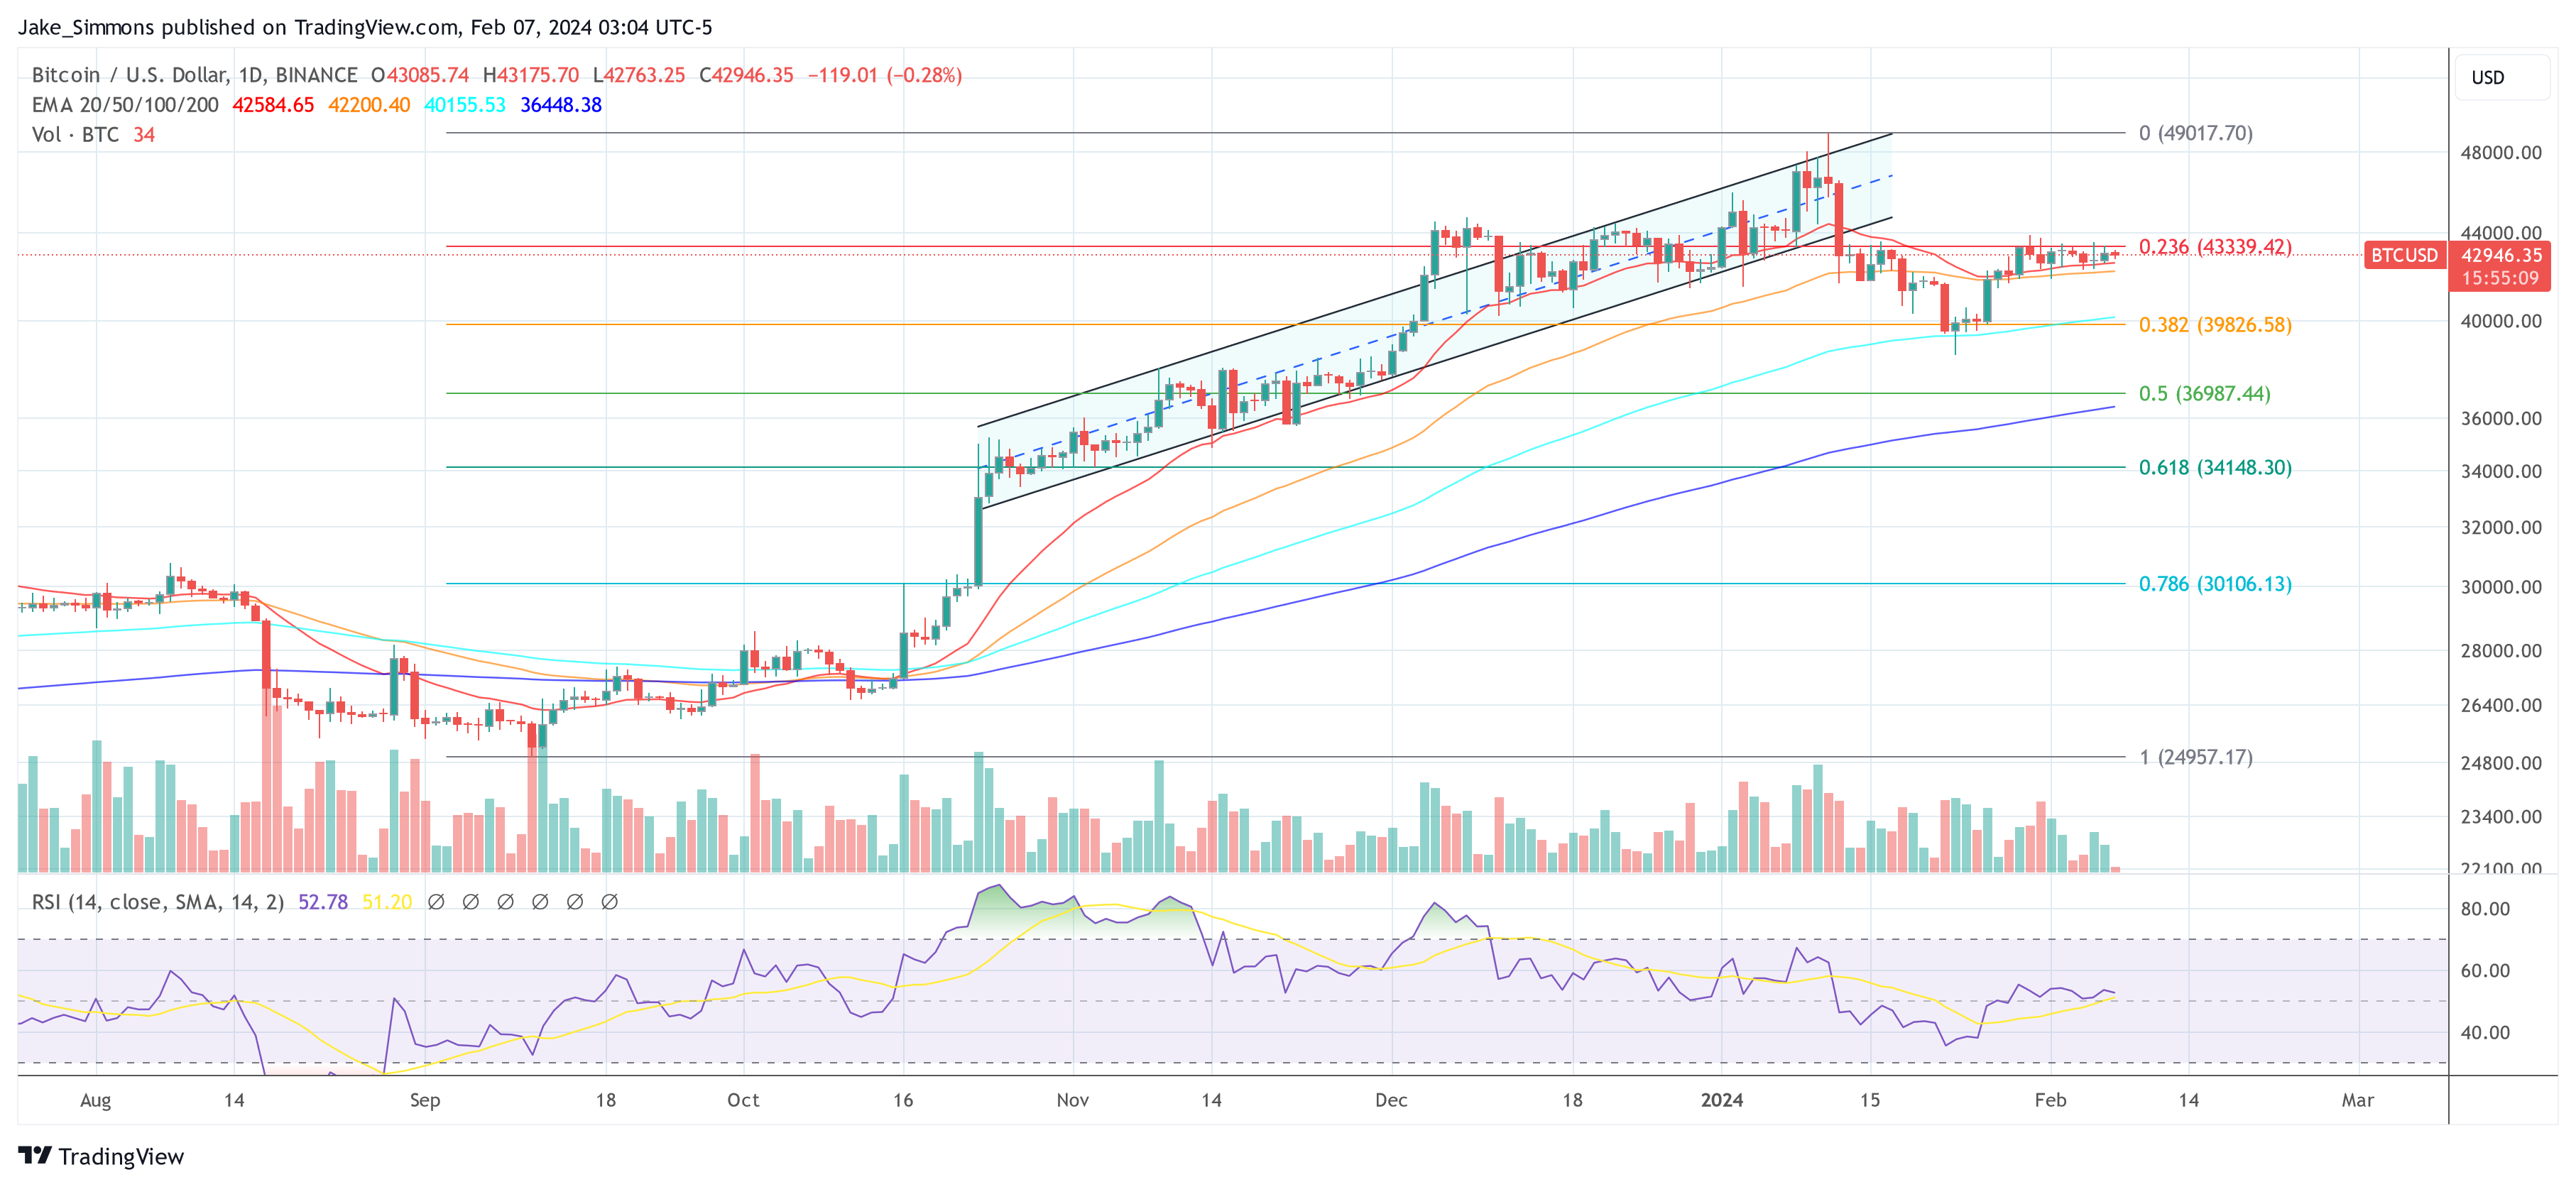
As of press time, Bitcoin was hovering around $42,900, with a recent peak at $49,000 and a local low at $38,600. These price points will be crucial to watch as the market navigates through this period of constricted volatility. The BBW suggests that the breakout, whether bullish or bearish, will likely drive the price towards or even beyond these levels, marking a new phase of market activity.
Renowned crypto analyst CrediBULL commented on the emergence of the indicator: “Volatility soon. Big move coming. My bet is UP and the start of our next impulsive leg that we have been anticipating. Place your bets and pack your bags frens.”
The next key resistance on the 1-day chart of BTC/USD is at $43,340 (0.236 Fibonacci retracement level), while the region at $39,800 (0.386 Fibonacci level) provides key support.
Featured image created with DALL·E, chart from TradingView.com
Disclaimer: The article is provided for educational purposes only. It does not represent the opinions of NewsBTC on whether to buy, sell or hold any investments and naturally investing carries risks. You are advised to conduct your own research before making any investment decisions. Use information provided on this website entirely at your own risk.
Ethereum (ETH), a forerunner in the decentralized finance (DeFi) ecosystem, has seen a notable surge in its staking activities. This staking boom has raised eyebrows among experts from JPMorgan concerned over ETH’s increase in centralization and the consequences that may arise.
Ethereum, aiming to transition to a proof-of-stake consensus mechanism, opened the floodgates for staking. This meant holders could ‘stake’ or lock their tokens to support network operations like block validation. However, while this promises rewards for the stakers, JPMorgan analysts have reported that there could be ripple effects.
Ethereum Centralization Concerns Rise To The Surface
JPMorgan analysts, led by Nikolaos Panigirtzoglou, highlight the inadvertent increase in Ethereum’s network centralization, particularly post the Merge and Shanghai upgrades. The Ethereum network became “more centralized as the overall staking yield declined,” they noted.
According to the analysts, what’s leading to this centralization could be attributed to liquid staking providers. Lido, a notable player, has been pinpointed for its dominant role. The JPMorgan report noted:
The top 5 liquid staking providers control more than 50% of staking on the Ethereum network, and Lido specifically accounts for almost one-third.

The analysts further disclosed while platforms such as Lido tote their decentralized nature, the underlying reality appears different. The analysts said these platforms “involve a high degree of centralization.”
According to the analysts, the ramifications of such centralization can’t be understated. They mentioned that “a concentrated number of liquidity providers or node operators” might compromise the network’s integrity, leading to potential points of failure, attacks, or even conspiracy, resulting in an “oligopoly.”
They further highlighted that such centralized entities could censor or exploit user transactions, undermining the community’s interests.
The Rehypothecation Risk And Declining Rewards
Another dimension to the staking story is the looming threat of ‘rehypothecation.’ In simple terms, it’s the act of leveraging staked assets as collateral across various DeFi platforms. According to the JPMorgan’s analysts:
Rehypothecation could then result in a cascade of liquidations if a staked asset drops sharply in value or is hacked or slashed due to a malicious attack or a protocol error.
Furthermore, as Ethereum continues its journey on the staking path, the staking rewards seem to diminish. The report indicated a drop in total staking yield from 7.3% before the Shanghai upgrade to roughly 5.5% recently.
Regardless, Ethereum has shown a slight upward trajectory of 1.5% in the past 24 hours, with a market price currently sitting at $1,643 and a market cap of approximately $9 billion, at the time of writing.
Featured image from Unsplash, Chart from TradingView
Cardano ADA Drops Valentine’s Day Bomb with its New Upgrade Watcher Guru
Source link ]]>
- AVAX price continues to trend downwards as price remains bearish with price trading on key support.
- AVAX trades below 50 and 200-day Exponential Moving Average as price struggles to regain bullish signs.
- The price of AVAX needs to break and hold above the key resistance of $30 to resume bullish price movement.
The price of Avalanche (AVAX) continues to struggle to discover its bullish trend as the price fails to break the key resistance of $30 against tether (USDT). The previous weeks saw the crypto market cap as good as Bitcoin (BTC) prices and other crypto assets. Still, the price of Avalanche (AVAX) continues to struggle to join the green party as the price continues in its downtrend movement. (Data from Binance)
Avalanche (AVAX) Price Analysis On The Weekly Chart.
Despite showing some great price movement in recent weeks with so many traders and investors becoming interested in the different projects being built on the Avalanche ecosystem, which could have been a huge boost for the price to trend higher but that wasn’t the case the price has struggled to trend higher than $30.
After the price of AVAX dropped to a weekly low of $15, the price rallied from this low to a high of $30, where the price faced resistance to breaking above this region to a height of $50 as the price was rejected and has since maintained a bearish price movement.
The price of AVAX bounced from $18 haven faced rejection from $22, but the price could not trend higher as the price continued to trend in a downtrend. If the price of AVAX continues in this trend, we could see the price retesting support area at $10.
Weekly resistance for the price of AVAX – $21.
Weekly support for the price of AVAX – $15.
Price Analysis Of AVAX On The Daily (1D) Chart

In the daily timeframe, the price of AVAX continues to trade above key support formed in recent weeks when the price dropped from a region of $45 to a daily low of $15.
The price of AVAX continued in its downtrend, moving in a range as the price has formed a descending triangle with what looks like a break out to the upside could be imminent.
The price of AVAX needs to rally away from key support to avoid price dropping to a low of $10 if the price breaks to the downside of the descending triangle.
The relative strength index for the price of AVAX on the daily chart shows the price being dominated by sell orders as the mark is below 50.
Daily resistance for the AVAX price – $18.
Daily support for the AVAX price – $15.
Featured Image From The Coin Republic, Charts From Tradingview