There are many different indicators that analysts have used to predict the Bitcoin bottom in the past, and the Cumulative Value Days Destroyed (CVDD) is one of them. Mostly, these indicators are known for predicting the bottom because when they have appeared in the past, it did not take long until the Bitcoin price reached the lowest level of the cycle. The interesting thing about the CVDD flashing now is how low it is putting the BTC price before it finds a bottom.
CVDD Says Bitcoin Price Is Going Lower
The Cumulative Value Days Destroyed (CVDD) was highlighted by crypto analyst TradingShot as an indicator that has predicted Bitcoin’s price bottom in the past. Usually, when this indicator is triggered, it is not long before the bottom is reached. Moreso, the Bitcoin price tends to drop a bit lower than the price the CVDD points to before bottoming.
Related Reading
Given how this indicator has performed in the past, it puts into perspective where the Bitcoin price might be in this cycle. Presently, the bulls are still holding above $70,000 while the CVDD is pointing to $49,280. This would mean that the Bitcoin price has actually not reached a bottom and could continue to decline again.
In addition to this, the MA200 on the 1-Day chart would need to confirm the bottom as a buy follow-up. When this happens, the crypto analyst says it means that the Bitcoin price has entered another bull cycle. Thus, if the digital asset follows the CVDD, then there would be a more than 30% crash coming.

Bull Market Peak Indicators Say Top Is Not In
While most analysts in the market are shooting to game the Bitcoin bottom, other indicators are pointing toward the fact that the digital asset hasn’t hit its peak yet. According to the 30 Bitcoin Bull Market Peak Indicators tracked by the Coinglass website, the bull market might not be over yet.
Related Reading
One indicator that is yet to hit is the Bitcoin dominance, which hasn’t shown any signs of retracing. Instead, the pioneer cryptocurrency continues to dominate the market, leaving altcoins in the dust. Also, the Bitcoin long-term holder supply has not peaked, and the Bitcoin short-term holder supply follows the same trajectory.
Since none of the 30 indicators have been triggered, the tracker suggests that this might be the time to buy BTC and not sell. However, there are still the macroeconomic and political factors, such as the US-Iran war, to consider, as these could also negatively impact the Bitcoin price and where the bottom might form.
Featured image from Dall.E, chart from TradingView.com
A single on-chain indicator has quietly called every major Bitcoin cycle bottom for the past decade, and it is now approaching that important level once again.
The setup comes from a monthly Bitcoin chart paired with the NUPL indicator, which tracks whether the average holder is sitting on unrealized profit or loss. In each of the last three major bear market lows, the indicator fell into the same area and touched a rising trendline.
Nailing The Bitcoin Bottom
Bitcoin’s latest break above $70,000 and into the mid-$70,000s has seen a bullish mood slowly returning. The fear and greed index has improved, but one question is still unresolved. Has the market already found its bottom, or is another washout still ahead? Interestingly, a long-term reading of the Net Unrealized Profit/Loss, or NUPL, shows that the answer may lie in a pattern that has repeated across multiple market cycles.
Related Reading
NUPL is a clean sentiment gauge in Bitcoin analysis because it strips price action down to a question of whether holders, on average, are in profit or in pain. When the reading is high, the market is sitting on large unrealized gains. When it falls hard, those profits disappear, and losses dominate.
The monthly candlestick chart shows that Bitcoin’s major cycle lows have consistently formed when NUPL resets into deep territory and tags a long-term ascending support line. That happened at the 2015 cycle bottom, repeated again at the 2018 bear market low, and showed up once more around the 2022 bottom. Each of those touches came at points when sentiment had already been crushed, and the Bitcoin price had shed most of its previous gains.
The current NUPL reading of 22.9 represents a cryptocurrency that is still in modest aggregate profit, although it has shed a huge portion of the gains investors accumulated during the rally to the October 2025 peak above $126,000.
Is The Bottom Already In?
According to a crypto analyst that goes by the name CrypFlow on the social media platform X, the NUPL indicator is now approaching that level of Bitcoin bottoms again. If this pattern holds, Bitcoin may still need another deeper reset in sentiment before the market reaches a true long-term washout.

Price may have already corrected a lot, but the indicator shows the emotional capitulation seen at prior bottoms may not be complete yet. The NUPL might continue to push downwards and reach the trendline before a bottom is confirmed.
Related Reading: Analyst Says Bitcoin Bulls Have Won And This Is The Next Target
Although no single indicator can call every bottom with perfect precision, the NUPL leaves room for the possibility that one final price crash could still come before the next full cycle expansion begins. At the time of writing, Bitcoin is trading at $74,220, up by 1.3% in the past 24 hours.
Featured image from Pngtree, chart from Tradingview.com
ADA Price Bottoms At $0.2604 As Whales Sell 130 Million ADA Tokens, Triggering Further Cardano Sell-Off BlockchainReporter
Source link ]]>
Bitcoin (BTC) has just flashed a ‘Death Cross,’ a technical signal that has historically preceded major market bottoms. Market analyst CrypFlow, who identified the chart pattern, notes that the current setup is unfolding almost identically to the 2022 bear market cycle. In his analysis, he outlines a potential price target for a Bitcoin bottom and shares what history suggests could come next if the death cross follows the same trajectory as in previous cycles.
Bitcoin Death Cross Signals More Downside
CrypFlow shared his foreboding analysis on X, confirming a Death Cross on the three-day BTC chart that had previously signaled bear-market bottoms. The formation comes as Bitcoin faces significant selling pressure and market volatility, with investor sentiment down the drain and geopolitical tensions fueling more fear and panic, pushing holders to exit the market.
Related Reading
CrypFlow has stated that the current Death Cross formed against a backdrop of Bitcoin trading around $66,200 at the time of the analysis, with the figure well below the 50 Simple Moving Average (SMA) at $89,799 and the 200 SMA at $91,226. The massive gap between the price and both moving averages underscores how aggressively the market has deteriorated since Bitcoin’s cycle top above $126,000 in October 2025.

The analyst draws a direct comparison between the current Death Cross and the 2022 bear market cycle, in which an identical Death Cross pattern preceded Bitcoin’s most devastating price crash to a final bottom. In that cycle, CrypFlow noted that the Death Cross formation came after reaching a peak above $66,000.
Once Bitcoin reached this ATH level, it began trending downwards, forming a Death Cross, which eventually led to a final capitulation low one month later. Interestingly, the cryptocurrency experienced a Double Bottom after crashing again in 2023, with this final decline serving as the foundation for the next bull run.
Analyst Shares BTC Bottom Target And Timeline
The Death Cross pattern is widely recognized as a bearish warning sign, indicating more pain ahead for Bitcoin. Following the 2022 cycle, when the market bottomed roughly one month after the cross was confirmed, CrypFlow has identified March 29, 2026, as a critical window to watch for Bitcoin’s potential price floor this cycle. He suggests a possible target near $50,000, framing the projected one-month timeframe as a historically informed inflection point rather than a guaranteed outcome.
Related Reading
CrypFlow has outlined three distinct conditions it intends to monitor as that window approaches. The first is continued price weakness into late March, which could serve as a behavioral confirmation that the current cycle is mirroring past patterns. The second condition the analyst is watching for is evidence of seller exhaustion near the March 29 window.
His third and perhaps most important condition is the reclaiming of key moving averages following any potential bottom. CrypFlow stressed that this reclaim should be viewed as confirmation of a completed bottom.
Featured image from Getty Images, chart from Tradingview.com
Keshav is currently a senior writer at NewsBTC and has been attached to the website since June 14, 2021.
Keshav has been writing for many years, first as a hobbyist and later as a freelancer. He has experience working in a variety of niches, even fiction at one point, but the cryptocurrency industry has been the longest he has been attached to.
In terms of official educational qualifications, Keshav holds a bachelor’s degree in Physics from one of the premier institutes of India, the University of Delhi (DU). He started the degree with an aim of eventually making a career in Physics, but the onset of COVID led to a shift in plans. The virus meant that the college classes had to be delivered in the online-mode and with it came free time for him to explore other passions.
Initially only seeking to make some beer money, Keshav unexpectedly landed clients offering real projects, after which there was no looking back. Writing was something he had always enjoyed and to be able to do it for a living was like a dream come true.
Keshav completed his Physics degree in 2022 and has been focusing on his writing career since, but that doesn’t mean his passion for Physics has ended. He eventually plans to re-enter university to obtain a masters degree in the same field, but perhaps only to satiate his own interest rather than for using it as a means to find employment..
Keshav has found blockchain and its concepts fascinating ever since he started going down the rabbit-hole back in 2020. On-chain analysis in particular has been something he likes to research more about, which is why his NewsBTC pieces tend to involve it in some form.
Being of the science background, Keshav likes if concepts are clear and consistent, so he generally explains the indicators he talks about in a bit of detail so that the readers can perhaps come out having understood and learnt something new.
As for hobbies, Keshav is super into football, anime, and videogames. He enjoys football not only as a watcher, but also as a player. For games, Keshav generally tends towards enjoying singleplayer adventures, with EA FC (formerly FIFA) being the only online game he is active in. Though, perhaps due to being ultra-focused on the game, he is today a semi-pro on the EA FC scene, regularly participating in tournaments and sometimes even taking back prize money.
Because of his enthusiasm for anime and games, he also self-learned Japanese along the way to consume some of the untranslated gems out there. The skill didn’t merely remain as just a hobby, either, as he put it to productive use during his exploration for small-time gigs at the start of COVID, fulfilling a couple of Japanese-to-English translation jobs.
Keshav is also big into fitness, with agility and acceleration-related workouts making a big part of his program due to the relevance they have in football. On top of that, he also has a more traditional strength based program for the gym, which he does to maintain an overall fitness level of his body.
The Bitcoin price is currently trading under immense bearish pressure, and the downtrend might not yet be over. Bitcoin has now broken below $70,000 and has extended its decline below $65,000. This price action is part of an extended corrective phase that began after Bitcoin topped out at $126,000 in October 2025, and crypto participants have different outlooks as to when the correction will reach a bottom.
Amid the uncertainty, an outlook from a crypto analyst known as Sherlock is gaining traction on X, as it points to historical market bottoms that suggest Bitcoin may still be headed significantly lower.
Past Drawdowns Show A Clear Pattern Across Bitcoin Cycles
Sherlock’s analysis focuses on how deep Bitcoin has fallen during past bear markets and how those declines have changed as the asset has matured over the years. According to the data he highlighted, Bitcoin’s 2011 cycle saw a drawdown of about 93% from peak to trough. This is the highest correction for the Bitcoin price to date. That figure reduced to about 86% in 2015, then to 84% in 2018, and further to around 77% during the 2022 bear market.
Related Reading
The consistent takeaway from these cycles is that each successive drawdown has been smaller than the last. This isn’t surprising, as Bitcoin and the entire crypto market have been growing in size, liquidity, and participation over time.
Using that trend as a guide, the next major bottom correction should continue this progression. The projection is that the correction should drop from 77% in the 2022 bear market to 70% in the current price action. If the drawdown compresses to about 70% in the current cycle, measured from the $126,000 all-time high, then the bottom would land around the $38,000 region.
Dismissing Higher Bottom Targets Like $69,000 And $50,000
The projection by Sherlock received a lot of views and comments on X, with some market participants noting that reflexivity and increased institutional involvement should reduce downside risk this time around. One notable response suggested that when comparing prior bottom-to-top moves against top-to-bottom declines, Bitcoin’s next drawdown should be closer to 55% or 60%, instead of 70%.
Sherlock pushed back on that view by noting how reflexivity can amplify downside moves just as easily as it causes rallies. “Good luck buying your bottom at $69,000, $60,000 and $50,000,” he said.
Related Reading
For the time being, Bitcoin is caught between aggressive sell-offs and growing concern that the larger corrective phase is not complete. At the time of writing, Bitcoin is trading at $64,850, having rebounded from an intraday low of $60,255, according to data from CoinGecko.
The recent price action means Bitcoin is back to trading at its lowest levels since October 2024. If Bitcoin were to revisit the $38,000 area, it would represent a return to price levels last seen during the early stages of the bull market. The last time Bitcoin traded around $38,000 was in October 2023.
Featured image created with Dall.E, chart from Tradingview.com
Dogecoin Price May Repeat 2021 Gains as NVIDIA Ratio Bottoms — Analyst Coinpaper
Source link ]]>
Shiba Inu’s Multiple Oversold Bottoms Spell Price Troubles DailyCoin
Source link ]]>

Ethereum has retraced below the $3,200 level following the Federal Reserve’s decision to cut interest rates by 25 basis points, a move that initially sparked volatility across the crypto market. While many expected a stronger reaction from Ethereum, the asset instead slipped lower as traders reassessed the macro environment and the implications of a potential shift toward stagflation. Despite this pullback, on-chain data suggests that the underlying market structure may be quietly improving.
According to new insights from CryptoQuant, Ethereum’s Net Taker Volume (30-day moving average) is showing a clear upward trend in its lows. This metric tracks the balance between aggressive buyers and sellers in the derivatives market. Although ETH remains under selling pressure, the data reveals that the intensity of aggressive selling has been weakening steadily over the past several weeks. Each subsequent negative low is forming higher than the previous one, signaling that sellers are losing dominance.
While the broader sentiment remains cautious, subtle improvements in Net Taker Volume suggest that ETH’s current weakness may be masking the early stage of a larger structural shift.
Net Taker Volume Signals a Potential Structural Shift
According to CryptoQuant’s CoinCare, Ethereum may once again be approaching a pivotal turning point. The report highlights that a similar Net Taker Volume structure appeared earlier this year. After forming a clear bottom in January 2025, the metric began to trend upward—even while remaining in the negative zone—indicating that aggressive sellers were gradually losing strength.

By April, Net Taker Volume flipped decisively into positive territory. From that exact moment, Ethereum entered one of its strongest rallies of the cycle, surging more than 3x and printing a new all-time high.
Current conditions echo that same pattern. Since the peak of selling pressure in September, the market has continuously absorbed sell flows for nearly three months. Each negative low in Net Taker Volume has formed higher than the previous one, revealing improving market resilience despite the broader downtrend. If this trajectory holds, CoinCare estimates that a positive flip in Net Taker Volume may be only about a month away.
Historically, this transition from negative to positive has marked the beginning of Ethereum’s most explosive breakout phases. A confirmed move into positive territory would represent a high-probability trigger for the next expansion toward new all-time highs, signaling that momentum is quietly rebuilding beneath the surface.
ETH Weekly Structure Attempts a Recovery
Ethereum’s weekly chart shows the market attempting to stabilize after several weeks of volatility, with price currently trading near $3,195 following a strong rebound from the $2,800 zone. This area acted as a key demand region in mid-2024 and has once again provided support, preventing a deeper breakdown. The recent weekly candle reflects renewed buying interest, closing firmly above the 50-week moving average, a level that often defines medium-term trend direction.
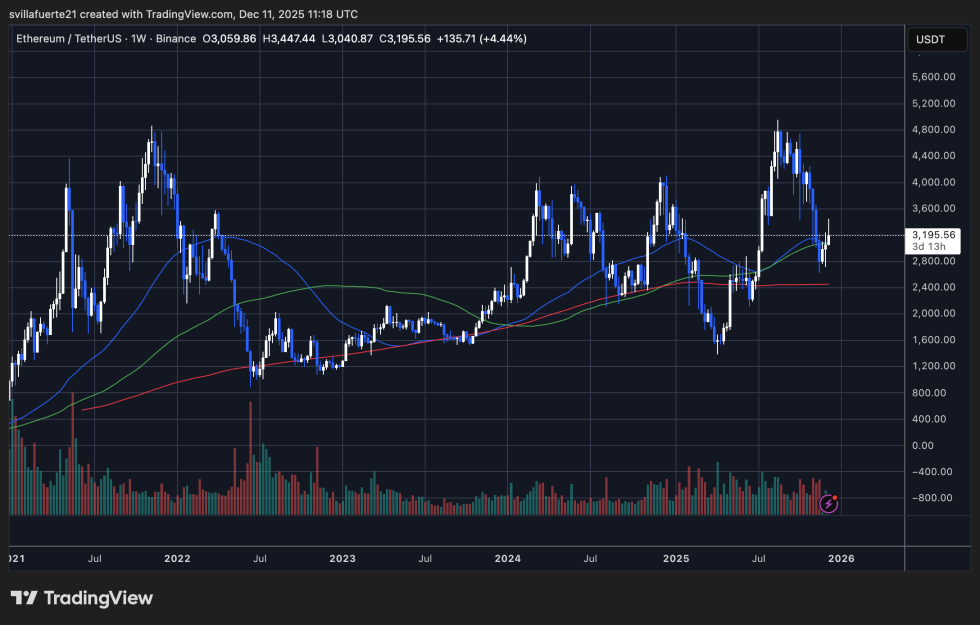
Despite this rebound, ETH still faces structural challenges. The 100-week moving average — now overhead — has acted as resistance throughout the current downtrend, and the price rejected it again on the latest push toward $3,447. Until Ethereum can reclaim this dynamic resistance with conviction, the broader trend remains neutral to slightly bearish.
Volume also shows a notable shift: sell-side activity has been declining over the past month, while buyers are beginning to step in more aggressively at key support levels. This aligns with the improvement in on-chain metrics, suggesting weakening selling pressure.
For bulls, the next major objective is a weekly close above $3,400, which would signal a potential trend reversal. A failure to break this level, however, risks another retest of $2,900–$2,800, where market sentiment would again be tested.
Featured image from ChatGPT, chart from TradingView.com
Editorial Process for bitcoinist is centered on delivering thoroughly researched, accurate, and unbiased content. We uphold strict sourcing standards, and each page undergoes diligent review by our team of top technology experts and seasoned editors. This process ensures the integrity, relevance, and value of our content for our readers.
Shiba Inu Price Prediction: SHIB Price Bottoms as Signer Keys Leak on Shibaswap, Is The OG Meme Coin About to Crash? Cryptonews
Source link ]]>