Crypto analyst Sykodelic has declared that the Bitcoin bleed is almost over and suggested that BTC is unlikely to drop to $40,000 as some experts predict. He alluded to the 2022 bottom to explain why the leading crypto is likely to find a bottom soon and begin a new bull cycle.
Analyst Explains Why Bitcoin Will Soon Find A Bottom
In an X post, Sykodelic said the Bitcoin bleed is almost over and that people expecting a drop to the $40,000 range will be sidelined. He further remarked that this is how people who were waiting for a drop to $12,000 were sidelined during the 2022 bottom. Commenting on the current BTC price action, the analyst noted that the leading crypto is trading in the largest pocket of supply it has seen in over five years, just below the higher-time-frame (HTF) bullish structure.
Related Reading
He stated that back in 2022, the Bitcoin price action was totally different. Back then, BTC had lost its HTF structure, and there was zero demand below. Instead, what was below was “clear air” with Bitcoin dropping below. However, the analyst said such price action is unlikely to occur this time around.

Sykodelic said that the most he sees happening this time around is a deviation from the range low at around $60,000, then a reclaim, followed by a push back above $74,400, which would confirm an expanded flat. The analyst added that if a deviation move below $60,000 occurs, it is very likely due to the U.S.-Iran war, and that it could happen in the next two weeks.
Lastly, he mentioned that there have been signs of large accumulation across the board, with much greater strength. As such, the analyst is confident that this downtrend will be over much faster than most people expect.
Why BTC Could Drop To As Low As $46,000
In an X post, popular crypto analyst Willy Woo stated that old-school on-chain models suggest that Bitcoin will form a bottom between $46,000 and $54,000. He further remarked that the Orange line on the accompanying chart corresponds to the capital stored in BTC, and it has been leaving since November. The analyst also pointed out that the CVDD Floor Model has the advantage of climbing over time and is currently at $45,500.
Related Reading
However, Willy Woo cautioned that these models rely on past behavior and that there have been only four prior bear markets, all within a secular bull market in risk equities. As such, he noted that if the foundation collapses, Bitcoin and the broader crypto market will enter uncharted territory, which could lead to a deeper bear market.
At the time of writing, the Bitcoin price is trading at around $68,600, up in the last 24 hours, according to data from CoinMarketCap.
Featured image from Getty Images, chart from Tradingview.com
XRP’s price action in recent days has led to speculations among crypto traders over whether it could fall below the $2 support zone and how deep any pullback might go before a bottom is established.
Popular XRP analyst Zach Rector addressed this concern shared by many market participants during an interview on the Paul Barron Podcast as to how low XRP could realistically fall before buyers step in and whether a return to the $1 level is still possible under current conditions.
Zach Rector Says $1 XRP Is Virtually Impossible
Inflows into Spot XRP ETFs have been largely offset by selling pressure on centralized exchanges, keeping the cryptocurrency range-bound just above $2 even as long-term demand builds in the background. This range-bound trading has left the cryptocurrency at risk of losing $2 and breaking further downwards. The question now is whether this downward risk can cause the XRP price to return to $1.
Related Reading
Addressing the question from Paul Barron directly, Zach Rector stated that an XRP price move back to $1 is effectively off the table under normal market conditions. He presented such a scenario as something that would only occur in the event of an extraordinary black swan. Current market structure, liquidity depth, and buyer behavior do not support the XRP price falling as low as that level.
According to Rector, XRP’s order book on crypto exchanges is now populated by a large base of passive buyers with limit orders already positioned well above $1. He also used his own trade orders to illustrate why he believes XRP is forming a higher long-term floor.
He acknowledged entering an XRP long above $3.40 earlier in the year and confirmed that the position is still underwater. However, he explained that he has consistently dollar-cost averaged lower, bringing his average entry down to around $2.23. Keeping this in mind, Rector predicted a price low to watch out for before the XRP price bounces.
Higher Lows Says Support Is Between $1.90 And $1.80
XRP’s price structure over the past year points to a market that is gradually building strength rather than breaking down. Rector pointed to XRP’s price chart on Coinbase, which shows the creation of a sequence of higher lows, with price bottoming near $1.60 in April, recovering to form a higher low around $1.77 on October 10, and then holding even higher at approximately $1.81 in November.
Related Reading
That pattern is why the $1.90 to $1.80 range is viewed as the most realistic downside zone if XRP breaks below $2 and selling pressure resumes. According to Rector, a dip below $1.90 could open the door for a brief test of $1.80, and this is as low as the XRP price might go before a bounce. Such a move would still fit within the broader higher-low structure that has defined XRP’s price action throughout the year.
Featured image from Getty Images, chart from Tradingview.com

Key takeaways
- Ether is down 2% in the last 24 hours and is now trading below $4k.
- The bearish performance comes after Wednesday’s FOMC.
Ether drops below $4k on FOMC news
Ether, the second-largest cryptocurrency by market cap, has turned bearish after losing 2% of its value in the last 24 hours. The bearish performance saw Ether temporarily drop to the $3,800 mark, but it is now approaching $4k.
Yesterday’s sell pressure came after the FOMC meeting, with the Federal Reserve cutting interest rates by 25 basis points. However, Fed Chair Jerome Powell revealed that the apex bank will end quantitative tightening on December 1st.
This means that the Fed will reduce the financial assets it holds on its balance sheet by selling them into the financial markets, which decreases asset prices and raises interest rates. With this, it is highly unlikely that the Fed will cut interest rates in its next FOMC meeting in December.
Ethereum’s Fusaka upgrade, slated to bring increased scalability and security improvements, successfully debuted on Hoodi on Tuesday, the third and final testnet before mainnet launch. This launch didn’t push ETH’s price higher in the near term due to the broader crypto market volatility.
ETH could bounce back above $4,200 soon
The ETH/USD 4-hour chart remains bearish and efficient as Ether is down 2% in the last 24 hours. It is now trading at $3,939 per coin and could rally higher in the near term.
The technical indicators remain bearish but are showing signs of recovery following the recent dip. The RSI of 46 shows that the bearish trend is fading, with the bulls set to push its price higher over the next few hours and days. The MACD lines are also within the negative territory after flashing a sell signal on Wednesday.
If the recovery continues, ETH could reclaim the resistance level at $4,232 over the next few hours or days. An extended rally would allow ETH to hit the 4-hour ILQ at $4,409. However, failure to climb above $4,200 in the near term could see ETH retest the $3,800 low in the coming hours or days.
Reason to trust
![]()
Strict editorial policy that focuses on accuracy, relevance, and impartiality
Created by industry experts and meticulously reviewed
The highest standards in reporting and publishing
Strict editorial policy that focuses on accuracy, relevance, and impartiality
Morbi pretium leo et nisl aliquam mollis. Quisque arcu lorem, ultricies quis pellentesque nec, ullamcorper eu odio.
Crypto analyst Crypto Inside has provided a bullish outlook for the PEPE meme coin. The analyst predicted that it could witness a 150% surge as it looks to grab the liquidity above its current range.
PEPE Eyes Rally To $0.000025 In Bid To Grab Liquidity Above
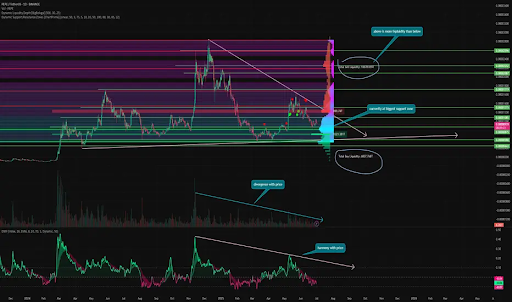
In a TradingView post, Crypto Inside shared an accompanying chart in which he predicted that PEPE could jump to as high as $0.000025 following its reclaim of the $0.000010 support zone. He explained that this price surge could occur because there is currently more liquidity above than below.
Related Reading
The chart showed that there is a total sell liquidity of 10,678.659 trillion around this $0.00025 range. Meanwhile, the total buy liquidity for PEPE below its current crucial support zone is 6,827.768 trillion. It is worth mentioning that a rally to $0.000025 will bring the meme coin close to its current all-time high (ATH) of $0.00002825.
Crypto Inside touched on the meme coin’s liquidity depth. The analyst stated that the price moves from one liquidity to another and that this is the meme coin’s fuel. He remarked that there is significantly more of this fuel accumulated at the top, alluding to the sell liquidity.
The analyst added that PEPE has always been a highly speculative asset, and during prolonged one-sided movements, extremely high funding is formed in it. This, he noted, provokes sharp jumps in price.
Crypto Inside also commented on the current PEPE price action. He noted that the meme coin has now reached the largest zone of interest at $00.0000817 and is trying to consolidate there. He remarked that this is a powerful level around which consolidation can be expected before further growth. However, he warned that if the PEPE price falls below it without the possibility of returning, it will be an extremely bearish signal.
The Meme Coin’s Narrative Is Still Strong
As part of his analysis, Crypto Inside suggested that PEPE’s narrative is still strong, which is why the meme coin still has a chance to reach new highs. He explained that the narrative itself is still important in meme coins and that PEPE is an “eternal meme,” which will live forever. He added that it is the embodiment of meme culture in the world.
Related Reading
The analyst assured market participants that there is no need to fear PEPE’s oblivion. He declared that it will definitely not die as a narrative and that there is nothing to worry about. However, he admitted that new meme coins like Fartcoin have stretched liquidity across the market, and many have left PEPE for “new shiny things.”
At the time of writing, the PEPE price is trading at around $0.00001056, over 11% in the last 24 hours, according to data from CoinMarketCap.
Featured image from Medium, chart from Tradingview.com
Now or Never for Bitcoin (BTC) Price, Shiba Inu (SHIB) Finally Bouncing, Solana (SOL): Is Something Wrong? Investing.com
Source link ]]>
Now or Never for Bitcoin (BTC) Price, Shiba Inu (SHIB) Finally Bouncing, Solana (SOL): Is Something Wrong? U.Today
Source link ]]>
Solana Updates: SOL & Cardano (ADA) Holders Come Bouncing Back For Panshibi (SHIBI) Opening Sale CryptoDaily
Source link ]]>
Cardano Price Eyes Breakout To $6 After Bouncing From 43% Drawdown NewsBTC
Source link ]]>
Memecoin Market Is Seen Bouncing Back! Dogecoin (DOGE) And Cutoshi (CUTO) Seen At The Forefront Preparing For Price Explosion: Guest Post by Optimisus CoinMarketCap
Source link ]]>
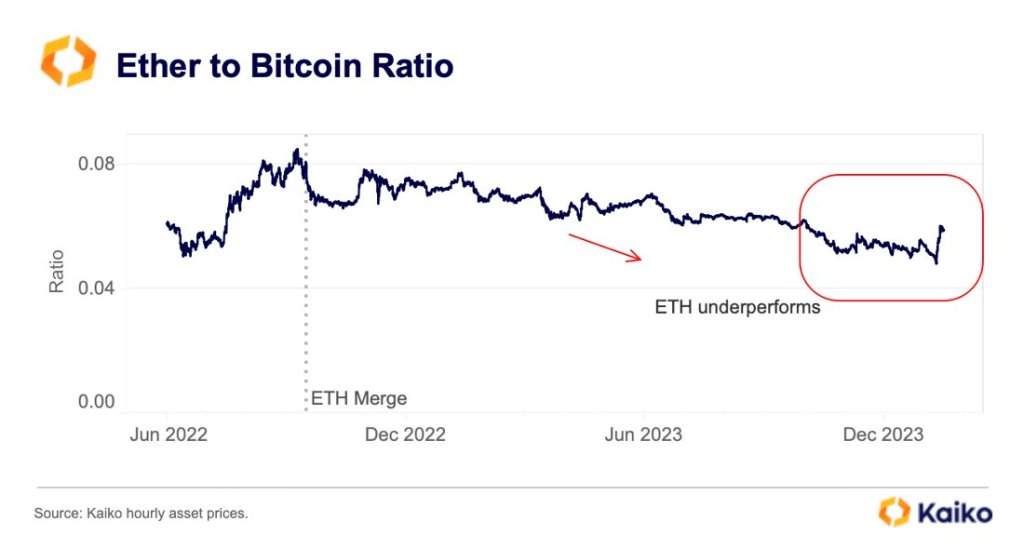
Amidst a volatile crypto market, Ethereum (ETH) is gaining momentum, outperforming its long-time rival Bitcoin (BTC). According to Kaiko data, the ETH/BTC ratio has steadily risen, rebounding from multi-year lows.
ETH/BTC Ratio Rising, ETH Momentum Building
The ETH/BTC ratio technically gauges market sentiment towards these two leading crypto. The recent rebound indicates investors are increasingly bullish on Ethereum’s potential relative to Bitcoin.
This upward trajectory is fueled by growing optimism surrounding the potential approval of spot Ethereum ETFs and the general confidence that markets will trend higher in 2024. The prospect of this product entering the market has also injected fresh energy into the ETH ecosystem, lifting the second most valuable coin by market cap.
Related Reading: Institutional Inflows Into XRP Surges 244% Amid ETF Speculation
After protracted lower lows, the ETH/BTC ratio began rising immediately after the United States Securities and Exchange Commission (SEC) approved 11 spot Bitcoin ETFs last week. This unexpected shift, analysts observe, is primarily because of increasing confidence in the SEC approving a similar product for ETH.
Spot Ethereum ETFs, which would provide direct exposure to the Ethereum market, would make it easier for institutional investors to benefit from the volatility of ETH. So far, the SEC has approved an Ethereum Futures ETF, which, unlike the spot ETF, tracks an index, not the direct price of this asset.
Blackrock is among the leading Wall Street giants interested in issuing a spot Ethereum ETF. Considering its history of success, the decision by one of the world’s leading asset managers to apply for this product is an endorsement of its prospects. Earlier, Larry Fink, the CEO of BlackRock, said Ethereum, despite its scaling challenge, might spearhead the tokenization drive in the years ahead.
US SEC Yet To Clarify Whether Ethereum Is A Commodity Or Security
Even so, the SEC has yet to clarify whether ETH, a coin pre-mined with some assets distributed to the Ethereum Foundation, is a commodity like Bitcoin. Earlier, Gary Gensler, the chairperson of the SEC, was cornered by the United States policymakers to give the agency’s stand on the coin but didn’t.
Nonetheless, with the prospect of spotting Ethereum ETFs and the dominance of Ethereum in decentralized finance (DeFi) and non-fungible tokens (NFTs), ETH will likely continue outperforming BTC in the coming months. Price action data shows that ETH is already up 20% versus BTC in the past trading week.
Feature image from Canva, chart from TradingView
Disclaimer: The article is provided for educational purposes only. It does not represent the opinions of NewsBTC on whether to buy, sell or hold any investments and naturally investing carries risks. You are advised to conduct your own research before making any investment decisions. Use information provided on this website entirely at your own risk.