
Ethereum and Solana are gradually demonstrating bullish movements following a rebound on Tuesday, but the broader outlook still appears to be bearish. On-chain metrics are flashing caution as selling pressure continues to dominate among investors of ETH and SOL, suggesting an extension of the ongoing volatile market.
Market Balance Tilts Bearish For Ethereum And Solana
While the broader cryptocurrency market has faced steady downside pressure over the past few weeks, the market dynamics of both Ethereum and Solana are undergoing a crucial shift. This shift is being reflected in the Buy/Sell Pressure Delta for ETH and SOL, which has recently turned negative.
The Buy/Sell Pressure Delta is a key metric that measures the imbalance between buying and selling forces in the market. It is worth noting that when the delta goes negative, it indicates a lack of bullish momentum since selling pressure is greater than purchasing pressure.
According to Alphractal, an advanced on-chain data analytics platform, the metric flipping negative suggests that Ethereum and Solana sellers are gaining control of the market. With buying momentum currently fading, the risk of short-term downside or consolidation becomes high.

This shift typically points to trend exhaustion, not necessarily an immediate reversal. It also points to a cooling phase after periods of stronger momentum and buying activity. In some scenarios from the past, the platform highlighted that a negative Buy/Sell Pressure Delta has also led to price bottoms. However, this is mostly common when selling pressure starts to lose strength again, with capital flows favoring accumulation over distribution.
Furthermore, Alphractal noted that for this ongoing trend to signal a potential bottom in Ethereum and Solana prices, it is critical to monitor whether the delta is exhibiting stability or a recovery, rather than expanding further into negative territory. In the meantime, analyzing the lower timeframes would aid in spotting early signs of a shift back toward buying pressure.
At this point, it is not a standalone signal, and context matters. Price action, volume, and broader on-chain data must confirm whether the market is transitioning into a period of continuation or accumulation. As this imbalance develops across the two networks, it increases the downside risk and emphasizes how crucial it is to keep an eye on whether demand can stabilize or keep declining in the upcoming sessions.
ETH Position Inside A Dense Basis Cluster
Ethereum remains capped by the growing volatility across the crypto market, hovering below the $3,000 price mark. After delving into ETH’s recent price action, Chris Beamish has outlined that the leading altcoin is trading on a dense cost basis cluster.
The positioning carries significance as it represents a breakeven zone for many ETH holders. As ETH holds this zone, the market is leaning toward absorption and the formation of a base. However, a breakdown would move the price into thinner support where underwater supply may derisk.
Featured image from Pixel Plex, chart from Tradingview.com
Editorial Process for bitcoinist is centered on delivering thoroughly researched, accurate, and unbiased content. We uphold strict sourcing standards, and each page undergoes diligent review by our team of top technology experts and seasoned editors. This process ensures the integrity, relevance, and value of our content for our readers.
The price of Ethereum had quite a rough performance over the past week, falling from its usual range above the $4,600 level to below $4,500. Despite the injection of bullish momentum into the market by the US Federal Reserve’s interest rate cut, the “king of altcoins” failed to sustain its rally back to the $4,600 region.
According to the latest on-chain data, the Ethereum price could be gearing up for an even longer time in the cold, as investors seem to be turning away from the second-largest cryptocurrency by market cap. The question, though, is how deep the price of ETH will fall in the coming weeks?
ETH Price At Risk Of Return To $1,500?
In a recent post on the social media platform X, pseudonymous crypto analyst Darkfost revealed that the Ethereum investors might be flooding out of the market at the moment. This observation is based on the recent downturn in the ETH Taker Buy-Sell Ratio on the world’s largest crypto exchange by trading volume.
Related Reading
The Taker Buy-Sell Ratio is an on-chain indicator that compares the proportion of the taker buy volumes to the taker sell volumes on crypto exchanges. When the value of this metric is greater than one, it signals that the taker buy volume is higher than the taker sell volume on a crypto exchange. This trend typically points to the willingness of more traders to purchase coins at a higher value on the trading platform.
Meanwhile, a less-than-one value for the Taker Buy-Sell Ratio typically means that the taker sell volume is higher than the taker buy volume on the exchange. Ultimately, this low value indicates that more sellers are offloading their assets at a lower price, precipitating bearish pressure in the market.
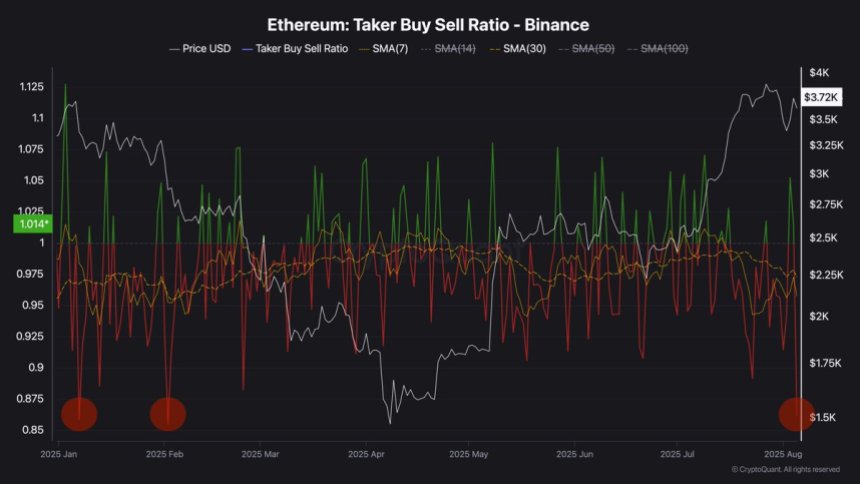
According to data from CryptoQuant, the Ethereum Taker Buy-Sell Ratio fell below the 1 threshold to around 0.87 on Friday, September 19. This latest decline marked the third time this metric has fallen this low so far in 2025.

As observed in the above chart, Darkfost noted that the indicator fell as low as 0.85 in January and February 2025. This ratio decline coincided with the bearish trend, during which the price of Ethereum fell to around the $1,500 region.
As of the time of publishing their post on X, Darkfost revealed that the 7-day average of the Taker Buy-Sell Ratio stood at 0.93, which is still short of the 1 threshold. The on-chain analyst concluded that while the Ethereum price is looking to break above the $5,000 milestone, more investors seem to be increasingly betting against the altcoin’s rally.
Although it is highly unlikely to see a downturn similar to the one in 2025’s first quarter, the latest on-chain events suggest that the price of ETH could still face some bearish pressure in the coming weeks.
Ethereum Price At A Glance
As of this writing, the price of ETH stands at around $4,475, reflecting a mere 0.4% leap in the past 24 hours.
Related Reading
Featured image from iStock, chart from TradingView
Ethereum (ETH) has been facing heightened volatility over the past week, following a sharp correction from its recent local high at $3,940 down to $3,360. After weeks of aggressive buying activity and bullish momentum, the market is now showing signs of fatigue. Analysts are growing cautious, with many warning that a deeper correction could be imminent if Ethereum fails to reclaim key support zones.
Related Reading
Adding to these concerns, fresh data reveals a significant shift in market dynamics. The taker buy/sell ratio — a key indicator that tracks the aggressiveness of buyers versus sellers — has sharply declined into negative territory today. This signals that sellers are currently dominating the order books, applying sustained pressure on ETH’s price action.
While some view this as a typical cooldown phase after a major rally, others believe Ethereum is entering a riskier phase where bearish sentiment could intensify if support fails to hold. The coming days will be critical in determining whether ETH stabilizes around current levels or slides further into correction territory.
Ethereum Faces Short-Term Selling Pressure
According to top analyst Darkfost, Ethereum’s taker buy/sell ratio has dropped sharply into negative territory today, reaching 0.87—one of the lowest levels recorded since the start of the year. This metric, which measures the ratio of aggressive buyers to sellers in futures markets, reveals that selling pressure is now firmly in control of ETH’s order books.
Although today’s data is still incomplete, the current reading already indicates a dominance of sell orders on Ethereum futures. Darkfost notes that this shift has been developing for several weeks. Since July 18th, the taker buy/sell ratio has been mostly negative, which correlates with Ethereum’s recent inability to break through key resistance levels and its transition into a short-term consolidation phase.
While this may seem concerning for bullish traders, Darkfost emphasizes that such consolidations are a normal part of market cycles, especially after a strong rally. He suggests that Ethereum could face a challenging period in the short term, as market sentiment remains fragile and sellers continue to control intraday movements.
Related Reading
However, this phase might offer a healthy foundation for the next leg up. If Ethereum manages to stabilize and consolidate above critical support zones, the broader trend remains favorable. Long-term fundamentals, including on-chain accumulation and growing institutional interest, still point toward upside potential once this phase of selling pressure eases.
Price Analysis: Bulls Attempt Recovery After Sharp Decline
Ethereum is currently trading at $3,654.60, attempting to stabilize after a sharp correction from its recent highs around $3,940. The 4-hour chart shows a recovery bounce that met resistance near the 50-period SMA (currently at $3,668.28), signaling that bulls are facing strong selling pressure at this level.
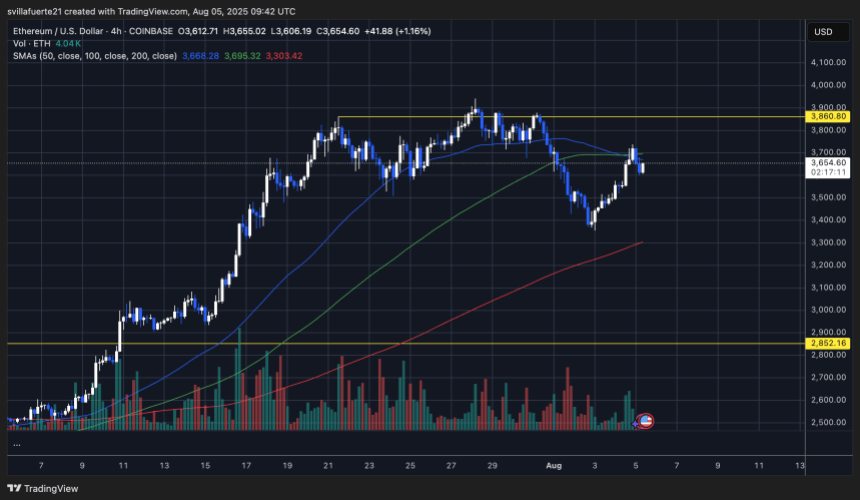
Despite the bounce, ETH remains below the key horizontal resistance at $3,860.80, which has capped multiple upward attempts in recent weeks. The bullish attempt to reclaim momentum earlier today was rejected near this level, leading to a quick retracement back into the $3,600-$3,650 zone.
The 100-period SMA (green line) at $3,695.32 is acting as dynamic resistance, while the 200-period SMA (red line) at $3,303.42 serves as a longer-term support level should the correction deepen.
Related Reading
Volume spikes indicate that buyers are stepping in aggressively on dips, but overall, Ethereum remains in a short-term consolidation phase between $3,850 and $3,350. A decisive breakout above $3,860.80 is required to regain bullish momentum, while failure to hold above $3,600 could expose ETH to another retest of lower support levels around $3,300-$3,350.
Featured image from Dall-E, chart from TradingView

The Binance spot market data shows that buyers are finally outpacing sellers for the first time in months. Notably, the shift is catching attention across the crypto market as Bitcoin holds strong above key price levels. As the biggest trading platform, the change in volume might have a major impact on the outlook of Bitcoin and the altcoin.
The Binance CVD Analysis
Data from CryptoQuant disclosed that the Cumulative Volume Delta (CVD) of crypto exchange Binance has been trending upward since Bitcoin dropped to around $75,000. According to the update, this metric tracks the net difference between buying and selling orders.
Analyst Joao Wedson shared charts showing that while the Binance CVD has turned positive, other exchanges like OKX, Bybit, HTX Global, BitMEX, and Deribit still show declines.
Binance Spot Buying Volume Rises Above Selling Volume for the First Time in Six Months
For the first time in six months, spot buying volume on Binance is rising again relative to selling volume.
Since the $75k USD bottom, the CVD (Cumulative Volume Delta) has been trending… pic.twitter.com/8c3j34xMzW
— Joao Wedson (@joao_wedson) April 28, 2025
It is worth noting that this marks a break from the pattern seen since 2021, when positive growth on Binance had been rare. Based on the current market outlook, the rise in CVD aligns with the Bitcoin price surge toward $94,000 by late April.
Joao Wedson also emphasized that a rising CVD shows more substantial buying pressure and growing confidence among traders. He advised monitoring this trend closely as it offers valuable insights into risk appetite on the exchange.
Is Demand Rising for Bitcoin?
Beyond Binance, several other signs suggest that demand for the largest digital asset, Bitcoin, is gaining momentum.
According to CoinShares, digital asset investment products from top asset management companies recorded $3.4 billion in inflows over the past week.
CoinGape reported that BTC inflow topped $3 billion. Ethereum also posted inflows of $183 million after weeks of outflows. If anything, this shows a renewed interest of investors in acquiring and trading major cryptocurrencies.
Reports indicate that corporate interest in Bitcoin is heating up. Strategy Inc’s recent purchase of 15,355 Bitcoin for $1.42 billion further signals strong institutional demand. Whales have also been active, with a major buyer acquiring $110 million of Bitcoin and Ethereum via over-the-counter transactions.
Drawing on these trends, Presto executive Peter Chung reaffirmed a $210,000 Bitcoin price target for 2025. The forecast highlights institutional adoption and global liquidity growth as key drivers.
Key Market Trends to Watch
While Bitcoin might be the biggest asset in the spotlight, other key market trends could also shape the overall health of the industry. The demand for SEC approvals of digital asset ETFs remains on the agenda. Recently, the SEC approved the first XRP futures-based ETF with sizable volume scored in 30 minutes.
Also, beyond Binance, market data shows that Bitcoin whales and sharks are active, while bullish on-chain metrics further support the positive outlook.
CoinMarketCap data shows that Bitcoin’s price was trading at around $94,011.77 as of this writing. It has inked a 1.16% growth in the last 24 hours, and trading volume has also risen 71.62% over the same period. The confluence of metrics suggests more uptick is likely.
The post Binance Spot Volume Faces Positive Buy-Sell Imbalance, Is Demand for Bitcoin Rising? appeared first on CoinGape.
]]>The price of Bitcoin has not shown any serious momentum so far in 2025 besides briefly surpassing the $108,000 level in mid-January. On the contrary, the flagship cryptocurrency has suffered some significant corrections over the past few weeks.
The most recent pullback saw the BTC price heavily slump toward $92,000 after US President Donald Trump introduced new trade tariffs on Canada, Mexico, and China earlier this week. While the Bitcoin price quickly recovered above $100,000, it has since struggled to sustain any bullish momentum — currently trading around $96,500.
HTX And BitMEX Users Load Their Bitcoin Bags — What We Know
Prominent crypto analyst Ali Martinez took to the X platform to share that certain centralized exchanges have witnessed increased buying activity. This on-chain observation is based on changes in the “taker buy/sell ratio,” which measures the taker buy and taker sell volumes for a particular asset (Bitcoin, in this case).
For clarity, the taker buy volume is higher than the taker sell volume when the value of the taker buy/sell ratio is greater than one. Typically, this scenario is considered bullish, as it suggests the willingness of investors to pay a higher price for a specific cryptocurrency (Bitcoin).
Contrastingly, a less-than-one value for the taker buy/sell ratio indicates that more sellers are willing to part with their assets at a lower price. This phenomenon implies that the sellers are overtaking the buyers, signaling a bearish investor sentiment in a particular crypto market.
According to Martinez’s post on X, the Bitcoin taker buy/sell ratio on the HTX and BitMEX exchanges experienced a notable upswing on Saturday, February 8. CryptoQuant data shows that the metric rose to around 5.7 on the BitMEX platform in the late hours of the day.
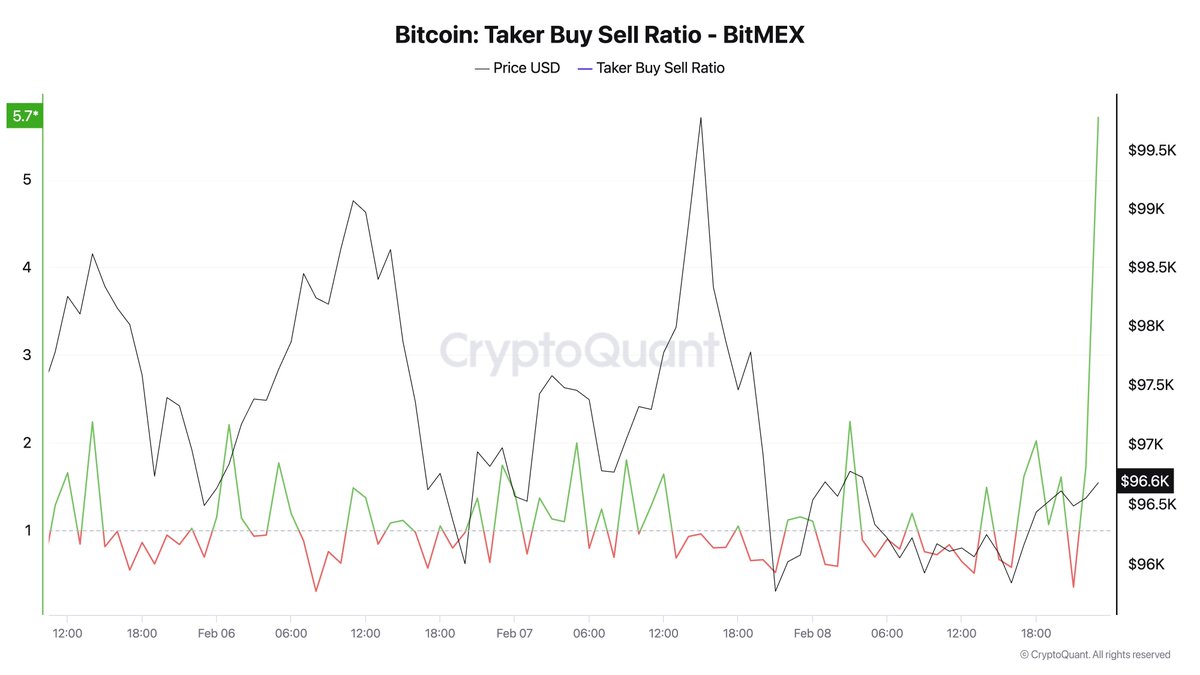
Similarly, the Bitcoin taker buy/sell ratio climbed to as high as 16 on the HTX exchange on Saturday before later crashing down toward 0.4. Nonetheless, this piece of on-chain data indicates a spike in buying activity on the centralized trading platforms.
Fresh buying activity on crypto exchanges could be bullish for the Bitcoin price, which has lacked the bite needed to sustain any upward movement. As of this writing, the premier cryptocurrency is valued at around $96,700, reflecting no significant price change in the past 24 hours.
Is It Time To Buy BTC?
In a separate post on X, Martinez suggested that it might be time for investors to dabble back into the BTC market. The rationale behind this suggestion is based on how the crypto crowd is feeling at the moment.
Recent on-chain data shows that the crowd sentiment toward Bitcoin is negative right now. However, prices have been known to move in the crowd’s opposite direction several times in the past.
]]>Opeyemi is a proficient writer and enthusiast in the exciting and unique cryptocurrency realm. While the digital asset industry was not his first choice, he has remained absolutely drawn since making a foray into the space over two years. Now, Opeyemi takes pride in creating unique pieces unraveling the complexities of blockchain technology and sharing insights on the latest trends in the world of cryptocurrencies.
Opeyemi savors his attraction to the crypto market, which explains why he spends the better parts of his day looking through different price charts. “Looking” is a rather simple way to describe analyzing and interpreting various price patterns and chart formations. However, it appears that is not Opeyemi’s favorite part – in fact, far from it.
Being able to connect what happens on a price chart to on-chain movements and blockchain activities is what keeps Opeyemi ticking. “This emphasizes the intricacies of blockchain technology and the cryptocurrency market,” he would say. Most importantly, Opeyemi thinks of any market insights as the gospel, while recognizing that he is only a messenger.
When he is not clicking away at his keyboard, Opeyemi is most definitely listening to music, playing games, reading a book, or scrolling through X. He likes to think he is not loyal to a particular genre of music, which can be true on many days. However, the fast-rising Afrobeats genre is a staple in Opeyemi’s Spotify Daily Mix.
Meanwhile, Opeyemi is a voracious reader who enjoys a wide category of books – ranging from science fiction, fantasy, and historical, to even romance. He believes that authors like George R. R. Martin and J. K.
Rowling are the greatest of all time when it comes to putting pen to paper. Opeyemi believes his reading of the Harry Potter series twice is proof of that.
Indeed, Opeyemi enjoys spending most of his time within the four walls of his home. However, he also sometimes finds solace in the company of his friends at a bar, a restaurant, or even on a stroll. In essence, Opeyemi’s ambivert (haha! been searching for an opportunity to use the word to describe myself) nature makes him a social chameleon who is able to quickly adapt to different settings.
Opeyemi recognizes the need to constantly develop oneself in order to stay afloat in a competitive and ever-evolving market like crypto. For this reason, he is always in learning mode, ready to pick up the slightest lesson from every situation. Opeyemi is efficient and likes to deliver all that is required of him in time – he believes that “whatever is worth doing at all is worth doing well.” Hence, you will always find him striving to be better.
Ultimately, Opeyemi is a good writer and an even better person who is trying to shed light on an exciting world phenomenon – cryptocurrency. He goes to bed every day with a smile of satisfaction on his face, knowing that he has done his bit of the holy assignment – spreading the crypto gospel to the rest of the world.
The price of Bitcoin has somewhat cooled off, struggling to reach the highly-coveted $100,000 mark, after an intense bullish run all week long. However, investors appear to be undeterred by the sluggish price action of the premier cryptocurrency in the past few days.
Bitcoin Taker Buy/Sell Ratio Is Rising — Impact On Price
In a November 23 post on the X platform, prominent crypto analyst Ali Martinez shared that traders have taken to loading their bags with Bitcoin in recent days. This on-chain observation is based on the “taker buy/sell ratio,” which tracks the taker buy and taker sell volumes for a specific cryptocurrency.
A greater-than-one value of the taker buy/sell ratio suggests that the taker buy volume is higher than the taker sell volume. This is usually considered a bullish signal, which suggests the willingness of investors to pay a higher price for a particular cryptocurrency (Bitcoin, in this case).
Related Reading
In contrast, when the metric’s value is less than 1, it means that more sellers are willing to sell their assets at a lower price. Typically, this indicates a bearish sentiment amongst investors, as the selling pressure is overshadowing the buying pressure in the specific market.
Martinez highlighted in his post on X that the Bitcoin taker buy/sell ratio across major trading platforms, including Binance, OKX, HTX, and Bybit, has witnessed a significant surge in the past day. As shown in the chart below, the metric spiked to a value of over 28 on Binance, the world’s largest exchange.
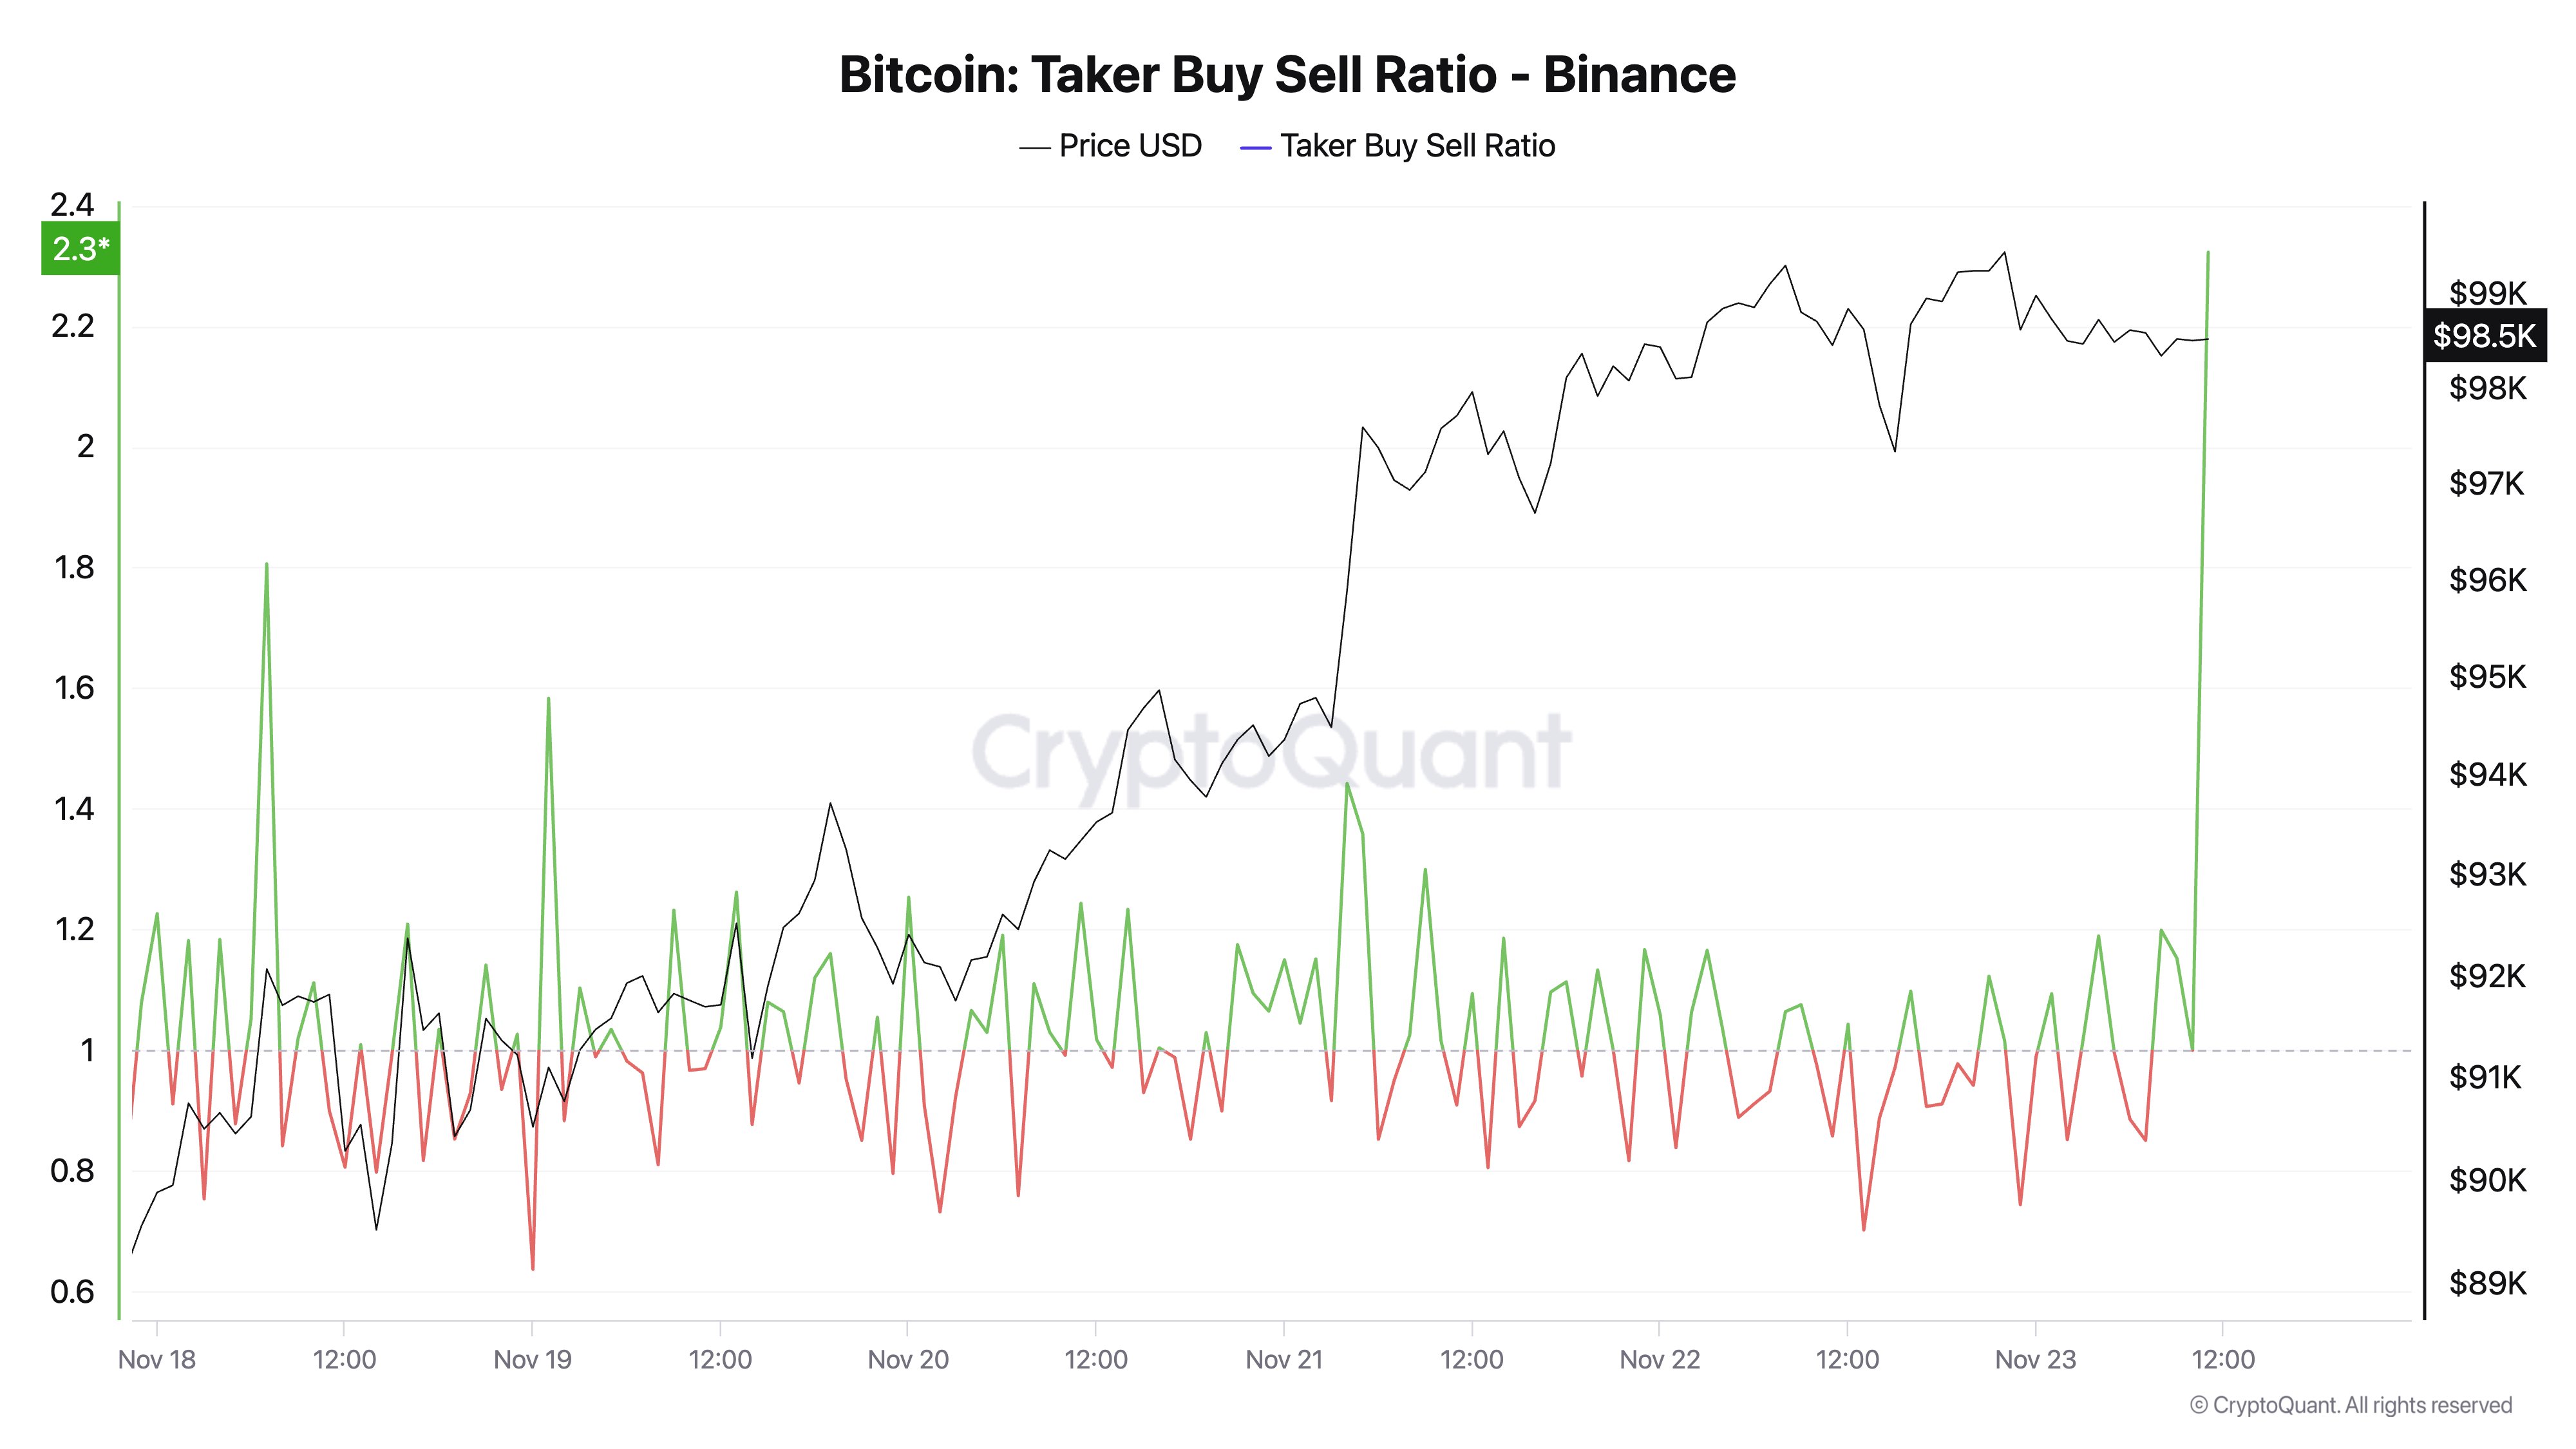
Similarly, the Bitcoin taker buy/sell ratio climbed well above the 1 threshold, showing the mounting buying pressure in the open market. This level of intense buying activity could ensure that the premier cryptocurrency continues its rally toward the $100,000 milestone.
As of this writing, the price of BTC stands around $97,800, reflecting a 1.1% decline in the last 24 hours. Nevertheless, the flagship cryptocurrency’s performance on the weekly timeframe is still impressive. According to CoinGecko data, BTC is up by nearly 8% in the past week.
Who Is Buying?
In another post on the X platform, Martinez revealed that a notable cohort of large investors (also known as whales) have been active in the Bitcoin market in the past few days. This class of whales involved here are those holding between 100 and 1,000 coins.
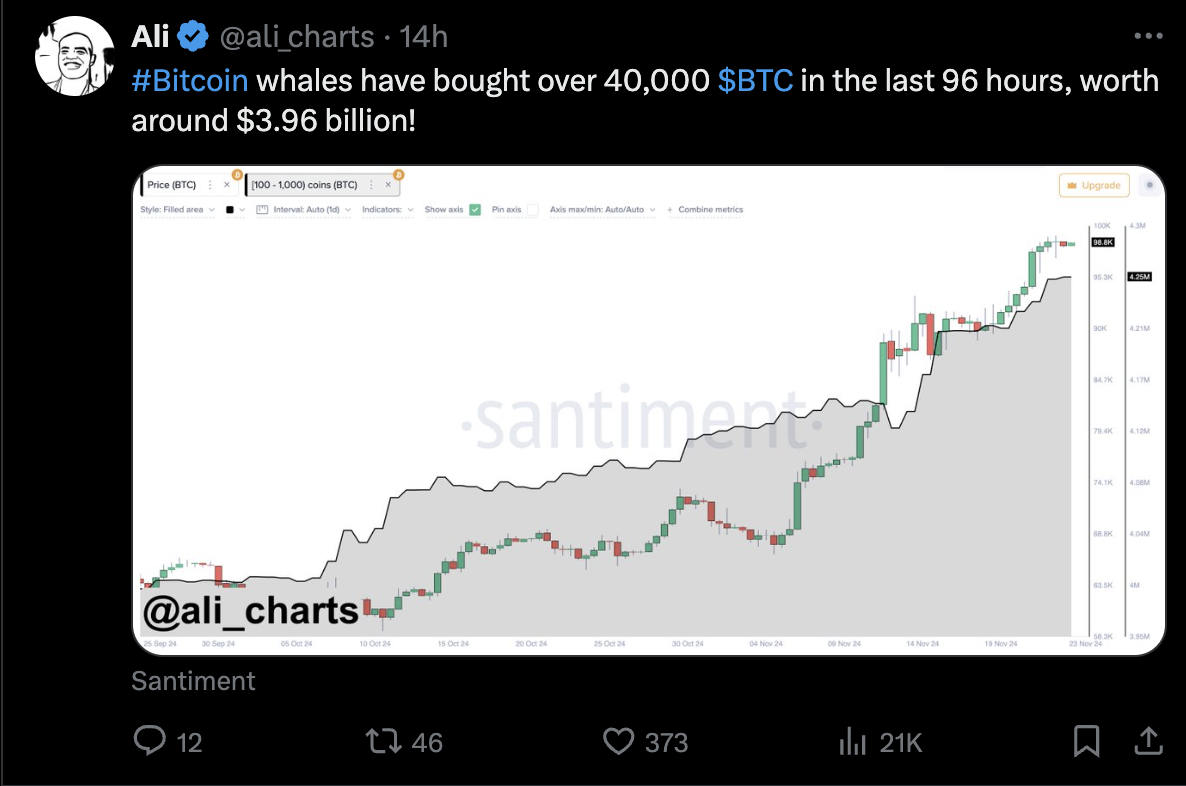
According to data from Santiment, whales have purchased more than 40,000 BTC (equivalent to around $3.96 billion) in the past four days. Considering their influence on market dynamics, this buying activity from the Bitcoin whales could be bullish for price.
Related Reading
Featured image from iStock, chart from TradingView
Opeyemi is a proficient writer and enthusiast in the exciting and unique cryptocurrency realm. While the digital asset industry was not his first choice, he has remained absolutely drawn since making a foray into the space over two years. Now, Opeyemi takes pride in creating unique pieces unraveling the complexities of blockchain technology and sharing insights on the latest trends in the world of cryptocurrencies.
Opeyemi savors his attraction to the crypto market, which explains why he spends the better parts of his day looking through different price charts. “Looking” is a rather simple way to describe analyzing and interpreting various price patterns and chart formations. However, it appears that is not Opeyemi’s favorite part – in fact, far from it.
Being able to connect what happens on a price chart to on-chain movements and blockchain activities is what keeps Opeyemi ticking. “This emphasizes the intricacies of blockchain technology and the cryptocurrency market,” he would say. Most importantly, Opeyemi thinks of any market insights as the gospel, while recognizing that he is only a messenger.
When he is not clicking away at his keyboard, Opeyemi is most definitely listening to music, playing games, reading a book, or scrolling through X. He likes to think he is not loyal to a particular genre of music, which can be true on many days. However, the fast-rising Afrobeats genre is a staple in Opeyemi’s Spotify Daily Mix.
Meanwhile, Opeyemi is a voracious reader who enjoys a wide category of books – ranging from science fiction, fantasy, and historical, to even romance. He believes that authors like George R. R. Martin and J. K.
Rowling are the greatest of all time when it comes to putting pen to paper. Opeyemi believes his reading of the Harry Potter series twice is proof of that.
Indeed, Opeyemi enjoys spending most of his time within the four walls of his home. However, he also sometimes finds solace in the company of his friends at a bar, a restaurant, or even on a stroll. In essence, Opeyemi’s ambivert (haha! been searching for an opportunity to use the word to describe myself) nature makes him a social chameleon who is able to quickly adapt to different settings.
Opeyemi recognizes the need to constantly develop oneself in order to stay afloat in a competitive and ever-evolving market like crypto. For this reason, he is always in learning mode, ready to pick up the slightest lesson from every situation. Opeyemi is efficient and likes to deliver all that is required of him in time – he believes that “whatever is worth doing at all is worth doing well.” Hence, you will always find him striving to be better.
Ultimately, Opeyemi is a good writer and an even better person who is trying to shed light on an exciting world phenomenon – cryptocurrency. He goes to bed every day with a smile of satisfaction on his face, knowing that he has done his bit of the holy assignment – spreading the crypto gospel to the rest of the world.
Semilore Faleti is a cryptocurrency writer specialized in the field of journalism and content creation. While he started out writing on several subjects, Semilore soon found a knack for cracking down on the complexities and intricacies in the intriguing world of blockchains and cryptocurrency.
Semilore is drawn to the efficiency of digital assets in terms of storing, and transferring value. He is a staunch advocate for the adoption of cryptocurrency as he believes it can improve the digitalization and transparency of the existing financial systems.
In two years of active crypto writing, Semilore has covered multiple aspects of the digital asset space including blockchains, decentralized finance (DeFi), staking, non-fungible tokens (NFT), regulations and network upgrades among others.
In his early years, Semilore honed his skills as a content writer, curating educational articles that catered to a wide audience. His pieces were particularly valuable for individuals new to the crypto space, offering insightful explanations that demystified the world of digital currencies.
Semilore also curated pieces for veteran crypto users ensuring they were up to date with the latest blockchains, decentralized applications and network updates. This foundation in educational writing has continued to inform his work, ensuring that his current work remains accessible, accurate and informative.
Currently at NewsBTC, Semilore is dedicated to reporting the latest news on cryptocurrency price action, on-chain developments and whale activity. He also covers the latest token analysis and price predictions by top market experts thus providing readers with potentially insightful and actionable information.
Through his meticulous research and engaging writing style, Semilore strives to establish himself as a trusted source in the crypto journalism field to inform and educate his audience on the latest trends and developments in the rapidly evolving world of digital assets.
Outside his work, Semilore possesses other passions like all individuals. He is a big music fan with an interest in almost every genre. He can be described as a “music nomad” always ready to listen to new artists and explore new trends.
Semilore Faleti is also a strong advocate for social justice, preaching fairness, inclusivity, and equity. He actively promotes the engagement of issues centred around systemic inequalities and all forms of discrimination.
He also promotes political participation by all persons at all levels. He believes active contribution to governmental systems and policies is the fastest and most effective way to bring about permanent positive change in any society.
In conclusion, Semilore Faleti exemplifies the convergence of expertise, passion, and advocacy in the world of crypto journalism. He is a rare individual whose work in documenting the evolution of cryptocurrency will remain relevant for years to come.
His dedication to demystifying digital assets and advocating for their adoption, combined with his commitment to social justice and political engagement, positions him as a dynamic and influential voice in the industry.
Whether through his meticulous reporting at NewsBTC or his fervent promotion of fairness and equity, Semilore continues to inform, educate, and inspire his audience, striving for a more transparent and inclusive financial future.
On-chain data shows the Bitcoin taker buy/sell ratio has been unable to give any real signal recently as the demand has remained low in the market.
Bitcoin Taker Buy/Sell Ratio Hasn’t Been Able To Catch Any Momentum Recently
As pointed out by an analyst in a CryptoQuant post, the taker buy/sell ratio hasn’t moved much above or below 1 since August 2022. The “Bitcoin taker buy/sell ratio” is an indicator that measures the ratio between the taker buy volume and the taker sell volume.
When the value of this metric is greater than one, it means the buy or the “long” volume is higher in the market right now. Basically, this means that there are more buyers willing to purchase BTC at a higher price currently, and thus the buying pressure is stronger.
On the other hand, values of the indicator under the threshold suggest the taker sell volume is more dominant at the moment. Such values imply a bearish sentiment is shared by the majority of the investors currently.
Naturally, the ratio being exactly equal to one indicates the taker buy and taker sell volumes are exactly equal right now, and therefore the market is evenly split between bullish and bearish mentalities.
Now, here is a chart that shows the trend in the 14-day simple moving average (SMA) Bitcoin taker buy/sell ratio over the last few years:
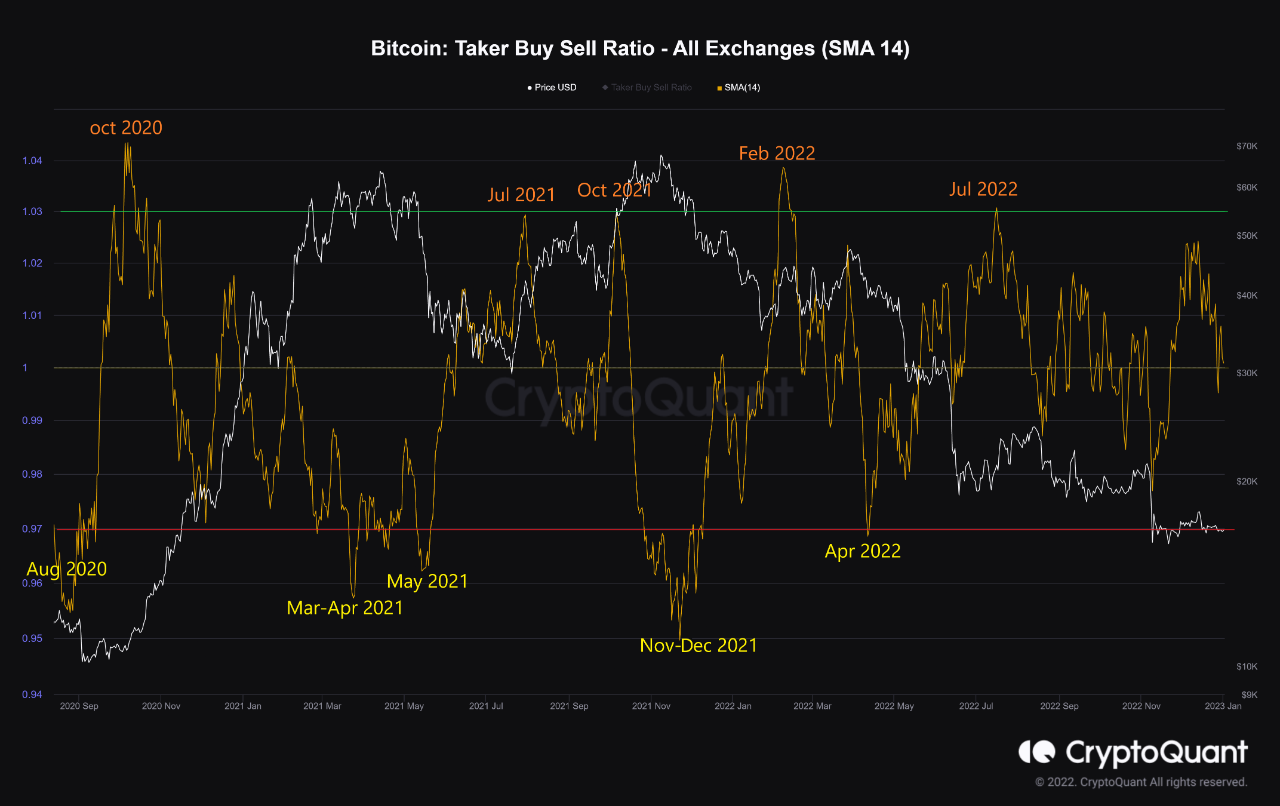
The 14-day SMA value of the metric seems to be close to 1 at the moment | Source: CryptoQuant
As you can see in the above graph, the quant has marked the relevant points of the trend for the 14-day SMA Bitcoin taker buy/sell ratio. It looks like whenever the indicator has crossed the 1.03 level, BTC has observed some bullish momentum shortly after.
On the contrary, whenever the ratio dipped below the 0.97 level, a bearish trend followed the crypto’s price. The last time this signal formed was back in April 2022, before the market observed the LUNA and 3AC collapses.
The bullish signal was last seen in July 2022, as the crypto built up towards its first relief rally of the bear market. Since then, however, there have been no other breaches of either of these levels, as is apparent from the chart.
In the period between then and now, the taker buy/sell ratio has been oscillating around 1, but the metric has just not been able to summon enough momentum to go all the way in either direction. “We cannot anticipate Bitcoin to move much as long as confidence – and subsequently demand – does not return to the market,” explains the analyst.
BTC Price
At the time of writing, Bitcoin is trading around $16,700, down 1% in the last week.

Looks like the value of the crypto has observed a small surge in the last 24 hours | Source: BTCUSD on TradingView
Featured image from Kanchanara on Unsplash.com, charts from TradingView.com, CryptoQuant.com