- Cardano price to drop after a minor pullback and align with the long-term bearish outlook.
- The descending triangle formation forecasts a 40% crash to $0.241.
- A daily candlestick close above $0.594 will invalidate the bearish outlook for ADA.
Cardano price shows an interesting outlook that could worsen things for its holders. The short-term outlook slowly aligns with the larger bearish picture of the cryptocurrency markets.
Cardano price on a lower time frame
Cardano price produced a higher high at $0.524 compared to the September 6 swing high at $0.512. While this outlook was bullish, it failed to sustain, leading to a steep 8.7% sell-off. However, the downswing has not yet created a lower low, aka liquidity fractal, that has been ongoing since June 19.
The possibility of a full-blow uptrend is unlikely as Cardano price is likely to pull back to $0.488 before taking another nosedive. The resulting downswing could knock ADA to the $0.433 support level, but the ideal liquidity run would be a sweep of the equal lows formed at $0.425.
This move, in total, would constitute a 13% drop in Cardano price.
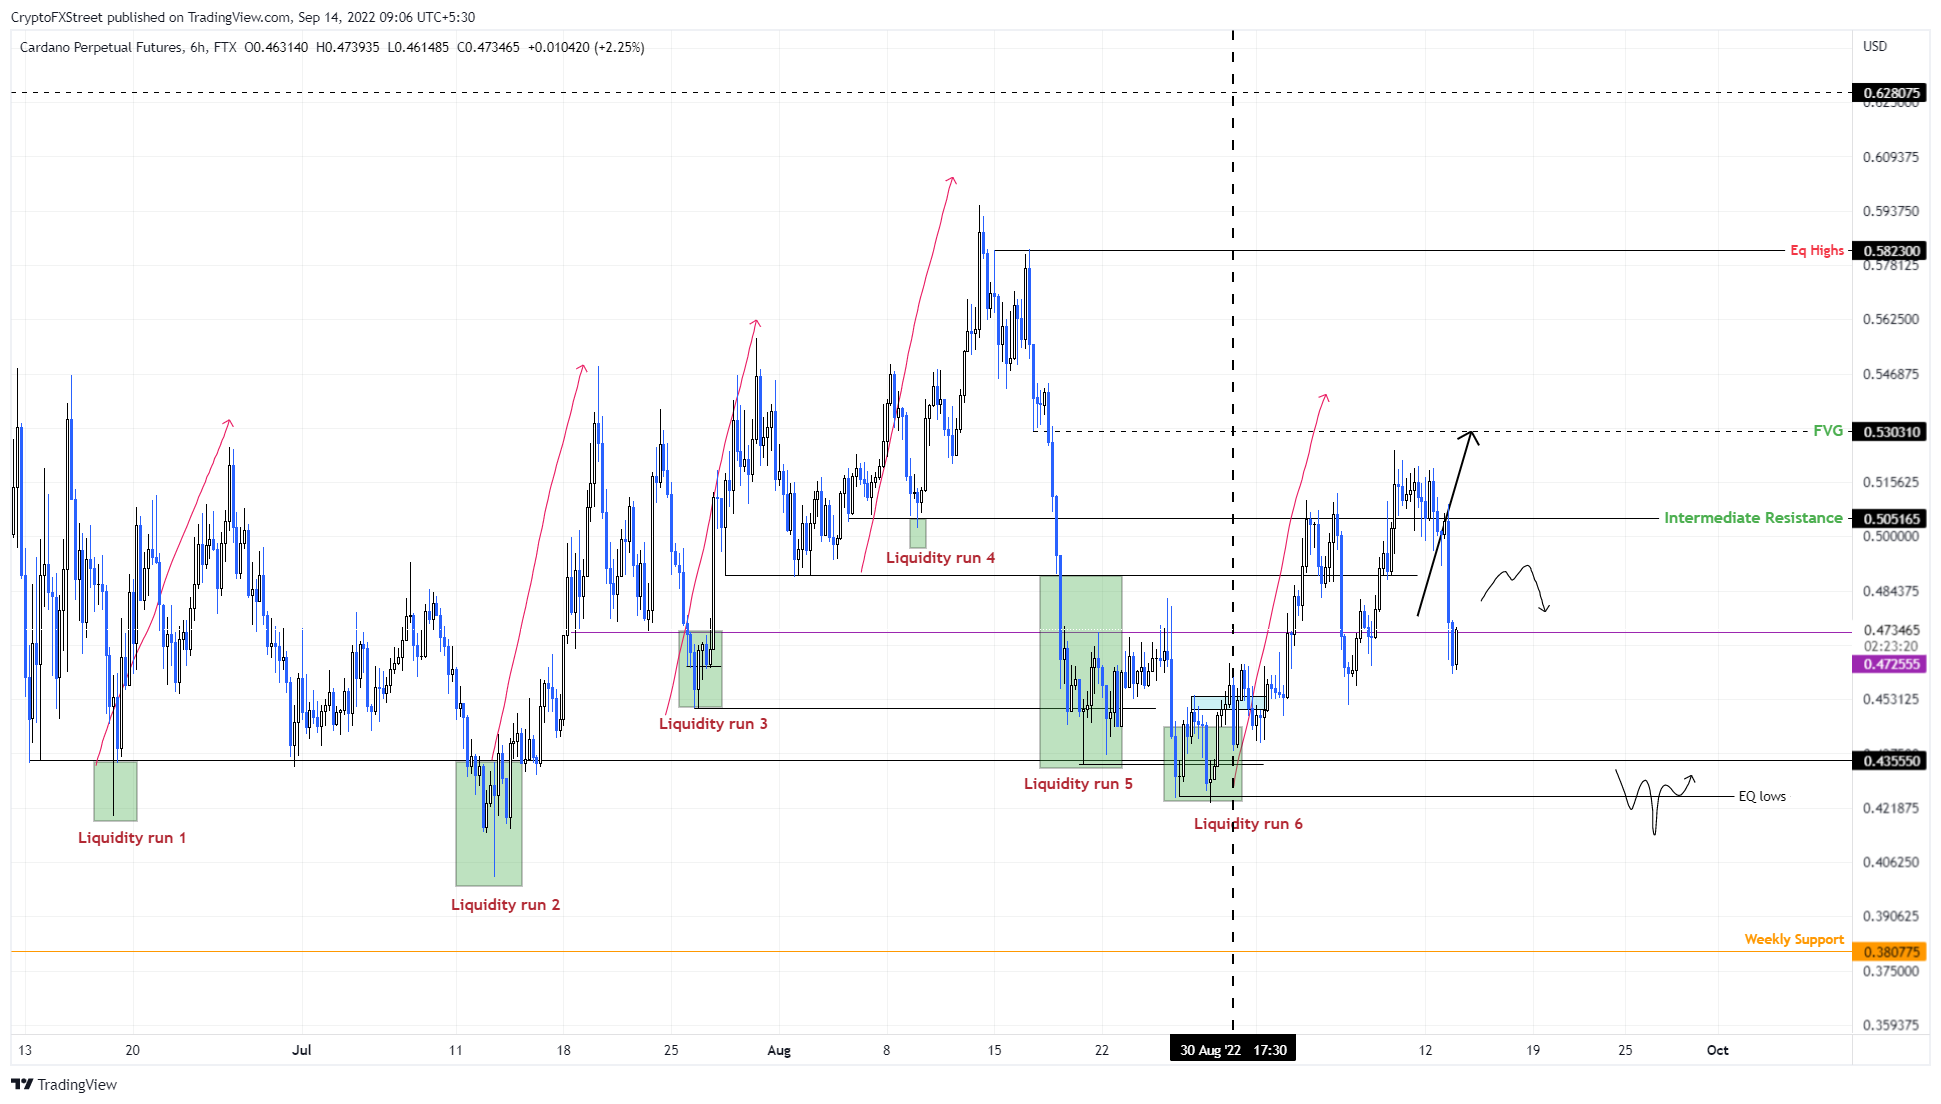
ADA/USDT 6-hour chart
While the short-term outlook for Cardano price reveals a bearish outlook, the long-term scenario takes it home. The three-day chart shows ADA forming a descending triangle with three lower highs and two equal lows at $0.40.
Connecting these swing points using trend lines shows that the descending triangle has been forming since May 10. This technical formation forecasts a 40% downswing to $0.241, obtained by adding the distance between the first swing high and swing low to the breakout point at $0.400.
Assuming Cardano price produces a three-day candlestick close below this level, it will signal a breakout and potentially trigger a 40% crash to $0.241.
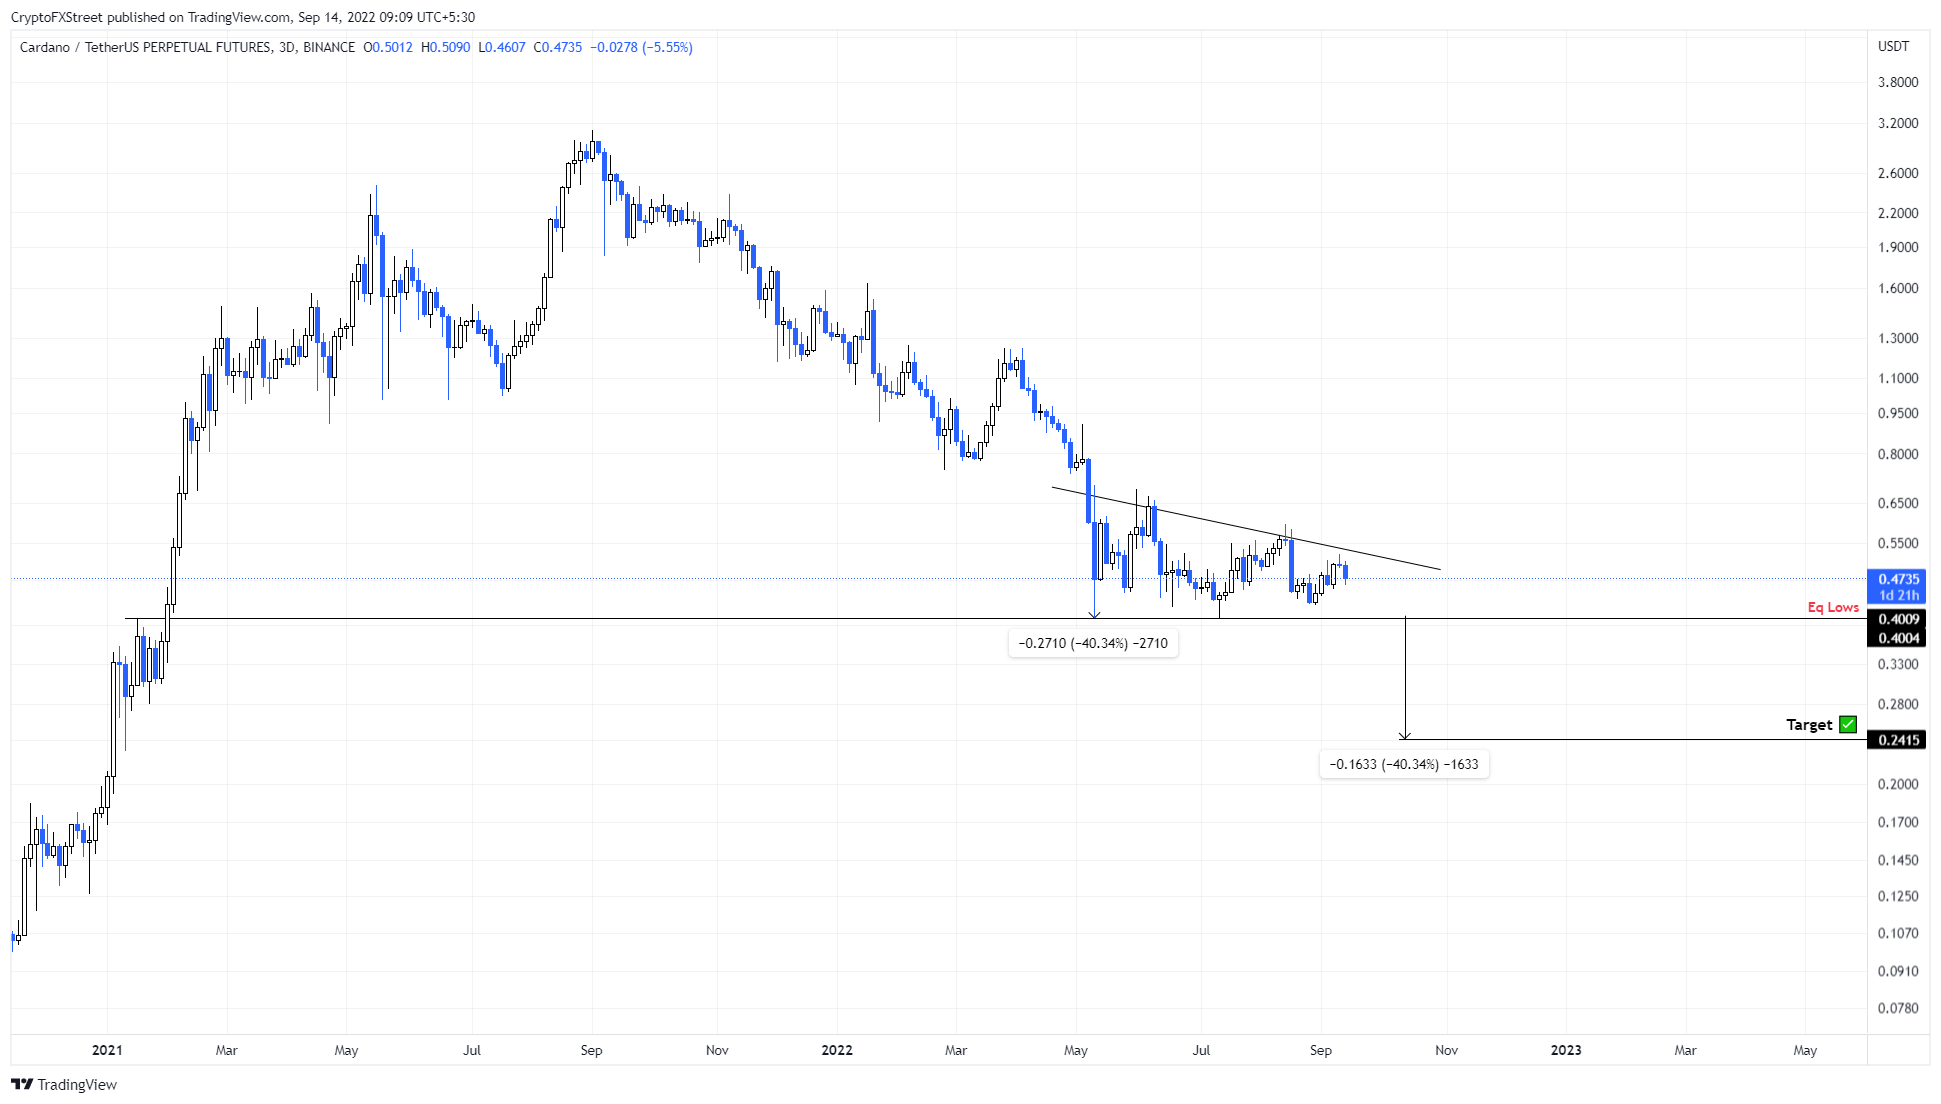
ADA/USDT 3-day chart
On the other hand, if Cardano price fails to break lower but instead climbs higher and produces a higher high above $0.594, it will invalidate the bearish outlook for ADA. In such a case, Cardano price could make a run for $0.700 and collect the buy-stop liquidity resting here.