Bitcoin’s recent price structure has not been easy to sit through. The price action has spent months moving sideways to lower, printing a series of bearish monthly closes since October that have placed the crypto sentiment in fear. That kind of slow pressure tends to feel worse than sharp sell-offs.
According to a crypto analyst, instead of treating the recent stretch as a warning sign of more declines to come, history shows that the Bitcoin price is much closer to a turning point than most participants realize.
The 2018 Parallel: Six Red Candles, Then A 4x Move
“With the ongoing panic, buying makes more sense here,” the analyst wrote, adding that Bitcoin could reach another all-time high following this move. The chart evidence they cite stretches back to late 2018 to early 2019, the only other time Bitcoin printed six straight red monthly candles.
Related Reading
This period between 2018 and 2019 is one of the most instructive chapters in Bitcoin’s price history, and what happened next reshaped the entire cycle.
From August 2018 through January 2019, Bitcoin closed six consecutive red monthly candles in a descent that took the price from about $7,700 all the way down to approximately $3,500. Sentiment had fully deteriorated, retail participants had largely capitulated, and to the average observer, the price action looked broken.
However, that was not the case. Those six months actually forced out weaker hands, absorbed persistent sell pressure, and quietly built the base for what came next. By May 2019, Bitcoin had surged to nearly $10,500, more than a 3x gain from its cycle lows. By June, it was pressing $13,000, representing more than a 4x return from the lows of that six-candle decline.

Bitcoin Price Chart. Source: @ourcryptotalk On X
A Familiar Pattern In A Very Different Market
Bitcoin’s current price action, while not identical, shares some of those characteristics. The current price play out looks much like that 2018/2019 sequence in structure, but the context is also more constructive.
Bitcoin’s consecutive red monthly candles since October 2025 brought the price from a peak above $126,000 down to lows below $70,000, which is a controlled pullback of over 45% from the high. Painful by conventional standards, but measured in the context of Bitcoin’s historical drawdowns.
Related Reading
As noted by the analyst, the candles are red, but they’re not impulsive. There’s no panic structure, just steady selling pressure that’s been absorbed over time. However, while retail sentiment has deteriorated across the multi-month decline, institutional buyers have been moving in the opposite direction. Strategy, the world’s largest corporate Bitcoin holder, has accumulated over 122,000 BTC during this period.

Bitcoin Price Chart. Source: @ourcryptotalk On X
If the 2019 recovery template applies at any comparable scale, a 3x to 4x move from recent lows would place Bitcoin somewhere between $180,000 and $250,000 in the months ahead. Even a more conservative 2x recovery from the $67,000 range would put the Bitcoin price trading at new all-time highs above $130,000 in the coming months.
Featured image created with Dall.E, chart from Tradingview.com
Dogecoin (DOGE) Price Prediction: $2 Billion Daily Volume Cannot Reverse Five Monthly Red Candles openPR.com
Source link ]]>
Cardano price rallies on bullish engulfing candles, why strength continues crypto.news
Source link ]]>
Shiba Inu Price Prediction: 9 Green Candles and a Golden Cross – SHIB is About to Explode Cryptonews
Source link ]]>
The XRP price has been exhibiting a complex pattern of consolidation and retracement for weeks. However, according to prominent market analyst Egrag Crypto, there’s a critical signal to watch for that could determine whether the cryptocurrency’s bullish narrative remains intact or not. The expert’s analysis, shared on X social media, highlights that the behaviour of XRP’s 3-day candles could soon decide the direction of its next major move.
XRP Price Integrity Hinges On 3-Day Candle Closes Below $2
In his post on X, Egrag Crypto explains the “measured move breakdown” for XRP, identifying a key technical formation in the form of a descending triangle that, based on its structure, points to a potential move toward $2.14. The accompanying chart shows XRP hovering between $2.40 and $2.60, with multiple retests of the same price levels over the past few months. Despite the brief wick to the downside, Egrag Crypto suggests that the structure continues to indicate consolidation within the range.
Related Reading
The analyst reiterates that $2.65 remains a critical price target for XRP. If the cryptocurrency breaks and sustains above it, he predicts that it could regain upward momentum, potentially paving the way for renewed bullish sentiment. However, failure to hold current levels around $2.5 might expose XRP to deeper retracements, particularly if 3-day candles start closing below the $2.00 to $1.91 range.

Egrag Crypto warns that this specific candle behaviour is concerning, as it could signal a structural breakdown of XRP’s market cycle. It could also invalidate his bullish thesis, suggesting that the recent peak near $3.65 may have been the cycle top.
Additionally, the analyst’s chart shows XRP’s price action hovering above the 200 Exponential Moving Average (EMA), serving as a long-term support level. Should XRP maintain its position above this moving average, Egrag Crypto asserts that the cryptocurrency’s bullish setup remains valid. He noted that the next 60 to 90 days are expected to be crucial, as XRP’s reaction around the levels mentioned above could define the trajectory of the rest of the year.
XRP Faces 57% Chance Of Breaking To A New ATH
In a separate analysis, Egrag Crypto introduced a 57% to 43% probability model, sharing his broader perspective on XRP’s potential price direction in the short term. He stated that there is a 57% probability that XRP could break into a new all-time high in the coming months. He also sees a 43% chance that the cryptocurrency could decline significantly, offering traders another opportunity to accumulate it at a price below $1.
Related Reading
While the probabilities of XRP’s near-term price favor a more bullish outcome, the bearish case remains plausible given the lingering macroeconomic uncertainty and overall crypto market volatility. Egrag Crypto notes that he is personally positioning himself toward the bullish scenario, aligning his expectations with the 57% chance of a major price breakout.
Featured image from iStock, chart from Tradingview.com
As investors scan the horizon for early signals of a Bitcoin rally to $1 million, Bloomberg analyst Eric Balchunas has predicted that God candles will become a rarity. While price spikes will be few and far between, Balchunas noted that ETFs and corporate adoption will eliminate vomit-inducing drawdowns for the largest cryptocurrency. No More Bitcoin
The post Bitcoin’s Era Of God Candles Is Over, Bloomberg Analyst Warns appeared first on CoinGape.
]]>Dogecoin News Today: DOGE Sharks & Whales Explore Alternative Routes Amid Red Candles, COLD Tops The Chart CoinCentral
Source link ]]>
Shiba Inu Breaks $0.000014 on Six Consecutive Green Candles, Analysts Predict Huge Spike The Tech Report
Source link ]]>
A crypto analyst remains highly optimistic about XRP Ledger’s native token, XRP, predicting the appearance of multiple God candles that could potentially propel the cryptocurrency into a strong bullish rally.
Breaking Resistance Could Trigger God Candles
In an X (formerly Twitter) post on June 14, a crypto analyst identified as ‘Dark Defender’ provided a detailed interpretation of technical indicators and resistance levels that could signal a bullish uptrend for XRP. The analyst revealed that XRP has experienced a highly bullish reversal for the Fisher Indicator on the weekly chart.
Related Reading
The Fisher Indicator is a versatile technical tool used to pinpoint trend reversals and highlight when prices have moved to the extreme. Based on this technical indicator, Dark Defender has revealed that the altcoin has broken through an initial price resistance at $0.04623, indicating strength and momentum in the cryptocurrency’s price movement.
Sharing a price chart depicting XRP’s movements, the crypto analyst unveiled that the altcoin’s price is currently testing the interim Fibonacci levels at $0.5286. He expressed bullish optimism about XRP closing above the week’s candle around the $0.53 price mark.
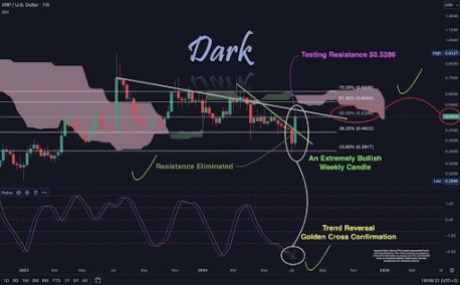
Dark Defender also highlighted the next significant resistance level for XRP’s price. The analyst expects XRP to test secondary mid-level resistance points at $0.6044, as breaking this level would be a positive signal for a higher upward momentum for XRP.
Interestingly, Dark Defender expects XRP to trigger God candles if it successfully breaks all the aforementioned resistance levels. He highlighted another key support level at $0.6649, labeling it the master fundamental level. The crypto analyst disclosed that it was crucial to not underestimate this level, signaling the potential for strong bullish surge in XRP if it surpasses this key threshold.
The analyst has predicted multiple God candles that indicate sharp price increases for XRP, possibly opening up a path to “Heaven’s Stairway.”
Update On XRP Price Analysis
Amidst recent legal challenges with the United States Securities and Exchange Commission (SEC) and broader market downtrend, XRP has been displaying strong bullish signals and healthy price fundamentals. At some point this year, the cryptocurrency plummeted below the $0.5 price mark, experiencing unexpected price declines.
Related Reading
However, recently, the altcoin has been on a roll, recording multiple bullish surges that have pushed its price to its current value of $0.538. According to data from CoinMarketCap, XRP has soared by almost 30% over the past week and risen by another 1.41% in the last 24 hours.
The cryptocurrency has been performing relatively well despite market volatility. Its recent gains have also positioned it at a critical point where its price could potentially surge above the $0.6 threshold. Additionally, with the Ripple vs. SEC legal battle nearing conclusion and a settlement on the horizon, XRP is poised to overcome bearish sentiment fueled by regulatory concerns.
Featured image created with Dall.E, chart from Tradingview.com
Bitcoin, Ethereum, Dogecoin Print More Red Candles, But Top Trader ‘Can’t Be Bearish Here’ Benzinga
Source link ]]>