Bitcoin (BTC) is showing technical warning signs that have caught the attention of market watchers, with one analyst now predicting a dramatic price collapse in the world’s largest cryptocurrency. The analyst noted that a Bitcoin candlestick pattern that previously preceded a devastating crash to below $20,000 has reappeared on the weekly chart, reigniting fears that history may be repeating itself. If it does, it could completely rewrite the narrative of this entire market cycle.
Historical Setup Signals Bitcoin Potential Crash To $19,000
Market analyst Tony Severino has issued a stark warning to Bitcoin investors and holders, sharing a technical analysis on X that draws a chilling comparison between current price action and a previous cycle crash. The analyst has projected that Bitcoin could decline as low as $19,000 in this bear market.
Related Reading
The chart shared by Severino places two Bitcoin weekly candlestick patterns side by side, revealing a near-identical structural setup between the current market cycle and a previous bear phase. The left panel shows Bitcoin’s recent trajectory from late 2025 to early 2026, while the right panel displays a historical period that ultimately saw prices collapse below $20,000.
Severino expressed his surprise at the chart patterns, noting that it was “absolutely wild” how similar the candlestick structures are between the two periods. He added that even the technical indicators are “almost exactly the same.”

Both chart panels feature a prominent rectangular consolidation zone followed by a pink-highlighted rebound area. The visual symmetry between the two timeframes underpins the analyst’s bearish thesis, suggesting that the current rebound around the pink zone could be short-lived, followed by a potential crash below $19,000 if historical trends repeat.
Notably, the analyst’s bearish forecast drew skepticism from some members of the crypto community. One member argued that a drop to such levels would not simply represent a routine cycle correction, but the largest retracement in Bitcoin’s history. Severino, however, stood firmly on his analysis and forecast, stating that a 74% correction was entirely possible and even normal within Bitcoin’s historical framework. Not backing down, he insisted again that the market may still have significant downside to navigate before any meaningful bottom is established.
Update On BTC’s Price Action
The Bitcoin price has recovered again from its previous level, trading back above $70,000. Last week, the cryptocurrency crashed to as low as $63,000 amid significant volatility and shifts in market sentiment.
Related Reading
However, CoinMarketCap data shows that Bitcoin has gained over 4.8% in the last 24 hours, with its daily trading volume up by more than 23.4%. The sudden price increase has been attributed to sustained inflows into Spot Bitcoin ETFs and easing geopolitical tensions in the Middle East.
Featured image from Pixabay, chart from Tradingview.com
Reason to trust
![]()
Strict editorial policy that focuses on accuracy, relevance, and impartiality
Created by industry experts and meticulously reviewed
The highest standards in reporting and publishing
Strict editorial policy that focuses on accuracy, relevance, and impartiality
Morbi pretium leo et nisl aliquam mollis. Quisque arcu lorem, ultricies quis pellentesque nec, ullamcorper eu odio.
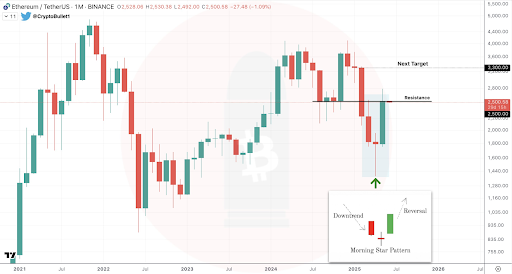
Ethereum has so far underperformed in this market cycle but looks ready to mount a parabolic rally based on analysts’ predictions. Crypto analyst Crypto Bullet recently highlighted a bullish pattern on ETH’s chart, which provides a bullish outlook for the altcoin.
Ethereum Eyes $3,300 As Morningstar Candle Pattern Forms
In an X post, Crypto Bullet predicted that Ethereum could rally to $3,300 as a Morningstar Candle pattern forms for the largest altcoin by market cap. This came as he highlighted the bullish monthly close for ETH and alluded to the monthly chart printing this bullish pattern. With this, the analyst expects a significant rally from Ethereum.
Related Reading
Crypto Bullet noted that Ethereum is now facing tough resistance, but he believes that the $2,500 resistance will be broken. The analyst added that his next target is $3,300. Meanwhile, crypto analyst Ash Crypto also provided a bullish analysis for ETH, in which he declared that the Wyckoff accumulation was still in play.
He remarked that the first major level to reclaim is $3,100, which will be followed by a small correction. Following that, Ash Crypto is confident that ETH will then surge to $4,000, which will initiate an explosive rally. The analyst affirmed that $10,000 is programmed for ETH in this cycle.
As NewsBTC reported, crypto analyst Crypto GEM recently predicted that Ethereum could rally to $8,000 by next year. Crypto analyst Titan of Crypto also highlighted $5,000, $7,000, and $8,500 as the targets for ETH’s market structure.
Meanwhile, just like Ash Crypto, crypto analyst Mikybull Crypto is also confident that the altcoin can reach as high as $10,000 in this market cycle. He highlighted a similarity between Ethereum’s current price action and that of the 2017 market cycle.
Ongoing V-Shape Recovery For ETH
In an X post, crypto analyst Titan of Crypto highlighted an ongoing V-shape recovery for Ethereum. He noted that ETH has kicked off a sharp reversal, forming a classic V-shape structure on the weekly chart. His accompanying chart showed that ETH could rally to as high as $7,600 on this run-up.
Related Reading
Crypto analyst Mikybull Crypto stated that Ethereum is flirting with a breakout. The analyst further noted that the Relative Strength Index (RSI) is already breaking out. His accompanying chart showed that ETH could rally to as high as $3,600 on this breakout. He also declared that the fifth time of ETH’s move to the MA20 will be a thrust through. The altcoin is expected to break the $2,600 resistance on this move.
At the time of writing, the Ethereum price is trading at around $2,450, down almost 6% in the last 24 hours, according to data from CoinMarketCap.
Featured image from Getty Images, chart from Tradingview.com

While Ethereum (ETH) has posted impressive gains of 37.7% over the past month, the second-largest cryptocurrency by market capitalization still remains over 33% below its June 2024 levels. However, recent technical and on-chain indicators suggest that ETH may be on the verge of a significant breakout.
Ethereum Prints Bullish Morning Star Candlestick Pattern
In a post on X earlier today, crypto trader Merlijn The Trader highlighted a potentially bullish development on the Ethereum monthly chart. According to Merlijn, ETH has printed a Morning Star candlestick pattern – often regarded as a strong bullish reversal signal.
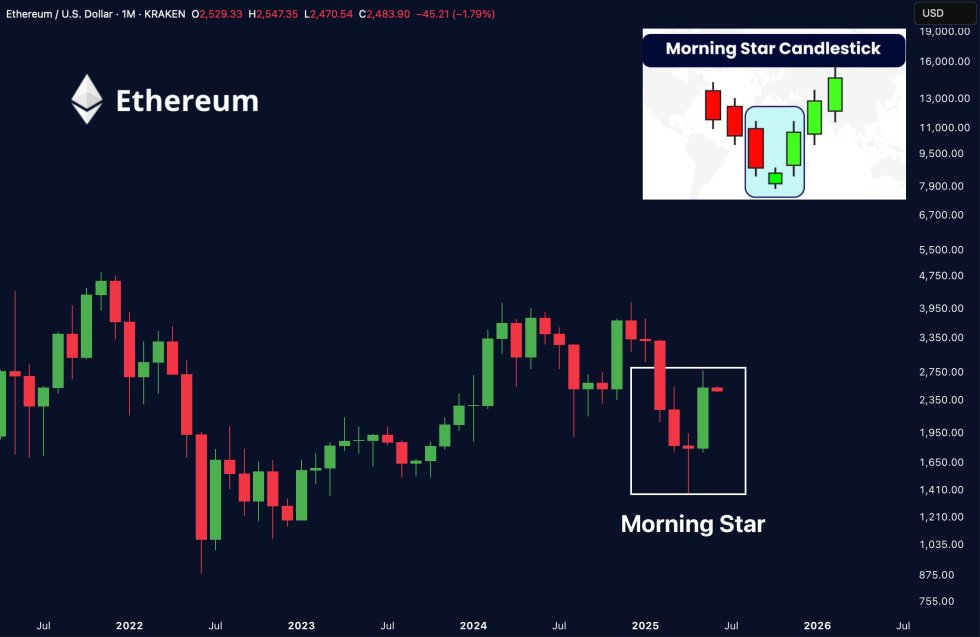
For the uninitiated, the Morning Star is a bullish reversal pattern that appears after a downtrend, signaling a potential shift to upward momentum. It consists of a large bearish candle, a small candle showing indecision, and a strong bullish candle that closes well into the first candle’s body.
Beyond technical indicators, Ethereum is also seeing growing interest from institutional investors. A recent CoinShares report revealed that global crypto exchange-traded products (ETPs) saw $286 million in net inflows during the week ending May 30. Ethereum-based ETPs were a key contributor to this trend.
Data from SoSoValue further confirms this momentum. In May 2025 alone, spot Ethereum exchange-traded funds (ETFs) recorded total net inflows of $564 million – up sharply from $66 million in April.
In addition, an increasing number of entities continue to stake their ETH on the network. In a separate X post, crypto analyst Ted Pillows outlined how Abraxas Capital had staked ETH worth $7.5 million earlier today.
To recall, Ethereum staking involves locking up ETH to help secure the Ethereum network and validate transactions, a core part of its proof-of-stake consensus mechanism. In return, stakers earn rewards, typically paid out in ETH, for participating in network operations.
Important To Hold This Support Level
Veteran crypto analyst Ali Martinez emphasized the importance of the $2,550 support level, noting that ETH must hold above this threshold to sustain its bullish momentum. If it does, Martinez predicts a possible push toward the $2,650 level.

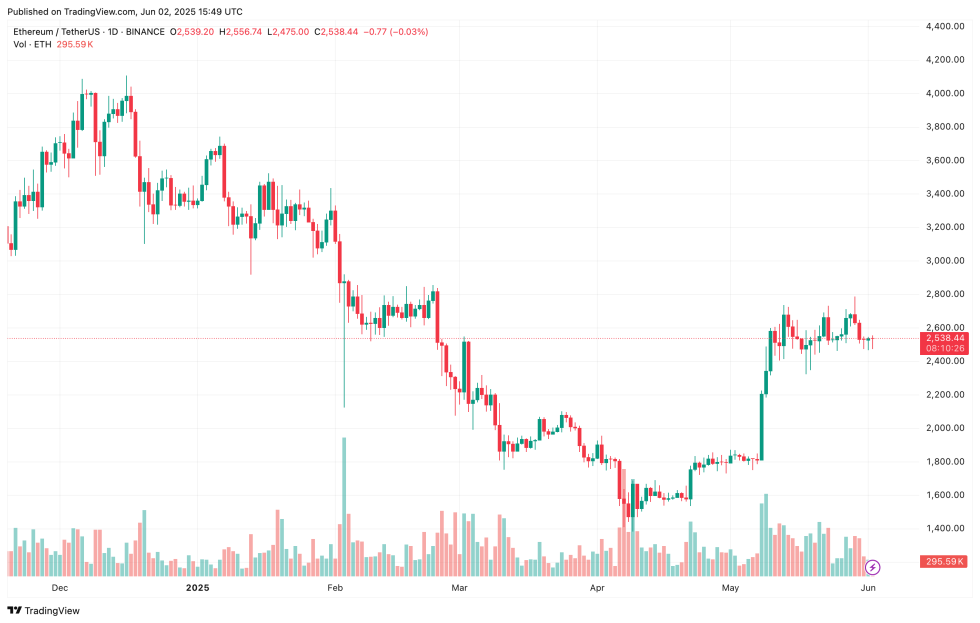
In line with this sentiment, fellow analyst Titan of Crypto suggested that ETH may be gearing up for a run to $3,800, citing a breakout from a bullish flag pattern on the daily chart. The analyst also pointed out that ETH is currently holding above its 200-day exponential moving average (EMA), which often signals continued upward movement.
Adding to the bullish case, nearly 300,000 ETH left Binance between mid-April and mid-May, potentially contributing to a supply crunch. At the time of writing, ETH is trading at $2,538, up 0.8% in the last 24 hours.
Featured Image from Unsplash.com, charts from X and TradingView.com
Editorial Process for bitcoinist is centered on delivering thoroughly researched, accurate, and unbiased content. We uphold strict sourcing standards, and each page undergoes diligent review by our team of top technology experts and seasoned editors. This process ensures the integrity, relevance, and value of our content for our readers.
In the past few days, Ethereum has been struggling below the $2,600 price level after the general crypto market took a bearish hit, halting its recent upward trend. While ETH’s price has faced notable bearish movements, there is still a possibility that the altcoin could rally in the upcoming weeks as a key bullish pattern emerges.
A Possible Rebound Emerging For Ethereum
Ethereum’s upward performance has weakened due to a bearish shift in the crypto market, causing many major digital assets to retrace. Despite this price action, Crypto Bullet, a technical expert and investor, has outlined a setup that hints at a possible rebound toward higher levels in the short term.
Following his analyses of the 1-month chart, Crypto Bullet highlighted that ETH closed the month of May on a bullish note. In addition to the monthly close, the altcoin has formed a beautiful Morning Star Candlestick formation, suggesting growing upside momentum.
A Morning Star Candlestick formation is a technical pattern that suggests a potential shift from a bearish trend to a bullish trend, making it a reversal pattern. When the market is in a dire downward trend, the morning star candlestick pattern is regarded as a sign of hope for a positive run.

The emergence of this key chart setup suggests that the altcoin may be gearing up for another upswing, despite the mixed sentiment in the broader crypto market. With technical indicators hinting at a shift toward the upside trajectory, the anticipated rally might reignite a bull market phase for Ethereum.
According to the crypto analyst, ETH is currently facing tough resistance as prices struggle to regain upward strength. However, the altcoin recently broke past the $2,500 price level, which Crypto Bullet considers a key resistance range.
Prior to the breakout, the expert predicted that a notable rally could follow, pushing ETH to the $3,300 mark in the upcoming weeks. Since Ethereum has slightly surpassed $2,500 at the time of writing, this implies that the anticipated journey to $3,300 and beyond might have begun.
Major ETH Investors Are Returning To The Market
Despite facing bearish performance, investors’ sentiment toward ETH has remained strong, particularly on Binance, the world’s largest crypto exchange. On-chain expert and author Darkfost reported that Ethereum whales are back on the crypto exchange.
Darkfost identified the shift after examining the ETH Average Order Size on Binance, a metric that provides a real-time picture of Ethereum’s sentiment and momentum on the platform. This is measured by combining important market data on spot and futures activity, cumulative volumes, and a comparison of moving averages.
ETH whale orders on Binance have been rising since May 19, representing a very encouraging signal and conviction among large investors. The last time this indicator was illuminated in this manner was in December 2023, just before ETH’s strong rise from $2,200 to $4,000.
While the indicator has lit up, Darkfost highlighted that whales are not always attempting to catch the exact bottom; rather, they often position themselves early when a macro trend starts to show indications of strength.
Featured image from Getty Images, chart from Tradingview.com
Editorial Process for bitcoinist is centered on delivering thoroughly researched, accurate, and unbiased content. We uphold strict sourcing standards, and each page undergoes diligent review by our team of top technology experts and seasoned editors. This process ensures the integrity, relevance, and value of our content for our readers.
XRP Sees Major Breakdown: What’s Happening? Shiba Inu (SHIB) Paints Candlestick Reversal Pattern, Ethereum (ETH) Makes Catastrophic Move U.Today
Source link ]]>
-
Avalanche is trading at the breakout zone after correcting in a bear market
-
The Fed’s policy move on Wednesday will determine the price move
-
Watch for the close of the daily candlestick for a possible reversal or bear continuation
Most cryptocurrencies are correcting after the recent gains. Profit taking and Fed’s policy action on Wednesday is playing a role. Cryptocurrencies like Avalanche AVAX/USD had previously breached key levels. They remain on the watch list should the Fed hold a soft stance regarding policy tightening.
AVAX is trading at $20.12. The level is close to or at the support of $20.95. AVAX traded and consolidated at $26 as the price pushed through the $20.95 resistance. At the current price, the token is seemingly looking to crash back into the consolidation zone. Nonetheless, it can’t be confirmed yet that AVAX has slipped below the $20.95 support. We need the close of the daily candlestick for confirmation.
AVAX slightly slips below the breakout support
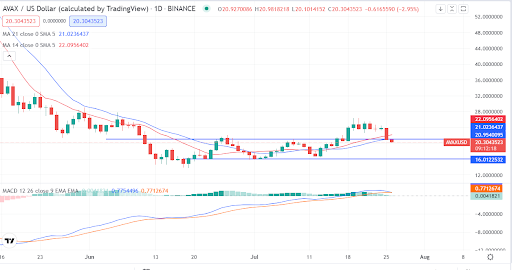 Source – TradingView
Technically, the Avalanche token is bearish at or slightly below the $20.95 support. The short-term moving averages have moved above price and could add bear weakness. The MACD indicator is also about to close below the moving average in a bear market.
While bear pressure remains on AVAX, we cannot confirm a break below the $20.95. Investors should watch for the close of the daily candlestick. It could be a false breakout if the candlestick closes above the support. In that case, a buy signal would be generated. That would, of course, be subject to the prevailing crypto sentiment.
If AVAX closes below the $20.95 support, with a bear crypto sentiment, weakness will continue. The next potential support for the token is $16.
Summary
AVAX is yet to confirm a bearish momentum despite breaking slightly below the $20.95 support. The token could reverse if the daily candlestick closes above the support.