Bitcoin price started a recovery wave from $86,000. BTC is slowly moving higher and might rise further if it clears $89,500.
- Bitcoin started a minor recovery wave from the $86,000 level.
- The price is trading near $88,500 and the 100 hourly simple moving average.
- There was a break above a bearish trend line with resistance at $88,000 on the hourly chart of the BTC/USD pair (data feed from Kraken).
- The pair might recover if it manages to settle above $88,800 and $89,500.
Bitcoin Price Attempts Rebound
Bitcoin price extended losses and traded below the $87,200 support. BTC even declined below $86,500 before the bulls appeared. A low was formed at $86,007, and the price is now attempting a recovery wave.
The price climbed above the $87,000 and $87,500 levels. There was a move above the 50% Fib retracement level of the downward move from the $91,099 swing high to the $86,007 low. Besides, there was a break above a bearish trend line with resistance at $88,000 on the hourly chart of the BTC/USD pair.
Bitcoin is now trading near $88,500 and the 100 hourly simple moving average. If the price remains stable above $87,500, it could attempt a fresh increase. Immediate resistance is near the $88,800 level.
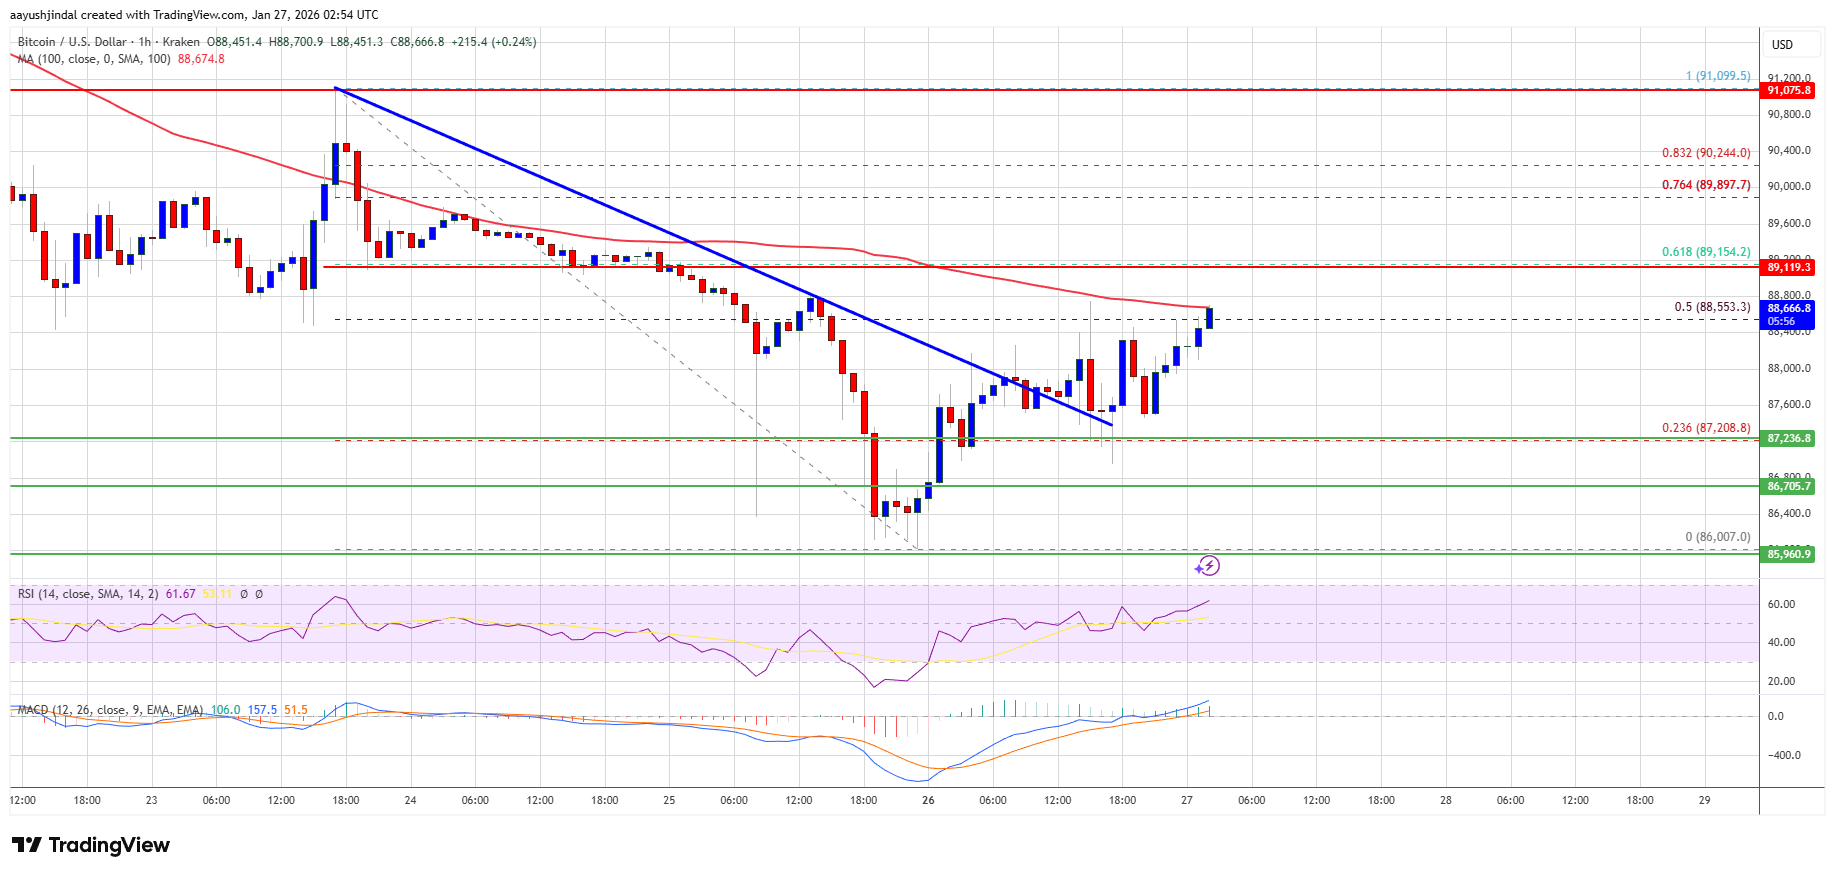
The first key resistance is near the $89,150 level since it is close to the 61.8% Fib retracement level of the downward move from the $91,099 swing high to the $86,007 low. A close above the $89,150 resistance might send the price further higher. In the stated case, the price could rise and test the $89,500 resistance. Any more gains might send the price toward the $90,000 level. The next barrier for the bulls could be $91,000 and $91,500.
Another Decline In BTC?
If Bitcoin fails to rise above the $88,800 resistance zone, it could start another decline. Immediate support is near the $88,000 level. The first major support is near the $87,200 level.
The next support is now near the $86,700 zone. Any more losses might send the price toward the $86,200 support in the near term. The main support sits at $86,000, below which BTC might struggle to recover in the near term.
Technical indicators:
Hourly MACD – The MACD is now gaining pace in the bullish zone.
Hourly RSI (Relative Strength Index) – The RSI for BTC/USD is now above the 50 level.
Major Support Levels – $88,000, followed by $87,200.
Major Resistance Levels – $88,800 and $89,500.
Cardano Price Prediction Challenged by XRP Tundra’s Dual-Token Model CoinCentral
Source link ]]>
Best Crypto to Buy Now for Strong Bull Run Potential: Dogecoin (DOGE) Challenged by Mutuum Finance (MUTM) Cryptopolitan
Source link ]]>
Cardano Price Prediction Models Challenged as XRP Tundra Introduces Competing Staking Model CoinCentral
Source link ]]>
Cardano’s Legacy Challenged By Yeti Ouro’s Presale Success ZyCrypto
Source link ]]>
Ethereum has faced significant selling pressure in recent trading sessions as broader market trends turn more bearish. After attempting to break above key resistance levels, ETH has encountered hurdles that suggest the prevailing trend is shifting toward a more negative outlook. As the price begins testing the $3,051 support, a potential breakdown could signal a deeper pullback, which might push ETH toward lower support levels.
Key factors contributing to this bearish sentiment include weakening buying interest, market-wide retracements, and technical indicators signaling further downside risks. Ethereum’s failure to maintain upward momentum, especially after hitting resistance, suggests that the bulls may be losing control, leaving the bears in the driver’s seat.
The $3,051 level is critical for the altcoin’s short-term outlook. If the price fails to hold above this support, it could accelerate the downward move, possibly targeting the next support zone. However, if ETH stabilizes here and shows signs of a bullish reversal, it may regain upward momentum and resume its recovery.
Technical Signals Point To Bearish Shift: What’s Next For ETH?
Ethereum’s technical indicators are painting a concerning picture of the cryptocurrency’s short-term outlook. The price action has struggled to break through key resistance levels, and recent downward movements suggest that the bulls may have lost control.
As of the time of writing, ETH’s price is still trading below the 4-hour Simple Moving Average (SMA), which suggests bearish pressure is still prevailing in the market. The 4-hour SMA serves as a short-term trend indicator, and when the price is below it, it typically indicates that selling pressure is dominating the market.

This failure to break above the SMA highlights the ongoing struggle for Ethereum to reclaim bullish momentum. Until ETH rises above and closes above the SMA, the downside risks remain intact, and the bears are likely to maintain control.
Furthermore, ETH’s Relative Strength Index (RSI) has been persistently staying within the bearish zone, reinforcing the negative outlook for Ethereum. Typically, an RSI reading below 50% indicates a lack of upward strength, implying that selling pressure outweighs buying interest in the market. In Ethereum’s case, the sustained positioning in the bearish zone signals that bulls are struggling to gain traction and push the price higher.
Can Ethereum Defend Against The Bears?
Currently, Ethereum’s price is approaching a crucial support level at $3,051, which has become a key point to watch as bearish pressure mounts. This support zone represents a potential floor for Ethereum, and its ability to hold above this level will be pivotal in determining the asset’s next move.
A successful defense of $3,051 could stabilize the price and spark a rebound toward the $3,360 resistance as it may encourage buyers to step in and halt more declines. However, if Ethereum fails to maintain this support and breaks below it, the bearish momentum might intensify, pushing the price toward lower levels.
Featured image Unsplash, chart from Tradingview.com
Dogecoin’s Reign As The Top Meme Coin Could Be Challenged In 2024: 3 Coins Racing To Overtake DOGE Blockchain Magazine
Source link ]]>
Shiba Inu Challenged by Rising Crypto Stars Baby Doge Coin & Raboo in Meme Coin Frenzy Crypto Reporter
Source link ]]>
Cardano ($ADA) and Avalanche ($AVAX) Challenged: Borroe.Finance ($ROE) Gears Up with a Projected 300% Surge! Analytics Insight
Source link ]]>
Dogecoin (DOGE) and Floki Inu (FLOKI) Challenged by Market Trends: New Crypto Steps Up as the Next Big Star Bitcoinist
Source link ]]>