Bitcoin has held steady around the $108,000 price level in recent days. After bouncing back from a brief pullback near $105,500 on Wednesday, Bitcoin recently tested $109,000 again in the past 24 hours.
A popular crypto analyst has shared a long-term “Bitcoin Bull Run Cheat Sheet” that claims that the cryptocurrency has now entered into the final phase that will lead to massive price gains.
Related Reading
Bitcoin Cheat Sheet Declares Start Of Final Bull Phase
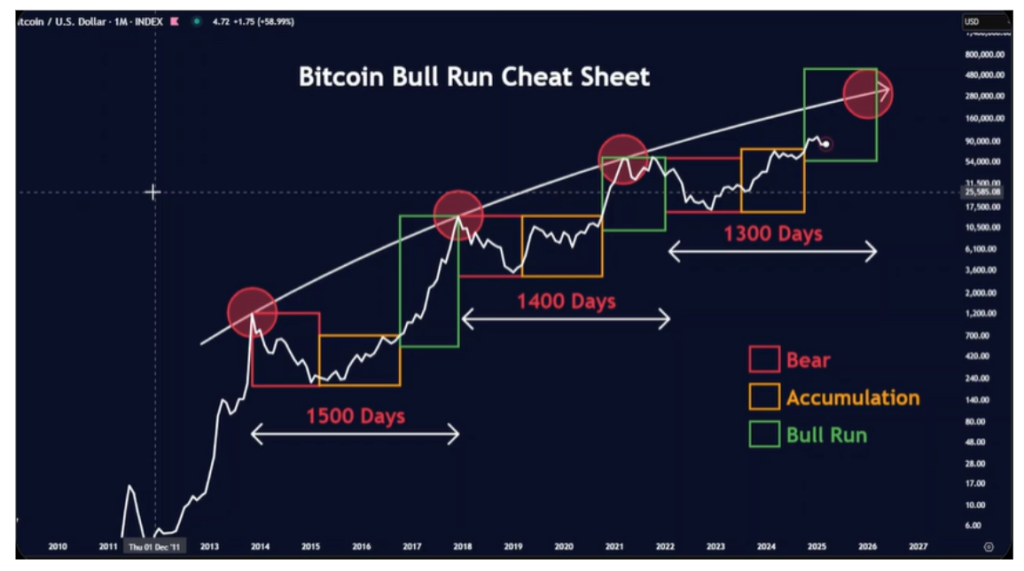
In a recent post on X, Merlijn The Trader released what he dubbed the “Bitcoin Bull Run Cheat Sheet.” This cheat sheet is a breakdown of Bitcoin’s past market movements that shows the distinct phases of bear markets, accumulation zones, and subsequent parabolic bull runs.
The cheat sheet divides each of Bitcoin’s two previous cycles from 2014 into three colored boxes: red for bear markets, orange for accumulation, and green for bull runs. Merlijn’s chart traces this repeating structure over the past decade, showing how each bull market followed a similar rhythm that began after a lengthy consolidation period and ended with a strong price explosion.
The first full cycle began with Bitcoin’s peak around $1,000 in December 2013. Following that top, the price entered a long, painful bear market that spanned into 2015. This red-box phase eventually transitioned into accumulation, where Bitcoin traded sideways between $80 and $500 for a prolonged period. The green bull run box on the chart began around early 2017, and eventually ended with a peak just below $20,000 in late 2017. According to the cheat sheet, this entire cycle from peak to new peak lasted 1500 days.
Bitcoin’s second cycle kicked off after its December 2017 top. A long drawdown followed, and the bear market phase dragged Bitcoin down to $3,000 by the end of 2018. The chart marks this point with another red box, followed by the orange accumulation zone that stretched well into 2020.
The cheat sheet’s green box reappeared in late 2020 right as Bitcoin broke above its previous highs. The price shot up throughout 2021 and eventually reached a new all-time high around $69,000 in November of that year. This second full cycle was shorter than the first and spanned around 1400 days from the previous top.
When Will The Next Bull Run Begin?
The current cycle began with Bitcoin’s all-time high in November 2021. Since then, the market has gone through its familiar sequence. A sharp decline into 2022 which bottomed around $15,000 represents the bear market phase. The decline was followed by nearly a year of sideways movement and slow recovery up until early 2025. This is represented as the orange accumulation box on the cheat sheet above.
According to the analyst, Bitcoin is now in the next bull phase, and possibly the largest one yet. The chart projects a continuation along the long-term growth curve, possibly toward the $250,000 to $300,000 range over the coming year. Notably, the timeline for the entire cycle this time should take about 1,300 days from late 2021 to complete.
Related Reading
At the time of writing, Bitcoin is trading at $108,260.
Featured image from Pixabay, chart from TradingView
Dogecoin Price Prediction: DOGE Expected To Pump 1,080%, But Bloomberg Experts Say This Cheat WallitIQ (WLTQ) Token Will Explode 19,000% In 5 Days Bitcoinist
Source link ]]>
The Wall Street Cheat Sheet has been around for years now and is often passed around in finance circles, so Bitcoin has not been left out. The cheat sheet shows different stages of each market cycle, using sentiment to track where in the cycle a particular asset is. With the Bitcoin market seeming to be stuck in limbo, a crypto analyst has applied the information from the Wall Street Cheat Sheet in an effort to show where we are in the bull cycle.
Bitcoin Cycle Moves Into Belief
The different stages of the Wall Street Cheat Sheet represents different sentiment in the market and it could help to predict where the Bitcoin price is headed next. According to the crypto analyst Mags who has over 89,000 followers on X (formerly Twitter), the Bitcoin market has currently entered the ‘Belief’ stage.
Related Reading
Belief is the stage that comes after Optimism, which the crypto analyst puts at around the time the Bitcoin price hit its $73,000 all-time high earlier in the year. The drawdown was expected, leading to this next stage, which is now Belief.
What this means for the Bitcoin price is that there could be a continuation of the bull rally. This is because with Belief comes more confidence in the market, and as investors take more bets, the BTC price will rise as a result from here.
Basically, the crypto analyst’s post suggests that the Bitcoin bull market is far from over. If the Wall Street Cheat Sheet is anything to go by, then the BTC bull run could only be in its beginning stages with a long way to go as Belief drives its price toward $90,000.
BTC Price Could Touch $300,000
Using the Wall Street Cheat Sheet shows that Belief is far from the top of the Bitcoin bull cycle. If anything, it is the confirmation of the ongoing bull market. The next stage is the ‘Thrill’ where investors are making a lot of money from their trades. At this point, more money is flowing into the market to sustain the rally.
Related Reading
The last stage of any Bitcoin bull cycle according to the Wall Street Cheat Sheet is the ‘Euphoria’ stage. This is when investor are completely on board with the Bitcoin bull market and is a time of peak bullish sentiment. At this stage, the analyst’s chart suggests that the BTC price could touch as high as $300,000.
However, this stage often marks the top of the market and the euphoria will often not allow investors to realize that the run is over. Once this stage is completed, the Bitcoin price could turn really quickly and lose over 50% of its value as it has done in the past.
Featured image created with Dall.E, chart from Tradingview.com
Major coins were in the green on Thursday evening as the global cryptocurrency market cap rose 0.7% to $1.04 trillion.
| Coin | 24-hour | 7-day | Price |
|---|---|---|---|
| Bitcoin BTC/USD | 0.9% | -6.2% | $21,559.88 |
| Ethereum ETH/USD | 1.7% | -7.2% | $1,688.76 |
| Dogecoin DOGE/USD | 1.35% | -8.2% | $0.07 |
| Cryptocurrency | 24-Hour % Change (+/-) | Price |
|---|---|---|
| Shiba Inu (SHIB) | +6.9% | $0.000014 |
| Decred (DCR) | +6% | $33.79 |
| Aave (AAVE) | +5.3% | $93.20 |
See Also: How To Get Free Crypto
Why It Matters: Ethereum was the frontrunner in terms of gains among major coins at press time. Cryptocurrencies were buoyant ahead of a key address by the U.S. Federal Reserve Chair Jerome Powell.
Ahead of Powell’s speech, stock futures were seen trading flat. However, for the day, the Nasdaq and S&P 500 rose 1.4% and 1.7%, respectively, as reports emerged that the United States and China are nearing a deal that would allow for audit inspections of New York-listed Chinese companies.
OANDA senior market analyst Edward Moya pointed to a fall in jobless claims and a slight revision higher with both headline GDP and personal consumption data to say it was a “perfect appetizer” for Friday’s hawkish Powell speech.
“The Fed is ready to be locked in tightening mode until inflation eases and the latest inflation pretty much confirms that won’t happen until next year. The labor market is still too strong and that will continue to feed into rising wages and drive home the point that the Fed can remain aggressive with raising rates.”
“Bitcoin is consolidating ahead of Jackson Hole but still remains comfortably above the $20,000 level. The correlation with Bitcoin and equities is not holding up today, but that is mainly because the move higher in equities is a story about Chinese ADRs and not a broader move for tech stocks,” wrote the analyst, in a note seen by Benzinga.
Michaël van de Poppe said Bitcoin is “boring” currently but tomorrow it can “result in fake-outs.” The cryptocurrency trader said the apex coin was testing $21,800 and that it would lead to its acceleration to $23,200. The $21,000 level is crucial for the coin.
#Bitcoin is boring, as we anticipate reactions based on tomorrow’s news (PCE numbers and Powell’s speech).
Overall, on a support block now and;
– Tomorrow can result in fake-outs.– Testing $21.8K will likely result in acceleration to $23.2K.
– Crucial to stay above $21K. pic.twitter.com/LYNRnHpnkh
— Michaël van de Poppe (@CryptoMichNL) August 25, 2022
Trader Justin Bennett tweeted the correlation between the monetary base and risk assets on Friday. He said, “Don’t fight the Fed!”
Want a cheat sheet for #stocks and #crypto?
The monetary base (yellow line) drives risk assets.
To reduce inflation, the Fed needs to lower that yellow line.
If that line drops, the blue line (S&P 500) follows.
If the S&P drops, #Bitcoin follows.
Don’t fight the Fed! pic.twitter.com/QCJW2YXIfi
— Justin Bennett (@JustinBennettFX) August 25, 2022
Bitcoin’s adjusted Output Profit ratio — a ratio of spent outputs that have been in profit for a particular period of time — continues to face “heavy resistance” at the breakeven threshold of 1.0, tweeted Glassnode.
“This [suggests BTC] investors are taking profits during bear market rallies, and are spending coins at their cost-basis to simply ‘get their money back,’” said the on-chain analysis firm.
#Bitcoin aSOPR continues to face heavy resistance at the break-even threshold of 1.0.
This suggest $BTC investors are taking profits during bear market rallies, and are spending coins at their cost-basis to simply ‘get their money back’.
Live Chart: https://t.co/5weEX0MbyA pic.twitter.com/e6IgX5CwMR
— glassnode (@glassnode) August 25, 2022
On the Ethereum side, the price of the second-largest coin is tightly correlated with the S&P500 amid global uncertainties, said Santiment.
“The supply of $ETH on exchanges rose sharply just prior to the drop last week, and network growth has fallen back to 3-month low levels,” tweeted the market intelligence platform.
#Ethereum‘s price continues following tightly with the #SP500 as global uncertainties continue. The supply of $ETH on exchanges rose sharply just prior to the drop last week, and network growth has fallen back to 3-month low levels. Our full analysis: https://t.co/70kbsMS1DQ pic.twitter.com/q8TvXdViqW
— Santiment (@santimentfeed) August 25, 2022
Read Next: Mark Cuban Super Bullish On Ethereum In Anticipation Of This Key Event