Can Dogecoin reach $0.11 as $1.63M DOGE liquidity cluster forms? AMBCrypto
Source link ]]>

Trusted Editorial content, reviewed by leading industry experts and seasoned editors. Ad Disclosure
Ethereum has slipped below the critical $2,000 level, reinforcing a broader bearish market structure as selling pressure intensifies across the crypto sector. The breakdown comes amid weakening macro sentiment, persistent outflows from risk assets, and declining confidence in short-term crypto demand. Together, these factors have pushed ETH into a defensive phase, with traders increasingly focused on downside liquidity zones rather than recovery signals.
Recent data highlighted by Lookonchain points to three major on-chain liquidation clusters that could shape Ethereum’s next moves. These zones represent areas where leveraged positions may be forced to close if price declines continue, potentially accelerating volatility. Historically, such liquidation pockets tend to act as magnets during corrective phases, amplifying both panic selling and short-term price swings.
Market sentiment has also been affected by reports of Ethereum co-founder Vitalik Buterin moving and selling ETH. While these transactions are often linked to funding ecosystem development, charitable initiatives, or operational needs rather than outright bearish positioning, they can still influence trader psychology. In fragile markets, even neutral fundamental events can trigger disproportionate reactions.
Lookonchain data highlights three major on-chain liquidation clusters that could significantly influence Ethereum’s short-term price dynamics if bearish pressure persists. According to the analysis, Trend Research reportedly holds about 356,150 ETH, valued near $671 million, with estimated liquidation levels between $1,562 and $1,698. If price approaches this band, forced position closures could amplify volatility and accelerate downside momentum.

Another key concentration involves Ethereum co-founder Joseph Lubin alongside two unidentified large wallets. Combined holdings are estimated at around 293,302 ETH, roughly $553 million, with potential liquidation thresholds between $1,329 and $1,368. This zone sits deeper in the corrective structure and could act as a secondary stress level if broader market weakness continues.
A third cluster attributed to the entity known as 7 Siblings holds approximately 286,733 ETH, valued at around $541 million. Their liquidation prices are significantly lower, near $1,075 and $1,029, representing a deeper capitulation scenario should selling pressure intensify further.
It is important to note that liquidation estimates depend heavily on leverage assumptions, collateral adjustments, and evolving market conditions. Still, these zones provide a useful framework for understanding where volatility could increase, as leveraged positions historically tend to magnify both downward cascades and eventual stabilization phases in crypto markets.
Ethereum’s weekly chart shows a decisive deterioration in market structure after losing the psychologically important $2,000 level. Price has broken below the 50-week and 100-week moving averages, signaling a shift from late-cycle consolidation into a more defensive phase. This type of multi-MA breakdown historically reflects declining momentum rather than a simple short-term correction.

Volume behavior reinforces this interpretation. The latest downside move is accompanied by expanding sell-side volume, suggesting distribution rather than passive retracement. When rising volume coincides with lower highs and lower lows, it typically confirms sustained selling pressure rather than temporary volatility.
Technically, the next key support zone appears between roughly $1,600 and $1,750, where prior consolidation occurred in earlier market phases. A weekly close below this range would likely expose deeper liquidity pockets toward the $1,300 region, aligning with previously identified liquidation clusters.
From a trend perspective, Ethereum is now trading below all major weekly moving averages, which often caps upside attempts unless reclaim levels occur quickly. For recovery credibility, price would need to regain the $2,200–$2,400 region and stabilize above it.
Featured image from ChatGPT, chart from TradingView.com
Editorial Process for bitcoinist is centered on delivering thoroughly researched, accurate, and unbiased content. We uphold strict sourcing standards, and each page undergoes diligent review by our team of top technology experts and seasoned editors. This process ensures the integrity, relevance, and value of our content for our readers.
Ethereum price started a fresh decline below $3,500. ETH is attempting to recover from $3,050 but faces resistance near $3,500.
- Ethereum started another bearish wave after it settled below $3,550.
- The price is trading below $3,500 and the 100-hourly Simple Moving Average.
- There was a break above a bearish trend line with resistance at $3,410 on the hourly chart of ETH/USD (data feed via Kraken).
- The pair could continue to move down if it trades below $3,320.
Ethereum Price Faces Resistance
Ethereum price failed to stay in a positive zone and started a fresh decline below $3,500, like Bitcoin. ETH price declined below $3,450 and $3,350 to enter a bearish zone.
The decline gained pace below $3,250. Finally, the bulls appeared near $3,050. A low was formed at $3,058 and the price recently started a recovery wave. There was a move above the 23.6% Fib retracement level of the downward move from the $3,920 swing high to the $3,058 low.
Besides, there was a break above a bearish trend line with resistance at $3,410 on the hourly chart of ETH/USD. However, the bears remained active below $3,500 and the 50% Fib retracement level of the downward move from the $3,920 swing high to the $3,058 low.
Ethereum price is now trading below $3,400 and the 100-hourly Simple Moving Average. If there is another recovery wave, the price could face resistance near the $3,450 level. The next key resistance is near the $3,480 level.

The first major resistance is near the $3,500 level. A clear move above the $3,500 resistance might send the price toward the $3,550 resistance. An upside break above the $3,550 region might call for more gains in the coming days. In the stated case, Ether could rise toward the $3,740 resistance zone or even $3,800 in the near term.
Another Decline In ETH?
If Ethereum fails to clear the $3,480 resistance, it could start a fresh decline. Initial support on the downside is near the $3,320 level. The first major support sits near the $3,260 zone.
A clear move below the $3,260 support might push the price toward the $3,150 support. Any more losses might send the price toward the $3,050 region in the near term. The next key support sits at $3,020 and $3,000.
Technical Indicators
Hourly MACD – The MACD for ETH/USD is losing momentum in the bearish zone.
Hourly RSI – The RSI for ETH/USD is now above the 50 zone.
Major Support Level – $3,260
Major Resistance Level – $3,500
Opeyemi is a proficient writer and enthusiast in the exciting and unique cryptocurrency realm. While the digital asset industry was not his first choice, he has remained absolutely drawn since making a foray into the space over two years. Now, Opeyemi takes pride in creating unique pieces unraveling the complexities of blockchain technology and sharing insights on the latest trends in the world of cryptocurrencies.
Opeyemi savors his attraction to the crypto market, which explains why he spends the better parts of his day looking through different price charts. “Looking” is a rather simple way to describe analyzing and interpreting various price patterns and chart formations. However, it appears that is not Opeyemi’s favorite part – in fact, far from it.
Being able to connect what happens on a price chart to on-chain movements and blockchain activities is what keeps Opeyemi ticking. “This emphasizes the intricacies of blockchain technology and the cryptocurrency market,” he would say. Most importantly, Opeyemi thinks of any market insights as the gospel, while recognizing that he is only a messenger.
When he is not clicking away at his keyboard, Opeyemi is most definitely listening to music, playing games, reading a book, or scrolling through X. He likes to think he is not loyal to a particular genre of music, which can be true on many days. However, the fast-rising Afrobeats genre is a staple in Opeyemi’s Spotify Daily Mix.
Meanwhile, Opeyemi is a voracious reader who enjoys a wide category of books – ranging from science fiction, fantasy, and historical, to even romance. He believes that authors like George R. R. Martin and J. K.
Rowling are the greatest of all time when it comes to putting pen to paper. Opeyemi believes his reading of the Harry Potter series twice is proof of that.
Indeed, Opeyemi enjoys spending most of his time within the four walls of his home. However, he also sometimes finds solace in the company of his friends at a bar, a restaurant, or even on a stroll. In essence, Opeyemi’s ambivert (haha! been searching for an opportunity to use the word to describe myself) nature makes him a social chameleon who is able to quickly adapt to different settings.
Opeyemi recognizes the need to constantly develop oneself in order to stay afloat in a competitive and ever-evolving market like crypto. For this reason, he is always in learning mode, ready to pick up the slightest lesson from every situation. Opeyemi is efficient and likes to deliver all that is required of him in time – he believes that “whatever is worth doing at all is worth doing well.” Hence, you will always find him striving to be better.
Ultimately, Opeyemi is a good writer and an even better person who is trying to shed light on an exciting world phenomenon – cryptocurrency. He goes to bed every day with a smile of satisfaction on his face, knowing that he has done his bit of the holy assignment – spreading the crypto gospel to the rest of the world.
Reason to trust
![]()
Strict editorial policy that focuses on accuracy, relevance, and impartiality
Created by industry experts and meticulously reviewed
The highest standards in reporting and publishing
Strict editorial policy that focuses on accuracy, relevance, and impartiality
Morbi pretium leo et nisl aliquam mollis. Quisque arcu lorem, ultricies quis pellentesque nec, ullamcorper eu odio.
Bitcoin has entered an important zone in recent days, with the $94,500 price area standing out as an increasingly important battleground for its short-term trajectory. Although the leading cryptocurrency has made several attempts to clear this region during its latest rally, it has faced repeated rejections, highlighting the presence of strong resistance.
Despite these setbacks, on-chain data indicates significant whale accumulation noted on crypto exchanges, hinting that the bullish undercurrent is still strong as Bitcoin looks to end April 2025 on a postive close.
Heavy Resistance Cluster Between $94,125 And $99,150
According to crypto analyst Ali Martinez, who shared insights from on-chain analytics platform IntoTheBlock, Bitcoin is encountering heavy resistance between the $94,125 and $99,150 price range.
Related Reading
Notably, his post on social media platform X shows that approximately 2.61 million wallet addresses have accumulated about 1.76 million BTC within this zone, making it one of the densest supply barriers Bitcoin has faced in its current market cycle.
As shown in the chart below, about 1.26 million addresses hold close to 843,000 BTC between $94,125 and $96,582, while another 1.35 million addresses are clustered between $96,582 and $99,146, holding roughly 917,000 BTC. This concentration of holders creates a formidable wall that Bitcoin must breach decisively if it is to continue its upward march into the next month.
A strong and decisive daily or weekly close above $96,600 could invalidate the overhead resistance here, placing the next target zone at $99,150. Ultimately, the buying momentum here would clear the path for the Bitcoin price to finally target $100,000 and beyond again.
Conversely, repeated failures at this zone could cause a retest of lower support levels around $93,000 and $84,000, which also have significant volumes of 678,000 BTC and 759,150 BTC, respectively.
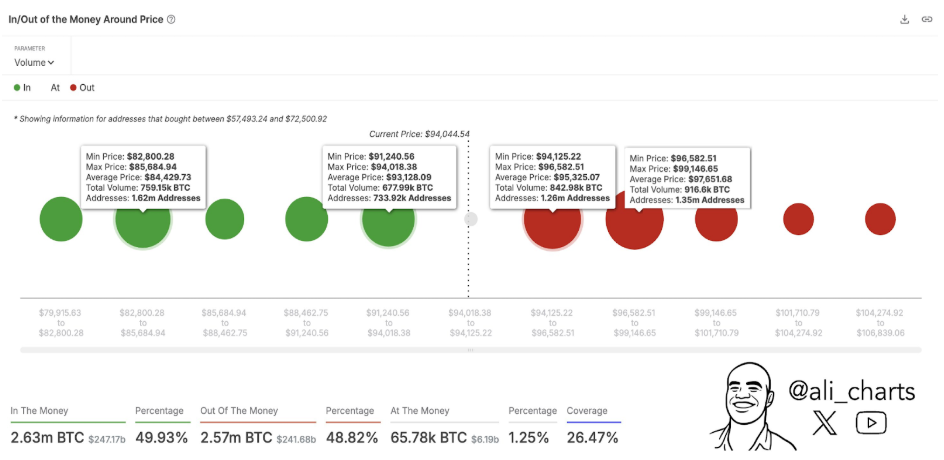
Image From X: ali_charts
Bitcoin’s Bullish Structure Still Intact
Even as the $94,000 to $99,000 resistance zone poses a near-term challenge, technical patterns suggest that Bitcoin’s rally is just beginning. Another prominent crypto analyst, known as Titan of Crypto, reaffirmed that Bitcoin’s long-term price target of around $125,000 is still valid.
This target is derived from a massive Inverse Head and Shoulders (H&S) pattern identified on the Bitcoin monthly candlestick chart.
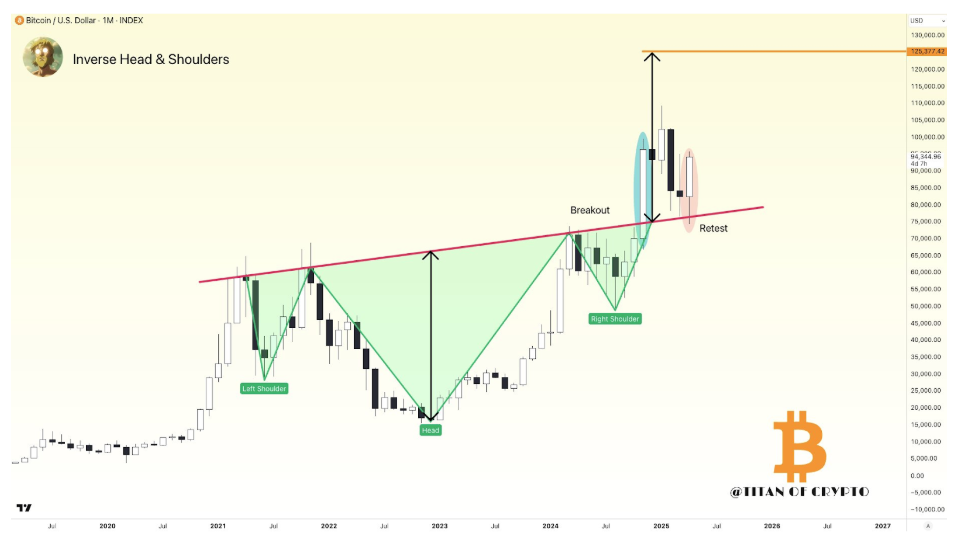
Image From X: Titan of Crypto
The chart shows a clear breakout above the neckline of the Inverse H&S formation earlier this year when Bitcoin pushed to its current all-time high around $108,790. Since then, the price action has been followed by a retest that is holding firm above a support trendline on the monthly timeframe.
Related Reading
According to the analyst, this technical structure shows that Bitcoin is well-positioned to rebound and reach a new all-time high of $125,000 very soon. Of course, this timeline will also depend on whether the current support zone around $85,000 to $87,000 holds steady.
At the time of writing, Bitcoin is trading at $94,147
Featured image from Unsplash, chart from TradingView
538.04 Trillion Shiba Inu Cluster Holding Back SHIB Upsurge: What’s Next The Crypto Basic
Source link ]]>
430 Trillion SHIB Price Cluster: What Will Shiba Inu Bulls Do? U.Today
Source link ]]>
435 Trillion Shiba Inu (SHIB) Cluster: What Can Happen There? U.Today
Source link ]]>
19 Trillion Shiba Inu (SHIB) Cluster: Here’s What It Implies U.Today
Source link ]]>