The industry is realizing that Bitcoin was deliberately designed to prioritize simple, deterministic validation over complex on-chain execution. This design choice minimizes resource requirements, preserves decentralization, and reduces systemic risk even if it means pushing complex logic, programmability, and heavy computation to higher layers or external systems.
How Bitcoin Avoids Complex State Transitions
The fundamental limitation of Bitcoin is its inability to run heavy verification logic at a low cost, a core constraint that every BitVM-based bridge must navigate. According to the GOAT Network post on X, to address these issues, they are introducing a BitVM2 design that will ensure disputes are affordable enough to be executed under real fee conditions. The security mechanism is addressed through optimistic verification using garbled circuits (GC).
Related Reading
This operator, which is set to launch soon, publishes the garbled-circuit artifacts off-chain, while committing only the relevant labels on-chain. If the computation is correct, no on-chain action will be required. Meanwhile, if something is wrong, a challenger does not need to replay an expensive computation on-chain.
Instead, they produce a minimal fraud-proof to reveal the output “0” label that contradicts the operator’s claimed result. At that point, the on-chain step is about demonstrating a contradiction, which will reduce the cost of disputes and change the economics of security.
A practical detail in BitVM designs is that the garbled circuit size matters, and pairing heavy verification can cause bloated circuits. To avoid this, BitVM2 integrates a designated-verifier SNARK, which reduces verifier complexity so that the garbled circuits remain within realistic size limits. For end users, the implication is that the cheaper, more reliable depute paths make it harder for the bridge to stall when the fees spike.
Public Companies Are Becoming Bitcoin’s Strongest Buyers
While several projects are being introduced to improve the efficiency of Bitcoin, seasoned crypto expert and the founder of the Wealth Mastery Newspaper, Lark Davis, has revealed that many public companies are aggressively accumulating BTC. Currently, public companies collectively hold 1.09 million BTC, representing 5.1% of the total BTC supply, which is a new all-time high.
Related Reading
However, the latest major aggressive purchases have come from MicroStrategy and Metaplanet. Strategy just announced another 1,200 BTC purchase, pushing its total holdings to 672,000 BTC. Asia-based firm Metaplanet also bought an additional 4,200 BTC in December, bringing its total holdings to 35,000 BTC.

Davis pointed out that other recent purchases have come from Cango Inc., Bitdeer Technologies, and Anap Holdings. While retail investors are demonstrating weakening sentiment, public companies or institutional investors continue to stack regardless of the ongoing market.
Featured image from Pixabay, chart from Tradingview.com
Dogecoin Recovery Grows as Complex Pullback Ends and Bulls Prepare for Pump Live Bitcoin News
Source link ]]>
Can Shiba Inu Coin Delete 3 Zeros After Analyst Calls SHIB a Complex Investment The Market Periodical
Source link ]]>
Expert Says People Who Learn About Shiba Inu Will Win as SHIB is a Complex Tech Investment The Crypto Basic
Source link ]]>
Reason to trust
![]()
Strict editorial policy that focuses on accuracy, relevance, and impartiality
Created by industry experts and meticulously reviewed
The highest standards in reporting and publishing
Strict editorial policy that focuses on accuracy, relevance, and impartiality
Morbi pretium leo et nisl aliquam mollis. Quisque arcu lorem, ultricies quis pellentesque nec, ullamcorper eu odio.
Ethereum (ETH) is showing signs of a bullish breakout, forming a complex Inverse Head and Shoulder (iH&S) pattern on the weekly timeframe. This key technical formation suggests that the Ethereum price is on track for a massive rally toward a bullish target of $18,000.
Ethereum Forms Inverse Head & Shoulder Pattern
The Ethereum price has been in a long consolidation period, experiencing a crash amid the ongoing market turmoil. Despite recording massive declines that have pushed its value significantly below all-time highs, crypto analyst Gert van Lagen on X (formerly Twitter) predicts that ETH could still reach a price target of $18,000.
Related Reading
Notably, Ethereum recently bounced off the $1,800 – $2,000 support range, which previously served as resistance during the ‘Head’ phase of the iH&S pattern. With this crucial retest confirmed, ETH may be entering the final stage of its reversal, set up to new all-time highs.
Lagen’s $18,000 bullish target is more than 8X Ethereum’s current price, underscoring the sheer magnitude of this projection. Lagen has identified the formation of the iH&S structure on the Ethereum chart, supporting his ambitious prediction with this renowned bullish chart pattern.
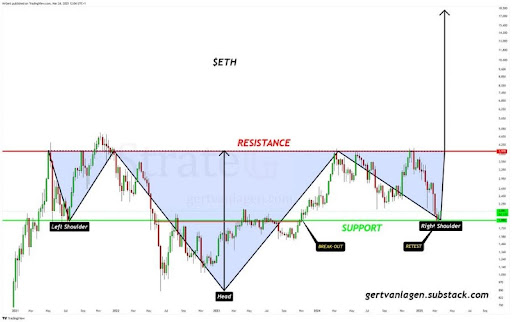
The Inverse Head and Shoulder is a classic bullish reversal structure, often signaling the end of a downtrend and the beginning of a strong and new uptrend. Considering the Ethereum’s price has been in a downturn, the formation of the iH&S chart pattern suggests that this prolonged decline may be finally coming to an end.
In the analyst’s chart, this left shoulder of the iH&S structure began forming from 2021 to 2022, experiencing a price peak before a pullback. From 2022 to 2023, a deeper decline occurred, marking the cycle low and the formation of the ‘Head.’ Finally, the right shoulder of the technical pattern was formed between 2024 to 2024, recording a higher low that aligned with the left shoulder.
Lagen’s price chart highlights that the most critical level to watch is the neckline of the iH&S structure, which is approximately $3,978 and acts as the primary resistance area.
How An $18,000 ETH Target Is Possible
Still looking at Lagen’s Ethereum price chart, the analyst suggests that if ETH can surpass the $3,978 resistance level with strong volume, it could validate the Inverse Head and Shoulder pattern and open the door for a rally toward $18,000. Conversely, if Ethereum fails to break above this resistance level, a prolonged consolidation or significant pullback may occur before its next breakout attempt.
Related Reading
Lagen predicts that a rejection at the resistance area could see the Ethereum price drop to $1,888 — an important support level which could prevent further declines. A drop to this support would represent a potential 52% dip from the main resistance level and an 8.52% decline from ETH’s current market value of $2,055.
Featured image from Unsplash, chart from Tradingview.com
Rick Ross Gives Tour of $3.5M Houston Mansion Complex
Source link ]]>
Cheems, the ‘Dogecoin’ Meme Dog, Has Passed Away After Battling … Complex
Source link ]]>
Memes Become Money: The Not So Complex Ecosystem Of DogeMiyagi, Pepecoin And Shiba Inu Analytics Insight
Source link ]]>
Carlossy Caterpillar and Shiba Inu – The Meme Coins Making Money For Their Users With Lesser Complex Features Compared To Ethereum Analytics Insight
Source link ]]>
- Cardano price closed last week with a 6.89% gain after failing to hold gains above the 2018 high of $1.40.
- ADA has shaped a head-and-shoulders pattern with a measured move of approximately 60%.
- IOMAP metric indicates that the digital token faces limited resistance (out of the money addresses) to claiming the 2018 high.
Cardano price staged a rebound in July after dropping near the 38.2% Fibonacci retracement at $0.971, marking the fifth consecutive month of a bullish reversal from the level. Despite another bullish reversal, the ADA outlook remains mixed with the 2018 high still inflicting heavy resistance on breakout attempts. Only a daily close above $1.498 would transition the outlook to moderately positive.
Cardano price cannot discover follow-through
Cardano price has climbed 30.25% since July 21 after the daily Relative Strength Index (RSI) registered an oversold reading for the first time since September 2020. The 30.25% gain is on the lower end of the performance spectrum for altcoins, but it has positioned ADA again at the 2018 high of $1.40. Moreover, it ensured the fifth consecutive month of support around the 61.8% retracement level.
Also, note in the monthly chart below that Cardano price has failed to record a monthly close above the 2018 high on five of the past six months, despite trading above at some point. Further technical evidence of the roadblock that confronts ADA.
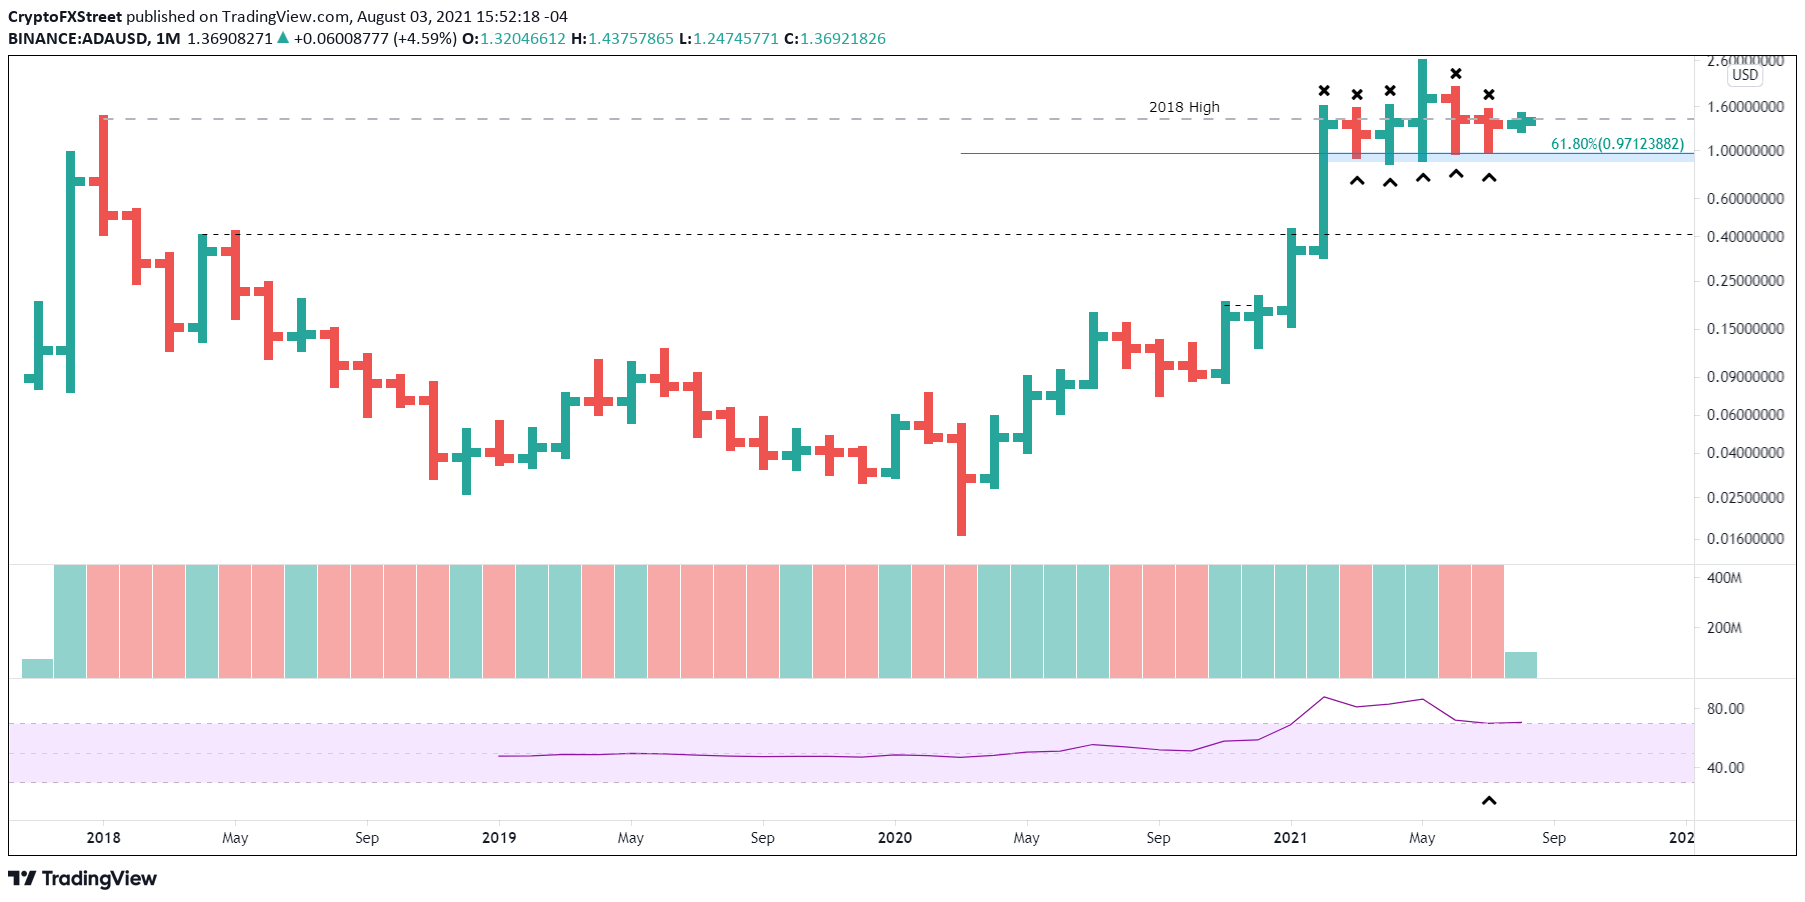
ADA/USD monthly chart
The rebound has clarified the Cardano price structure, introducing a head-and-shoulders pattern with a measured move of just over 60% and a price target of $0.375 based on the 61.8% retracement level of the advance from the March 2020 low as the neckline. A drop of that magnitude would undermine support at the 50-week simple moving average (SMA) at $0.784 and press ADA below the April 2018 high of $0.410.
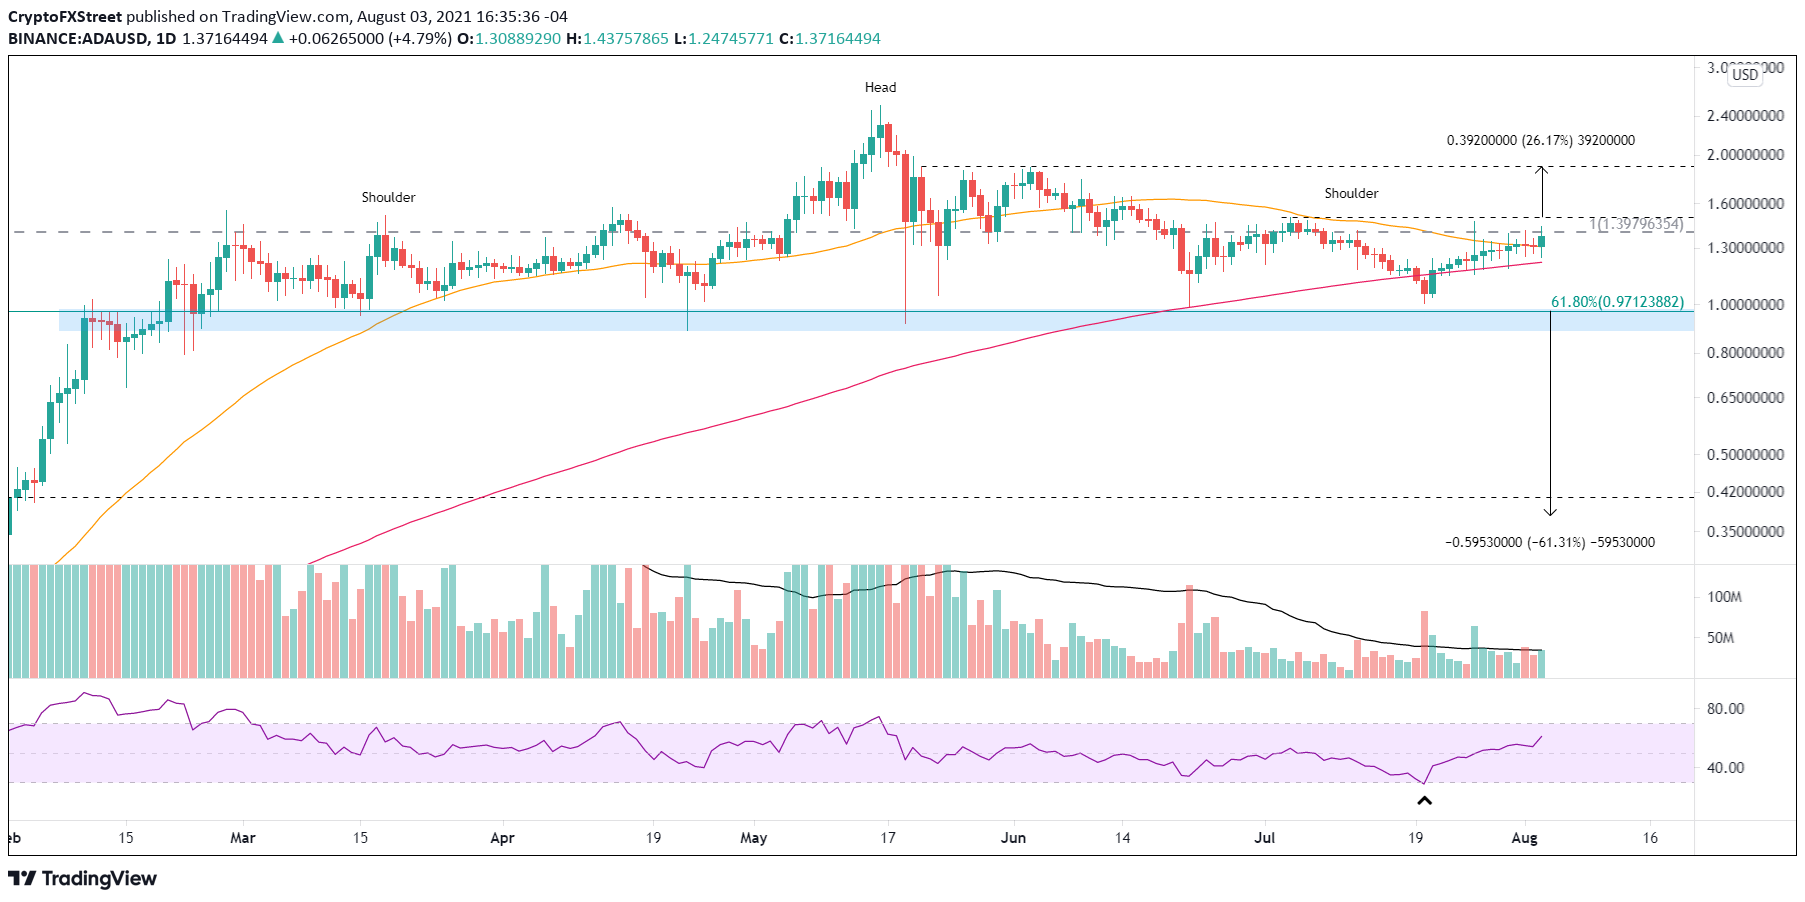
ADA/USD daily chart
A positive outlook would emerge with a daily close above the July 4 high of $1.49. As a result, Cardano price would be exposed to the potential for an ADA rally to the first notable layer of resistance around $1.89, which yields a 26% gain from the July 4 high.
Even so, the question remains whether Cardano price can hold the gains into the month’s close, thereby forcing a conservative trading posture.
With the 2018 high serving as the enemy of Cardano price, it is interesting to note that the IntoTheBlock In/Out of the Money Around Price (IOMAP) metric reveals minor resistance to $1.58. The cluster between $1.38 to $1.42 shows just 51.8k addresses (out of the money) holding 510.66 million ADA at an average price of $1.40. It is not the type of weight that the charts seem to indicate.
There is a slight bump up in out of the money addresses between $1.42 and $1.46, but again, it is minor compared to the heavy support (in the money addresses) from $1.37 to $1.17.
Overall, the IOMAP suggests that Cardano price is poised to tackle the 2018 high and the July 4 high of $1.498 with relative ease.
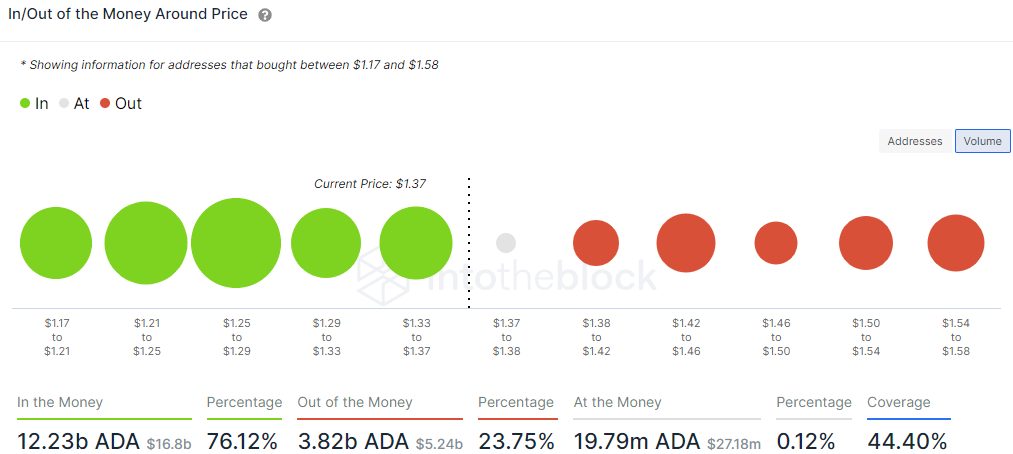
ADA IOMAP – IntoTheBlock
The on-chain metric IOMAP marks a bullish departure from the bearish technicals displayed on various timeframes. Nevertheless, until Cardano price can show follow-through and log a close above the July 4 high, the short-term outlook remains neutral-to-bearish as the head-and-shoulders pattern carries serious bearish implications for ADA.