Bitcoin’s technical structure is flashing a rare and powerful signal. Despite a recent price dip, a bearish-sounding Death Cross has just triggered precisely at a major structural support, the lower boundary of a long-term pattern. This bullish confluence, where historical market bottoms align with key technical support, suggests that the correction is complete and a significant upward bounce is imminent in the short term.
$100,460 Range Low Now Flipped Into Key Resistance
BTC has officially lost the range low and slipped to the $96,000 area, according to Lennaert Snyder, who outlined a clear game plan for the days ahead. He noted that the former range low of $100,460 has now flipped into a key resistance level, shaping the next phase of market behavior.
Snyder explained that if Bitcoin retests the $100,460 mark, the reaction will determine the next move. A rejection at that level would favor short setups, while a successful reclaim would open the door for bullish opportunities.

Should BTC reclaim the range low, Snyder expects bullish momentum to kick in, with the first target sitting near the $103,460 resistance area. A push into that zone would signal that buyers are regaining meaningful control over the market.
Despite the recent drop, Snyder emphasized that there’s still plenty of liquidity and support below current prices while watching for deeper tests that could provide long entries once reversal signals begin to form. Overall, the market remains technically clean, and price action continues to respect every level with precision.
Death Cross Triggers At Megaphone Support — Timing Could Be Perfect For Bitcoin
According to a recent post by Colin Talks Crypto, Bitcoin has just flashed a major signal, the Death Cross, which has historically aligned with market bottoms rather than tops despite its ominous name. What makes this even more compelling is its perfect timing: the setup triggered at the exact moment BTC touched the lower boundary of its expanding megaphone pattern.
The expert noted that this scenario was projected weeks in advance, with mid-November marked as the window to watch. Right on schedule, Bitcoin has landed precisely where the analysis suggested it would.
Colin explained that death crosses often act as bottom markers at the tail end of downtrends. Pairing that with BTC hitting a major structural support gives the setup even stronger bullish undertones. It’s not just a technical coincidence – it’s a confluence backed by pattern behavior.
With these elements lining up, he believes the probability of an upward reaction from here is high. The chart structure now favors a short-term bounce, suggesting that Bitcoin could soon shift away from weakness and begin carving out a recovery move.
]]>Bitcoin’s market structure is showing signs of cycle alignment that could delay a true bottom until October. As technical signals converge, the focus shifts to whether this timing will mark a deeper continuation of the correction or the groundwork for a stronger rebound.
Macro Picture Remains Bearish With $99,000 Target
In a new insight shared on X, analyst TARA provided an update on Bitcoin’s price action, stating that “the fight continues” and that the internal “waves are such a mess right now.” The current situation reflects a highly complex market environment where the short-term and mid-term technical signals are contradictory: the immediate trend is categorized as bullish, while the medium-term outlook remains bearish.
The analyst noted that Bitcoin found support at a critical technical cluster defined by a 0.618 extension and a specific 0.854 support level, a confluence that indicates buyers stepped in decisively. TARA emphasizes the significance of this hold, stating that if Bitcoin had dropped any lower, it would have “invalidated any short-term bullish scenarios.

Despite the short-term strength, Bitcoin has yet to test the resistance, which is now identified at $114,400. TARA points to this level as the immediate target if the price can successfully turn around and continue its current upward trajectory. However, TARA concludes with a strong reminder about the macro trend, which remains bearish, with the full target for this entire correction remaining at approximately $99,000.
Time Cycles Point To Bearish TK Cross Formation
Dr. Cat, in a recent update, explained that a renewal of the September 25th low at $108,652 after September 28th would be a critical signal for Bitcoin. Such a move would indicate a continuation of the bearish trend, suggesting that the market may not find a bottom before October 1st, with the possibility extending toward October 3rd (±2 days) based on the daily chart outlook.
If the low is revisited, it would likely cause the Kijun Sen to turn downward, setting up a valid bearish Tenkan-Kijun (TK) cross. Meanwhile, the Chikou Span (CS) is also positioned in a way that shows it is preparing for its own bearish cross, further reinforcing the possibility of continued downside pressure.
Dr. Cat reminded followers of a prediction made roughly three weeks earlier, where the analyst stated that the market bottom should not be expected before October. That earlier analysis was grounded on the monthly chart.
Now, the daily chart appears to be coming into alignment with the monthly outlook. If Bitcoin does in fact renew the September low within the stated timeframe, this would likely serve as the trigger confirming the bearish continuation.
]]>Dogecoin’s Symmetrical Triangle Breakout and ETF Catalysts: A Confluence of Institutional Momentum and Technical Precision AInvest
Source link ]]>
Cardano (ADA) is moving higher from the $0.350 support. ADA could rally if there is a clear move above the $0.388 and $0.395 resistance levels.
- ADA price is moving higher above the $0.375 pivot level.
- The price is trading above $0.380 and the 100 simple moving average (4 hours).
- There is a key bullish trend line forming with support near $0.370 on the 4-hour chart of the ADA/USD pair (data source from Kraken).
- The pair could accelerate higher toward the $0.420 level or even $0.450.
Cardano Price Rally Could Soon Restart
After a steady increase, Cardano saw a downside correction from the $0.4090 zone. There was a drop below the $0.395 and $0.388 support levels, like Bitcoin and Ethereum.
However, the bulls were active near the $0.350 support zone. A low was formed near $0.3494 and the price is now moving higher. There was a break above the $0.365 and $0.375 resistance levels. The price climbed above the 50% Fib retracement level of the downward move from the $0.4090 swing high to the $0.3494 low.
ADA is now trading above $0.375 and the 100 simple moving average (4 hours). There is also a key bullish trend line forming with support near $0.370 on the 4-hour chart of the ADA/USD pair.
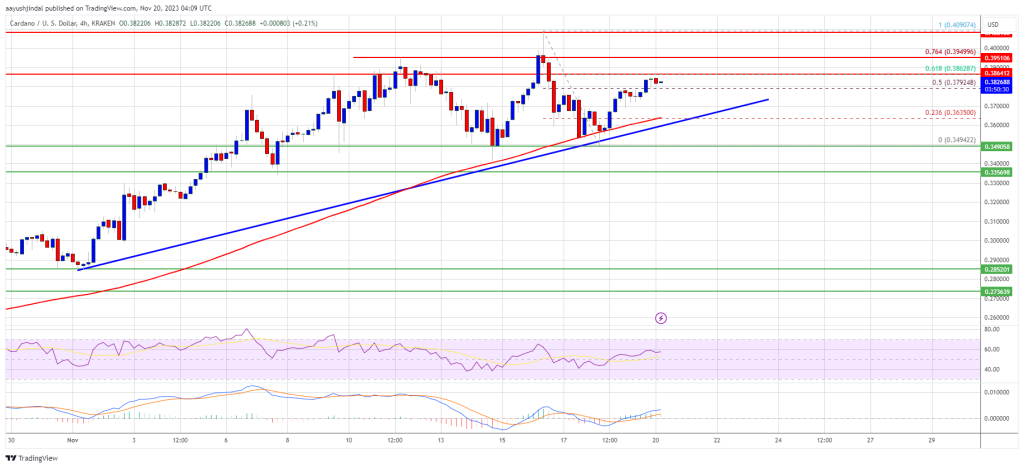
Source: ADAUSD on TradingView.com
On the upside, immediate resistance is near the $0.3880 zone or the 61.8% Fib retracement level of the downward move from the $0.4090 swing high to the $0.3494 low. The first resistance is near $0.395. The next key resistance might be $0.400. If there is a close above the $0.400 resistance, the price could extend its rally. In the stated case, the price could rise toward the $0.420 region. Any more gains might call for a move toward $0.450.
Are Dips Supported in ADA?
If Cardano’s price fails to climb above the $0.388 resistance level, it could start a downside correction. Immediate support on the downside is near the $0.370 level and the trend line.
The next major support is near the $0.365 level and the 100 hourly SMA. A downside break below the $0.365 level could open the doors for a test of $0.350. The next major support is near the $0.335 level.
Technical Indicators
4 hours MACD – The MACD for ADA/USD is gaining momentum in the bullish zone.
4 hours RSI (Relative Strength Index) – The RSI for ADA/USD is now above the 50 level.
Major Support Levels – $0.370, $0.365, and $0.350.
Major Resistance Levels – $0.388, $0.395, and $0.420.
Ethereum price corrected lower from the $1,875 zone against the US dollar. ETH retested the $1,780 zone and might soon attempt a fresh surge.
- Ethereum holds the key support at $1,780 and $1,750.
- The price is trading below $1,820 and the 100-hourly Simple Moving Average.
- There was a break above a steep bearish trend line with resistance near $1,795 on the hourly chart of ETH/USD (data feed via Kraken).
- The pair could start a fresh increase toward the $1,850 and $1,875 resistance levels.
Ethereum Price Revisits Uptrend Support
Ethereum attempted a fresh increase above the $1,850 resistance but upsides were limited, like Bitcoin. ETH traded as high as $1,874 and recently started a downside correction.
There was a move below the $1,850 and $1,820 levels. The price even spiked below the $1,800 level and the 100-hourly Simple Moving Average. It retested the $1,780 support zone. A low is formed near $1,777 and the price is now attempting another increase.
There was a break above a steep bearish trend line with resistance near $1,795 on the hourly chart of ETH/USD. Ethereum is now trading near the 23.6% Fib retracement level of the recent drop from the $1,874 swing high to the $1,777 low.
On the upside, the price is facing resistance near the $1,810 level and the 100-hourly Simple Moving Average. The first major resistance sits at $1,825 or the 50% Fib retracement level of the recent drop from the $1,874 swing high to the $1,777 low.
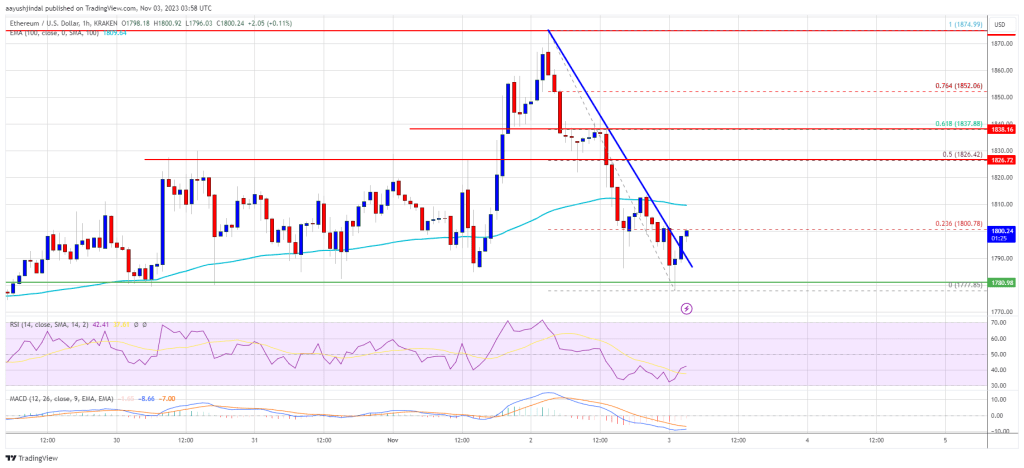
Source: ETHUSD on TradingView.com
If ETH surpasses the $1,825 resistance, it could again start a steady increase and test $1,875. The next key resistance is near $1,920, above which the price could accelerate higher toward the $2,0000 level. Any more gains might call for a move toward the $2,050 level.
More Losses in ETH?
If Ethereum fails to clear the $1,825 resistance, it could continue to move down. Initial support on the downside is near the $1,780 level or the recent low.
The next key support is $1,750. A downside break below the $1,750 support might spark a bearish wave. In the stated case, Ether could drop toward the $1,650 level.
Technical Indicators
Hourly MACD – The MACD for ETH/USD is losing momentum in the bearish zone.
Hourly RSI – The RSI for ETH/USD is now below the 50 level.
Major Support Level – $1,780
Major Resistance Level – $1,825
Ethereum price failed to settle above $1,650 and trimmed gains against the US Dollar. ETH is now trading in a bearish zone and could decline heavily.
- Ethereum peaked near $1,670 and started a fresh decline.
- The price is trading below $1,650 and the 100-hourly Simple Moving Average.
- There is a key bearish trend line forming with resistance near $1,620 on the hourly chart of ETH/USD (data feed via Kraken).
- The pair could gain bearish momentum if there is a close below $1,600 and $1,580.
Ethereum Price Turns Red
Ethereum’s price attempted a fresh increase above the $1,620 pivot level. ETH even broke the $1,650 resistance but the bears were active near the $1,670 level.
As a result, the price failed to continue higher and started a fresh decline below $1,650, like Bitcoin. There was a downside break below the $1,620 level and the 100-hourly Simple Moving Average. The price even retested the $1,600 support zone.
A low is formed near $1,600 and the price is now consolidating losses. Ether is now trading below $1,650 and the 100-hourly Simple Moving Average. Besides, there is a key bearish trend line forming with resistance near $1,620 on the hourly chart of ETH/USD. The trend line is close to the 23.6% Fib retracement level of the downward move from the $1,669 swing high to the $1,600 low.
On the upside, the price might face resistance near the $1,620 level and the trend line. The next resistance is near the $1,635 level or the 50% Fib retracement level of the downward move from the $1,669 swing high to the $1,600 low.
Source: ETHUSD on TradingView.com
The first major resistance is near $1,650, above which the price could rise toward the $1,670 level. The next major hurdle is near the $1,700 level. A close above the $1,700 level might send Ethereum further higher toward $1,750.
Downside Break in ETH?
If Ethereum fails to clear the $1,620 resistance, it could start another decline. Initial support on the downside is near the $1,600 level.
The first key support is close to $1,580. The next key support is $1,540. A downside break below $1,540 might start a major decline toward $1,450. If there is a downside break below $1,450, the price could test the $1,320 support level.
Technical Indicators
Hourly MACD – The MACD for ETH/USD is slowly gaining momentum in the bearish zone.
Hourly RSI – The RSI for ETH/USD is now below the 50 level.
Major Support Level – $1,600
Major Resistance Level – $1,650
Ripple’s token price is holding the $0.485 support against the US Dollar. XRP price could start a recovery wave if it clears $0.510 and $0.525.
- Ripple’s token price is struggling to recover above $0.510 and $0.525 against the US dollar.
- The price is now trading below $0.520 and the 100 simple moving average (4 hours).
- There is a major bearish trend line in place with resistance near $0.5020 on the 4-hour chart of the XRP/USD pair (data source from Kraken).
- The pair might start another decline if it stays below $0.525 in the short term.
Ripple’s Token Price Eyes Recovery
In the past few days, Ripple’s XRP saw a steady decline from the $0.550 resistance against the US Dollar. The price declined below the $0.532 and $0.525 support levels.
It even spiked below the $0.500 support. A low is formed near $0.4863 and the price is now attempting a recovery wave, like Bitcoin and Ethereum. It is now trading near the 23.6% Fib retracement level of the recent decline from the $0.5490 swing high to the $0.4863 low.
XRP is now trading below $0.520 and the 100 simple moving average (4 hours). It is also trading near a major bearish trend line in place with resistance near $0.5020 on the 4-hour chart.
Initial resistance on the upside is near the $0.502 zone and the trend line. The next major resistance is near the $0.518 level or the 50% Fib retracement level of the recent decline from the $0.5490 swing high to the $0.4863 low.

Source: XRPUSD on TradingView.com
The main resistance is forming near $0.525. A successful break above the $0.525 resistance level might send the price toward the $0.532 resistance. Any more gains might call for a test of the $0.550 resistance.
Another Drop in XRP?
If ripple fails to clear the $0.525 resistance zone, it could start another decline. Initial support on the downside is near the $0.490 zone.
The next major support is at $0.485. If there is a downside break and a close below the $0.485 level, XRP’s price could extend losses. In the stated case, the price could retest the $0.450 support zone.
Technical Indicators
4-Hours MACD – The MACD for XRP/USD is now losing pace in the bearish zone.
4-Hours RSI (Relative Strength Index) – The RSI for XRP/USD is now below the 50 level.
Major Support Levels – $0.490, $0.485, and $0.450.
Major Resistance Levels – $0.518, $0.520, and $0.550.
Ripple’s token price is showing bearish signs below $0.580 against the US Dollar. XRP price could start another decline if it trades below $0.480.
- Ripple’s token price is struggling to recover above $0.550 and $0.580 against the US dollar.
- The price is now trading below $0.56 and the 100 simple moving average (4 hours).
- There is a major bearish trend line forming with resistance near $0.580 on the 4-hour chart of the XRP/USD pair (data source from Kraken).
- The pair might start another decline if there is a break below $0.480.
Ripple’s Token Price Faces Uphill Task
After a major decline to $0.40, Ripple’s XRP started an upside correction against the US Dollar. The price recovered a few points above the $0.45 and $0.48 resistance levels, similar to Bitcoin and Ethereum.
The bulls pushed the price above the 50% Fib retracement level of the main decline from the $0.6654 swing high to the $0.3995 low. The price climbed above the $0.50 level. However, the bears are active near the $0.550 resistance zone.
XRP is now trading below $0.56 and the 100 simple moving average (4 hours). There is also a major bearish trend line forming with resistance near $0.580 on the 4-hour chart of the XRP/USD pair.
Initial resistance on the upside is near the $0.550 zone. The next major resistance is near the $0.565 level or the 61.8% Fib retracement level of the main decline from the $0.6654 swing high to the $0.3995 low. The main resistance is now forming near the $0.580 zone and the trend line.
Source: XRPUSD on TradingView.com
A successful break above the $0.580 resistance level might send the price toward the $0.60 resistance or the 100 simple moving average (4 hours). Any more gains might call for a test of the $0.6650 resistance.
Another Drop in XRP?
If ripple fails to clear the $0.565 resistance zone, it could start another decline. Initial support on the downside is near the $0.500 zone.
The next major support is near $0.480. If there is a downside break and a close below the $0.480 level, XRP’s price could extend losses. In the stated case, the price could retest the $0.400 support zone.
Technical Indicators
4-Hours MACD – The MACD for XRP/USD is now losing pace in the bearish zone.
4-Hours RSI (Relative Strength Index) – The RSI for XRP/USD is now below the 50 level.
Major Support Levels – $0.50, $0.480, and $0.40.
Major Resistance Levels – $0.550, $0.565, and $0.580.
Bitcoin price is consolidating above the $26,500 support. BTC could decline heavily if there is a clear move below the $26,500 support.
- Bitcoin is still struggling to stay above the $26,500 support zone.
- The price is trading below $27,250 and the 100 hourly Simple moving average.
- There is a key bearish trend line forming with resistance near $27,220 on the hourly chart of the BTC/USD pair (data feed from Kraken).
- The pair could correct higher, but upsides might be contained above the $27,500 resistance.
Bitcoin Price Holds Support
Bitcoin price remained in a bearish zone below the $27,500 resistance zone. BTC failed to recover and started another decline below $27,000.
There was a spike below the $26,550 support zone but the bulls were active near $26,500. A low is formed near $26,500 and the price is now consolidating losses. It is testing the 23.6% Fib retracement level of the main drop from the $28,450 swing high to the $26,500 low.
Bitcoin price is now trading below $27,250 and the 100 hourly Simple moving average. There is also a key bearish trend line forming with resistance near $27,220 on the hourly chart of the BTC/USD pair.
Immediate resistance on the upside is near the $27,000 level and the trend line. The next major resistance is near the $27,500 level and the 100 hourly Simple moving average. It is close to the 50% Fib retracement level of the main drop from the $28,450 swing high to the $26,500 low.
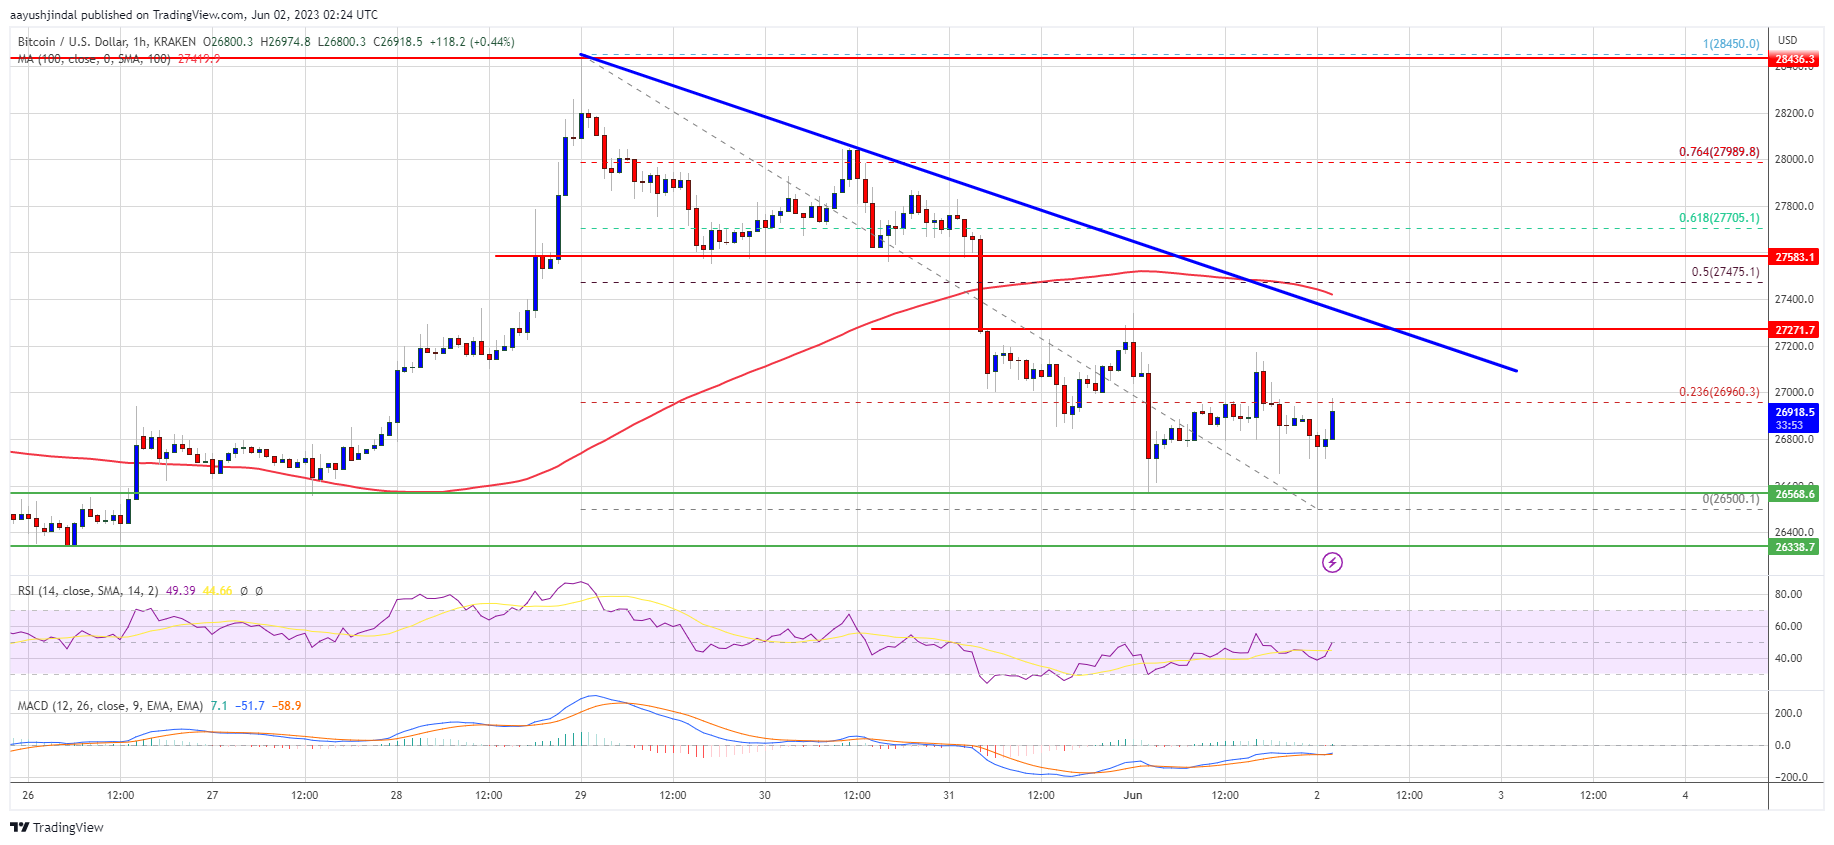
Source: BTCUSD on TradingView.com
An upside break and close above $27,500 could start a decent increase toward $28,000. Any more gains above the $28,000 resistance zone might send the price toward the $28,500 resistance zone or even $29,200.
More Losses in BTC?
If Bitcoin’s price fails to clear the $27,200 resistance, it could continue to move down. Immediate support on the downside is near the $26,560 level.
The next major support is near the $26,500 zone, below which the price might start a strong decline. In the stated case, the price could drop toward the $25,500 support in the coming sessions.
Technical indicators:
Hourly MACD – The MACD is now losing pace in the bearish zone.
Hourly RSI (Relative Strength Index) – The RSI for BTC/USD is below the 50 level.
Major Support Levels – $26,550, followed by $26,500.
Major Resistance Levels – $27,200, $27,400, and $27,500.
Ethereum price is struggling below the $1,840 resistance against the US Dollar. ETH could decline heavily if there is a clear move below the $1,780 support.
- Ethereum is currently facing many hurdles near the $1,840 resistance zone.
- The price is trading below $1,820 and the 100-hourly Simple Moving Average.
- There is a major bearish trend line forming with resistance near $1,825 on the hourly chart of ETH/USD (data feed via Kraken).
- The pair could start a fresh increase if it clears the $1,825 and $1,840 resistance levels.
Ethereum Price Faces Uphill Task
Ethereum’s price remained in a bearish zone below the $1,840 zone. ETH started a fresh decline below the $1,800 level and showed a few bearish signs, similar to Bitcoin.
The price even declined below the $1,780 level. A low is formed near $1,772 and the price is now correcting losses. There was a move above the $1,800 level. The price cleared the 50% Fib retracement level of the downward move from the $1,834 swing high to the $1,772 low.
Ether is now trading above $1,820 and the 100-hourly Simple Moving Average. There is also a major bearish trend line forming with resistance near $1,825 on the hourly chart of ETH/USD.
Immediate resistance is near the $1,820 level. It is close to the 61.8% Fib retracement level of the downward move from the $1,834 swing high to the $1,772 low. The next resistance sits near $1,825 and the trend line, above which Ethereum could rise toward $1,820.
Source: ETHUSD on TradingView.com
If there is a move above the $1,840 resistance level, the price might start a decent increase toward the $1,920 level. Any more gains above the $1,920 resistance zone could start a decent increase toward the $2,000 resistance.
Fresh Decline in ETH?
If Ethereum fails to clear the $1,825 resistance, it could start another decline. Initial support on the downside is near the $1,785 level.
The next major support is near the $1,770 zone. If there is a clear move below the $1,770 support, the price could decline sharply. In the stated case, the price might drop toward the $1,720 support zone. Any more losses may perhaps take the price toward the $1,700 level in the near term.
Technical Indicators
Hourly MACD – The MACD for ETH/USD is gaining momentum in the bearish zone.
Hourly RSI – The RSI for ETH/USD is below the 50 level.
Major Support Level – $1,770
Major Resistance Level – $1,825