
Crypto market analyst Tony Severino took to X this week to explain the current Ethereum (ETH) cycle. The analyst highlighted how different this market cycle has been playing out, with ETH experiencing a prolonged corrective phase that is taking most investors and traders by surprise. Despite ongoing price volatility and bear market trends, Severino notes that Ethereum has yet to reach its final bottom, suggesting the possibility of further downside before a price floor is reached.
Analyst Explains Market Using Ethereum Cycle Theory
On April 7, Severino shared his Ethereum price analysis on X, comparing the current market cycle with past trends. The analyst noted that crypto cycles can run their full course without reaching a new all-time high. Additionally, he said that some cycles may only experience bear market rallies, in which prices consistently form higher lows and lower highs over time.
According to Severino, the biggest challenge most market participants face today is the inability to accept that a cycle may behave differently from historical trends. He added that, currently, many investors believe the Ethereum cycle has not happened, even though it behaved unexpectedly.

Explaining this deviation through a cycle theory, Severino noted that within a full market cycle, there are several smaller degree cycles that make each timeline unique. He referred to these smaller cycles as “intracycle harmonics.” The analyst emphasized that the behavior of these harmonics can change depending on their position within the larger degree cycle. He further added that if an intracycle harmonic exceeds the amplitude of the larger-degree cycle, it could be a warning sign that ETH is in a period dominated by bear-market rallies.
Essentially, Severino suggests that Ethereum’s recent price gains may be temporary or misleading. Even when it seems to be rallying, the broader market structure implies that these moves are likely part of a prolonged weak cycle within a bear market. This means that investors should be cautious about expecting a new all-time high anytime soon.
Ethereum Bottom Not Reached Yet
In his analysis, Severino noted that despite ongoing bearish headwinds and weak action, the Ethereum price has not reached a market bottom yet. In his accompanying chart, he highlighted a pink line above the $2,000 level where ETH is currently holding firmly.
According to the analyst, every time Ethereum has broken this key support line, the cryptocurrency has declined to its market bottom. With ETH’s price now hovering slightly above key support, it suggests that the market could be approaching a floor soon.
Before reaching that point, Ethereum will likely experience another downturn. In his chart, Severino identifies $800 and a level around $440 as ETH’s next potential breakdown target or ultimate price bottoms if it falls below the critical line.
Featured image from iStock, chart from Tradingview.com
Editorial Process for bitcoinist is centered on delivering thoroughly researched, accurate, and unbiased content. We uphold strict sourcing standards, and each page undergoes diligent review by our team of top technology experts and seasoned editors. This process ensures the integrity, relevance, and value of our content for our readers.
Shiba Inu Bearish Continuation Targets 12% Drop to $0.00000523 Cryptonews.net
Source link ]]>
Bitcoin’s recent price action confirms a clear structural breakdown, ending weeks of compression and shifting momentum to the downside. While a short-term bounce remains possible as price fills nearby imbalances, the broader outlook stays bearish. Unless key resistance levels are quickly reclaimed, any upside move is likely to be temporary, with further downside pressure expected.
Rising Channel Breakdown Signals Shift In Structure
According to a BTC update by crypto analyst Columbus, the market structure has finally broken down after weeks of compression. Price had been coiling within a rising channel, forming higher lows that pressed into overhead resistance. Instead of acceptance higher, Bitcoin faced rejection at trend resistance, followed by a decisive breakdown.
Related Reading
Current price action suggests continuation to the downside. What once looked like bullish compression has now transitioned into a potential distribution phase. Key liquidity levels now sit below. The $64,000 region stands as the first major magnet, supported by prior reactions and stacked bids. Beneath that, the $62,000 zone represents a deeper sweep area, especially if selling pressure accelerates.

Earlier expectations were clear: acceptance above resistance would confirm continuation, while rejection would trigger a move lower. However, the market has chosen the latter. Unless price quickly reclaims the channel and holds above the $68,000 level, any upward movement is likely to be a relief rally into supply, with short-term bias remaining bearish while monitoring reactions around $64,000.
Bitcoin 4H Structure Flip Signals Bearish Control
Analyzing Bitcoin’s 4H timeframe, analyst Minga noted that weekends, especially Saturdays, typically come with reduced movement. However, current bias leans neutral to slightly bullish, as price is reacting from the weekly lows region. Holding above the blue order block (OB) below remains key, as it keeps the door open for a potential retest of the $67,300 level.
Related Reading
Despite that short-term bounce, the 4H market structure has already flipped bearish. The recent downside move has also left behind a noticeable imbalance, which the price tends to revisit and fill either over the weekend or heading into early next week.
A successful reclaim of the $67,300 level could trigger a stronger corrective move higher toward $68,800, which now stands as a critical zone for bearish continuation. Thus, any rally into it could present resistance and set the stage for another leg down in line with the broader trend.
There is also a possibility that the price will sweep into the lower boundary of the blue OB before any meaningful move higher. Regardless of the exact path, the imbalance left behind from the previous move is expected to be filled. For that reason, short-term sentiment leans slightly bullish on the lower timeframes, but with a bearish retest before continuation in line with the prevailing downtrend.
Featured image from Getty Images, chart from Tradingview.com
Aayush Jindal, a luminary in the world of financial markets, whose expertise spans over 15 illustrious years in the realms of Forex and cryptocurrency trading. Renowned for his unparalleled proficiency in providing technical analysis, Aayush is a trusted advisor and senior market expert to investors worldwide, guiding them through the intricate landscapes of modern finance with his keen insights and astute chart analysis.
From a young age, Aayush exhibited a natural aptitude for deciphering complex systems and unraveling patterns. Fueled by an insatiable curiosity for understanding market dynamics, he embarked on a journey that would lead him to become one of the foremost authorities in the fields of Forex and crypto trading. With a meticulous eye for detail and an unwavering commitment to excellence, Aayush honed his craft over the years, mastering the art of technical analysis and chart interpretation.
As a software engineer, Aayush harnesses the power of technology to optimize trading strategies and develop innovative solutions for navigating the volatile waters of financial markets. His background in software engineering has equipped him with a unique skill set, enabling him to leverage cutting-edge tools and algorithms to gain a competitive edge in an ever-evolving landscape.
In addition to his roles in finance and technology, Aayush serves as the director of a prestigious IT company, where he spearheads initiatives aimed at driving digital innovation and transformation. Under his visionary leadership, the company has flourished, cementing its position as a leader in the tech industry and paving the way for groundbreaking advancements in software development and IT solutions.
Despite his demanding professional commitments, Aayush is a firm believer in the importance of work-life balance. An avid traveler and adventurer, he finds solace in exploring new destinations, immersing himself in different cultures, and forging lasting memories along the way. Whether he’s trekking through the Himalayas, diving in the azure waters of the Maldives, or experiencing the vibrant energy of bustling metropolises, Aayush embraces every opportunity to broaden his horizons and create unforgettable experiences.
Aayush’s journey to success is marked by a relentless pursuit of excellence and a steadfast commitment to continuous learning and growth. His academic achievements are a testament to his dedication and passion for excellence, having completed his software engineering with honors and excelling in every department.
At his core, Aayush is driven by a profound passion for analyzing markets and uncovering profitable opportunities amidst volatility. Whether he’s poring over price charts, identifying key support and resistance levels, or providing insightful analysis to his clients and followers, Aayush’s unwavering dedication to his craft sets him apart as a true industry leader and a beacon of inspiration to aspiring traders around the globe.
In a world where uncertainty reigns supreme, Aayush Jindal stands as a guiding light, illuminating the path to financial success with his unparalleled expertise, unwavering integrity, and boundless enthusiasm for the markets.
Ethereum is showing signs of strength on two critical fronts at the same time. On-chain activity has climbed to record levels, reflecting heavier real usage across the network, while long-term technical structure is leaning towards upside continuation.
Together, these signals suggest that Ethereum’s current phase may be more than just sideways movement, as underlying data points to sustained demand and constructive price behavior.
Related Reading
Ethereum Daily Transactions Reach New High
Ethereum’s price action is turning bullish with a steady increase in recent days. Notably, on-chain data shows that this increase is on top of steady on-chain activity in recent days.
Data from Ethereum’s on-chain activity shows that daily transactions recently climbed to approximately 2.8 million, setting a new all-time high for the network. Interestingly, this figure stands out not just as a record, but because it is roughly 64% higher than the daily transaction levels observed during the peak of the 2021 bull market.
The chart data from Sentora illustrates a progression showing Ethereum’s transaction count rising steadily over the years and spiking up in early 2026.
Comparing the transaction activity to 2021 adds more context considering the intense amount of activity that the Ethereum network was witnessing at the time. Back then, Ethereum was at the center of an altcoin season and NFT boom, all of which contributed to a spike in transaction activity and a push to new price highs.
The fact that Ethereum is now processing significantly more transactions per day compared to 2021 shows that its network usage has grown above speculative behavior. The steady climb in transaction activity shows the sheer amount of usage across decentralized finance and stablecoin settlement, among many others.
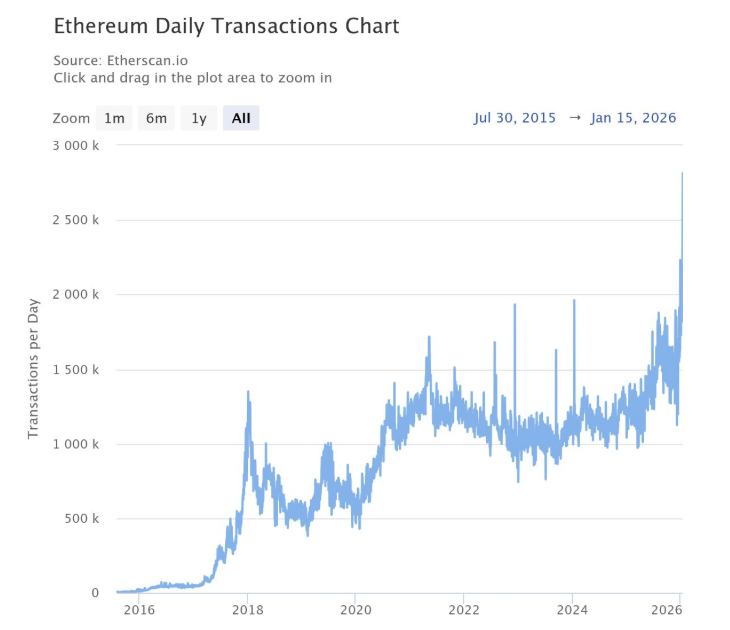
Ethereum Daily Transactions Chart. Source: @SentoraHQ On X
Ethereum Reaccumulation Within A Macro Uptrend
Technical analysis of Ethereum’s market capitalization on the three-week candlestick timeframe shows the cryptocurrency is still trading in a zone of stability. Particularly, technical analysis done by crypto analyst Egrag Crypto suggests that Ethereum is in reaccumulation within a macro uptrend.
A look at the 3-week timeframe shows that ETH’s market cap is holding above the 21 EMA, respecting the rising macro trendline, printing higher highs & higher lows, and compressing under historical resistance. That is constructive behavior, not weakness.
History shows that periods where Ethereum’s market cap held above the 21 EMA on this timeframe have led to expansion phases, whereas sustained moves below it have marked bear market conditions.
Related Reading
At present, the structure indicates the EMA support is being defended. From a probabilistic standpoint, the current setup leans toward continuation rather than breakdown. A move through the overhead resistance band would likely confirm an expansion phase and allow Ethereum to go on a 70% to 75% bullish continuation.
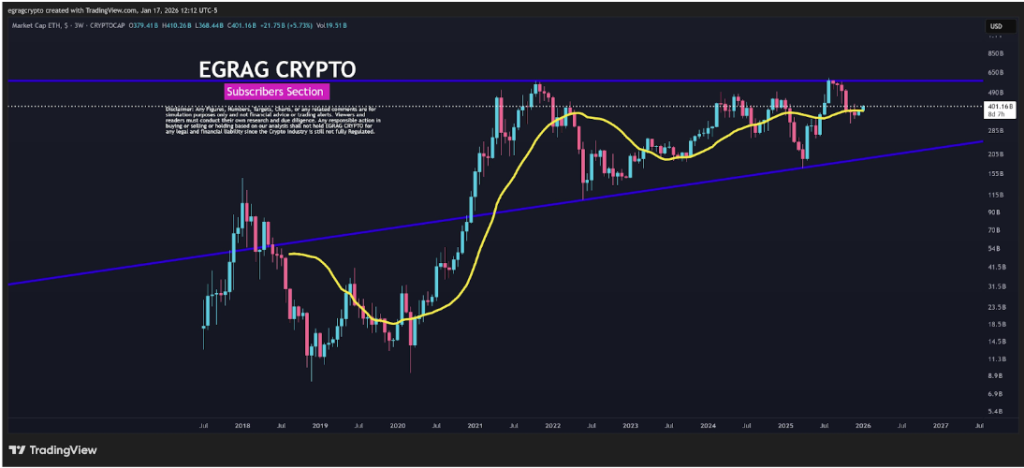
Market Cap ETH. Source: @egragcrypto On X
On the other hand, a bearish outcome will become possible if the price action loses the 21 EMA on the three-week chart. This could validate a deeper 25% to 30% correction toward the lower trendline, but this scenario carries a lower probability.
Featured image from Unsplash, chart from TradingView
Cardano price holds $0.38 support as bullish retest signals continuation crypto.news
Source link ]]>
Aayush Jindal, a luminary in the world of financial markets, whose expertise spans over 15 illustrious years in the realms of Forex and cryptocurrency trading. Renowned for his unparalleled proficiency in providing technical analysis, Aayush is a trusted advisor and senior market expert to investors worldwide, guiding them through the intricate landscapes of modern finance with his keen insights and astute chart analysis.
From a young age, Aayush exhibited a natural aptitude for deciphering complex systems and unraveling patterns. Fueled by an insatiable curiosity for understanding market dynamics, he embarked on a journey that would lead him to become one of the foremost authorities in the fields of Forex and crypto trading. With a meticulous eye for detail and an unwavering commitment to excellence, Aayush honed his craft over the years, mastering the art of technical analysis and chart interpretation.
As a software engineer, Aayush harnesses the power of technology to optimize trading strategies and develop innovative solutions for navigating the volatile waters of financial markets. His background in software engineering has equipped him with a unique skill set, enabling him to leverage cutting-edge tools and algorithms to gain a competitive edge in an ever-evolving landscape.
In addition to his roles in finance and technology, Aayush serves as the director of a prestigious IT company, where he spearheads initiatives aimed at driving digital innovation and transformation. Under his visionary leadership, the company has flourished, cementing its position as a leader in the tech industry and paving the way for groundbreaking advancements in software development and IT solutions.
Despite his demanding professional commitments, Aayush is a firm believer in the importance of work-life balance. An avid traveler and adventurer, he finds solace in exploring new destinations, immersing himself in different cultures, and forging lasting memories along the way. Whether he’s trekking through the Himalayas, diving in the azure waters of the Maldives, or experiencing the vibrant energy of bustling metropolises, Aayush embraces every opportunity to broaden his horizons and create unforgettable experiences.
Aayush’s journey to success is marked by a relentless pursuit of excellence and a steadfast commitment to continuous learning and growth. His academic achievements are a testament to his dedication and passion for excellence, having completed his software engineering with honors and excelling in every department.
At his core, Aayush is driven by a profound passion for analyzing markets and uncovering profitable opportunities amidst volatility. Whether he’s poring over price charts, identifying key support and resistance levels, or providing insightful analysis to his clients and followers, Aayush’s unwavering dedication to his craft sets him apart as a true industry leader and a beacon of inspiration to aspiring traders around the globe.
In a world where uncertainty reigns supreme, Aayush Jindal stands as a guiding light, illuminating the path to financial success with his unparalleled expertise, unwavering integrity, and boundless enthusiasm for the markets.
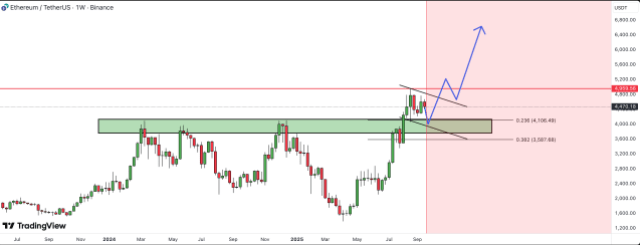
After hitting a new all-time high back in August 2025, the Ethereum price has since slowed down, ranging around $4,200-$4,400 for the most part since the correction. Nevertheless, the cryptocurrency, which is the second-largest digital asset by market cap, is expected to rally again, since it only barely surpassed its previous all-time high by atone $100. For bullish analysts, the target for the cycle still remains that the Ethereum price will cross the $5,000 mark, but will not stop until it crosses above $6,000.
Ethereum Price Remains On The Side Of The Bulls
The recent drawdown, while having beaten the Ethereum price by around 10% since then, has not turned the price action bearish. If anything, crypto analyst HAMED_AZ believes that it is a healthy correction that is helping the altcoin to get ready for the next bullish phase.
One thing that stands out is that the drawdown has led to a corrective phase instead of a freefall. This suggests that the pullback is healthy for the digital asset and is rather bullish, especially as the Ethereum price has continued to maintain an important support zone above $4,100.
With the current corrective phase, the crypto analyst explains that the Ethereum price is now forming a bullish flag pattern. A bullish flag pattern is a continuation pattern that is notoriously known to form after a fast price increase, followed by a brief correction. The last part of the bullish flag pattern is the breakout, and doing so with volume puts the digital asset at a unique advantage to continue its uptrend.
Support Zone Needs To Hold
With the bullish flag pattern that formed on the chart, the only major thing that could derail the Ethereum price is if its support fails. Right now, that support remains firm at $4,100 and continues to hold. HAMED explains that as long as the Ethereum price continues to hold this support, then the price action is still very much bullish.
A breakout from the bullish flag pattern would lead to an impulse wave, and this impulse wave could lead to new all-time highs. An around 50% rally is expected to result from this impulse wave, putting the Ethereum price as high as $6,500 before it is over. “Keep a close eye on the flag breakout and watch for bullish momentum to resume once the consolidation completes,” the analyst stated.
In the event of a break below the support level, though, the Ethereum price could be in trouble. The next major support would reside at the $4,000 psychological level, where the bulls would mount their defense.
Featured image from Dall.E, chart from TradingView.com
Editorial Process for bitcoinist is centered on delivering thoroughly researched, accurate, and unbiased content. We uphold strict sourcing standards, and each page undergoes diligent review by our team of top technology experts and seasoned editors. This process ensures the integrity, relevance, and value of our content for our readers.
Ethereum price started a fresh decline below the $4,550 zone. ETH is now correcting losses and might aim for a move above the $4,650 zone.
- Ethereum started a fresh upward move from the $4,320 zone.
- The price is trading near $4,580 and the 100-hourly Simple Moving Average.
- There was a break above a key bearish trend line with resistance at $4,450 on the hourly chart of ETH/USD (data feed via Kraken).
- The pair could start another increase unless there is a close below $4,460 in the near term.
Ethereum Price Corrects Losses
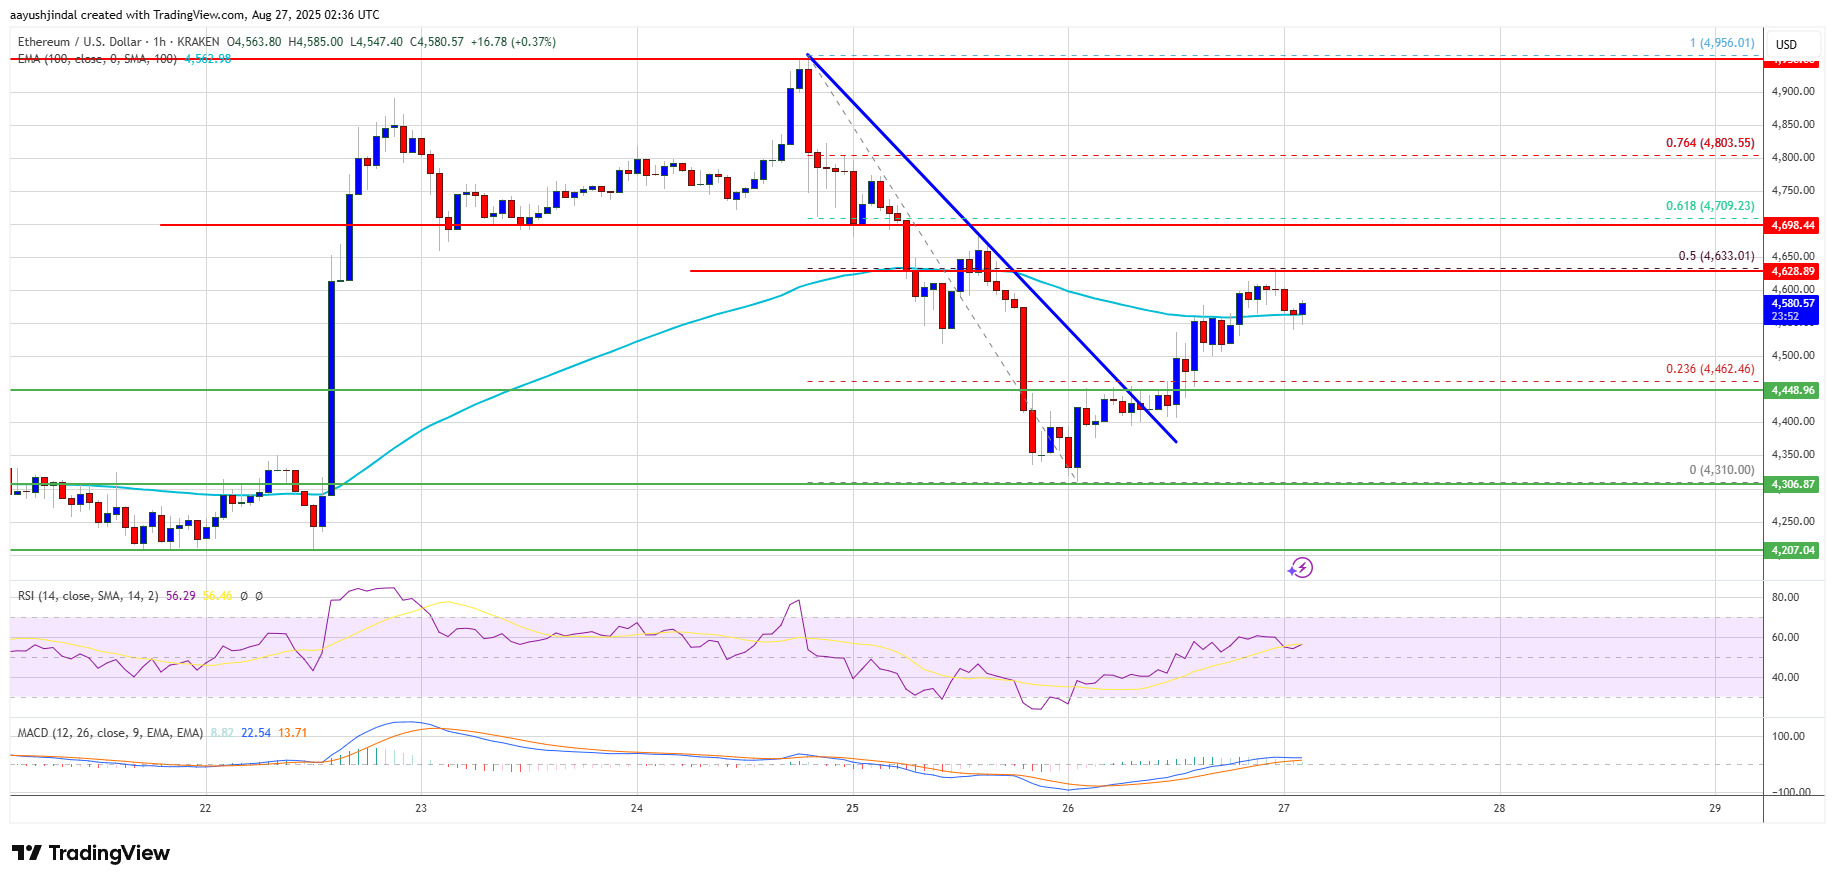
Ethereum price traded to a new all-time high above the $4,950 level before there was a downside correction, unlike Bitcoin. ETH price started a downside correction below the $4,650 and $4,550 levels.
The price tested the $4,320 zone. A low was formed at $4,310 and the price started a fresh upward move. There was a break above $4,400 and $4,450. The price surpassed the 23.6% Fib retracement level of the recent decline from the $4,956 swing high to the $4,310 low.
Besides, there was a break above a key bearish trend line with resistance at $4,450 on the hourly chart of ETH/USD. Ethereum price is now trading near $4,580 and the 100-hourly Simple Moving Average.
On the upside, the price could face resistance near the $4,630 level and the 50% Fib retracement level of the recent decline from the $4,956 swing high to the $4,310 low. The next key resistance is near the $4,650 level. The first major resistance is near the $4,720 level.
A clear move above the $4,720 resistance might send the price toward the $4,840 resistance. An upside break above the $4,840 resistance might call for more gains in the coming sessions. In the stated case, Ether could rise toward the $4,950 resistance zone or even $5,000 in the near term.
Another Drop In ETH?
If Ethereum fails to clear the $4,630 resistance, it could continue to move down. Initial support on the downside is near the $4,500 level. The first major support sits near the $4,450 zone.
A clear move below the $4,450 support might push the price toward the $4,320 support. Any more losses might send the price toward the $4,220 support level in the near term. The next key support sits at $4,150.
Technical Indicators
Hourly MACD – The MACD for ETH/USD is losing momentum in the bearish zone.
Hourly RSI – The RSI for ETH/USD is now above the 50 zone.
Major Support Level – $4,450
Major Resistance Level – $4,630
Bitcoin’s price movements often reflect broader macroeconomic trends. Analysts have uncovered a consistent pattern where BTC’s price follows these shifts with a roughly 12-week delay. With global liquidity now picking up steam, the macro-level signal now points toward a potential bullish phase ahead for BTC.
How Liquidity Trends Fit Into Bitcoin’s Long-Term Cycle
In an X post, Crypto expert MartyParty pointed out a compelling pattern in Bitcoin’s price behavior, stating that its high-timeframe follows global liquidity, indicated on the chart as the blue line following the red line lagged 12 weeks.
Currently, the global liquidity curve is on the rise, and the US has not started issuing new liquidity, meaning the current surge is being fueled externally. MartyParty argues that this global liquidity wave is primed to push BTC toward the $125,000 mark on foreign liquidity issuance.
The current macro thesis suggests that BTC could reach $140,000, driven purely by the influx of foreign liquidity. In the meantime, the upcoming US liquidity issuance is expected to begin within the next quarter and will last up to a year to eighteen months.
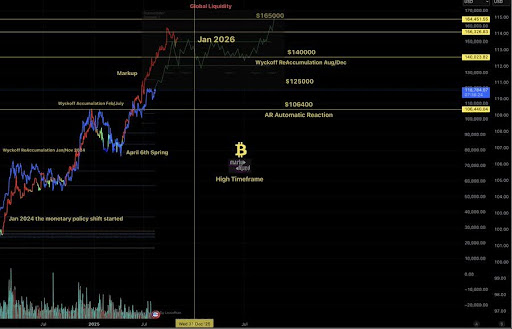
Once the US liquidity kicks in, combined with expected rate cuts that will lower borrowing costs, it will create a compelling setup for the BTC price to potentially rally to $250,000 in the medium to long term.
Daan Crypto Trades has revealed that Bitcoin’s impressive resilience and steady upward trend relative to the US stock market have been trending since its bottom in 2022. Over this period, BTC has experienced only four moderate corrections ranging between 20% and 30%, while delivering a 420% gain from bottom to top. This steady outperformance suggests that BTC has carved out a strong position as a growth asset, especially in risk-on market environments.
How Bitcoin’s Current Energy Value Growth Differs From Past Cycles
Another notable development is the Bitcoin Energy Value, which just reached a new all-time high of $135,000 per BTC. According to StarPlatinum, in previous market cycles, reaching such peaks in Energy Value has been associated with sharp price moves or big drops.
Currently, the rise in Energy Value is gradual and steady, reflecting a more natural market progression. This data reveals several key points about BTC’s current state. First, BTC is stronger and more mature than ever, with demand steadily increasing over time.
Despite hitting a new all-time high on Energy Value, the current price still sits about 15% below this metric, indicating there’s still room to run. Historically, the BTC cycle top occurred when its price surged 40% to 60% above its Energy Value. Meanwhile, many in the crypto community have spent three years saying BTC is close to the top, only to see those calls followed by waves of FOMO.
]]>