
Ethereum is trying to hold above $2,300 as the market navigates another stretch of volatility and uncertainty. The price action remains hesitant, caught between buyers looking for a reason to commit and sellers who have defined this cycle’s derivatives landscape more aggressively than almost any previous period. But according to top analyst Darkfost, something in that landscape just changed — and the shift is significant enough to deserve attention.
Throughout this entire cycle, Ethereum’s derivatives markets have been unusually hostile to bulls. Net taker volume — the measure of how aggressively buyers versus sellers are hitting the market — remained almost consistently negative.
The clearest example came in December 2024, when ETH was pushing toward a new all-time high above $4,000. Rather than buyers chasing the breakout, net taker volume collapsed to -$511 million. It got worse from there. When Ethereum printed its cycle high just below $5,000, the sell-side dominance reached -$568 million. Sellers were not just present at the top — they were overwhelming it.
That pattern defined the entire rally and made every move higher feel contested, expensive, and ultimately unsustainable.
Today, Darkfost notes, the dynamic looks very different. For the first time in this cycle, the picture on derivatives markets appears to be shifting — and what is replacing that persistent sell pressure is worth understanding.
The Sellers Who Defined This Cycle Just Lost the Upper Hand
Since March, the dynamic that defined Ethereum’s entire derivatives market has quietly reversed. Buy-side volumes have taken control, with net taker volume reaching +$102 million today. After months of sellers dominating at every key price level — including the all-time high — buyers are now the ones hitting the market aggressively.

The historical context Darkfost provides is what gives this shift its real weight. The last time Ethereum’s derivatives market showed buying pressure of this magnitude was in 2022 — when ETH was trading around $1,000, near the depths of the previous bear market. That was the last time buyers stepped in with this kind of conviction. What followed from that period is not lost on anyone who has watched Ethereum across multiple cycles.
The implications, if the trend holds, are material. This cycle was defined by a specific and unusual pattern: sellers dominated not just during weakness, but at every attempt at strength. Every rally was met with aggressive supply. That pressure is what made each Ethereum recovery feel fragile and short-lived.
If buyers are now consistently absorbing that supply rather than stepping aside, the structural backdrop for Ethereum is changing. It is early — one data point does not confirm a new regime. But the shift from -$568 million at the peak to +$102 million today is not a small move. It is the kind of reversal that, if sustained, tends to precede something more meaningful than a temporary bounce.
Ethereum Tests Resistance as Recovery Structure Builds
Ethereum is attempting to stabilize above the $2,300 level after recovering from the sharp February capitulation that briefly pushed price below $1,800. The rebound has been constructive in the short term, with price forming a sequence of higher lows since early March. However, the broader structure remains unresolved.

The key technical feature in the current chart is the interaction with the 200-day moving average, which is trending downward and now sits just above price. This level has acted as dynamic resistance, rejecting multiple recovery attempts. The recent move into the $2,350–$2,400 zone was again met with selling pressure, reinforcing that sellers are still defending higher levels.
Volume dynamics add nuance to the picture. The capitulation event in February was accompanied by a clear spike in volume, signaling forced selling and potential exhaustion. Since then, volume has normalized during the recovery, suggesting a more controlled, organic bid rather than aggressive momentum chasing.
Short-term momentum is improving, but Ethereum has yet to confirm a structural shift. A clean break and hold above the 200-day moving average would be required to transition from recovery to trend reversal. Until that happens, the current move appears to be a developing range with resistance overhead and cautious buyers stepping in on dips.
Featured image from ChatGPT, chart from TradingView.com
Editorial Process for bitcoinist is centered on delivering thoroughly researched, accurate, and unbiased content. We uphold strict sourcing standards, and each page undergoes diligent review by our team of top technology experts and seasoned editors. This process ensures the integrity, relevance, and value of our content for our readers.
Dogecoin Price Prediction: DOGE Consolidates Near $0.10 as Bears Stay in Control Cryptonews.net
Source link ]]>
Aayush Jindal, a luminary in the world of financial markets, whose expertise spans over 15 illustrious years in the realms of Forex and cryptocurrency trading. Renowned for his unparalleled proficiency in providing technical analysis, Aayush is a trusted advisor and senior market expert to investors worldwide, guiding them through the intricate landscapes of modern finance with his keen insights and astute chart analysis.
From a young age, Aayush exhibited a natural aptitude for deciphering complex systems and unraveling patterns. Fueled by an insatiable curiosity for understanding market dynamics, he embarked on a journey that would lead him to become one of the foremost authorities in the fields of Forex and crypto trading. With a meticulous eye for detail and an unwavering commitment to excellence, Aayush honed his craft over the years, mastering the art of technical analysis and chart interpretation.
As a software engineer, Aayush harnesses the power of technology to optimize trading strategies and develop innovative solutions for navigating the volatile waters of financial markets. His background in software engineering has equipped him with a unique skill set, enabling him to leverage cutting-edge tools and algorithms to gain a competitive edge in an ever-evolving landscape.
In addition to his roles in finance and technology, Aayush serves as the director of a prestigious IT company, where he spearheads initiatives aimed at driving digital innovation and transformation. Under his visionary leadership, the company has flourished, cementing its position as a leader in the tech industry and paving the way for groundbreaking advancements in software development and IT solutions.
Despite his demanding professional commitments, Aayush is a firm believer in the importance of work-life balance. An avid traveler and adventurer, he finds solace in exploring new destinations, immersing himself in different cultures, and forging lasting memories along the way. Whether he’s trekking through the Himalayas, diving in the azure waters of the Maldives, or experiencing the vibrant energy of bustling metropolises, Aayush embraces every opportunity to broaden his horizons and create unforgettable experiences.
Aayush’s journey to success is marked by a relentless pursuit of excellence and a steadfast commitment to continuous learning and growth. His academic achievements are a testament to his dedication and passion for excellence, having completed his software engineering with honors and excelling in every department.
At his core, Aayush is driven by a profound passion for analyzing markets and uncovering profitable opportunities amidst volatility. Whether he’s poring over price charts, identifying key support and resistance levels, or providing insightful analysis to his clients and followers, Aayush’s unwavering dedication to his craft sets him apart as a true industry leader and a beacon of inspiration to aspiring traders around the globe.
In a world where uncertainty reigns supreme, Aayush Jindal stands as a guiding light, illuminating the path to financial success with his unparalleled expertise, unwavering integrity, and boundless enthusiasm for the markets.
Institutional demand for XRP is slowly creeping back in recent days. Inflows into Spot XRP ETFs in the US are picking up pace, even with price action still subdued under $1.4.
Notably, the latest ETF data shows that a measurable portion of the token’s circulating supply is already being absorbed by these investment vehicles.
ETFs Now Hold A Measurable Slice Of XRP Supply
March was a particularly difficult period for Spot XRP ETFs, with SoSoValue data showing $31.16 million in net outflows for the month. Total XRP assets under management dropped from a January peak of $1.65 billion to below $1 billion due to a combination of XRP’s price falling over 40% and actual investor redemptions.
Related Reading
However, Spot XRP ETFs have now returned to measurable inflows. According to data from SoSoValue, US-listed spot XRP ETFs attracted $9.1 million in net inflows on April 10. This is their strongest single-day intake since February 6, when $15.2 million flowed into the products, and is a sign of new capital entering the XRP ecosystem through institutional investors after months of suspension.
Since launch, Spot XRP ETFs have received a cummulative $1.22 billion in net inflows. Therefore, the scale of XRP accumulation in these ETFs is no longer negligible. Data shows that as of April 14, seven spot XRP ETFs are trading in the United States, with the products collectively holding 771.7 million XRP tokens and a combined AUM of about $959.40 million. The funds now represent approximately 1.16% of XRP’s market capitalization.
Why ETF Accumulation Matters For Price Structure
ETF flows are increasingly becoming one of the most important variables in XRP’s market structure. Whenever inflows rise, ETFs must acquire XRP from the market, and this effectively makes them a consistent source of demand.
Related Reading
Furthermore, XRP tokens that go into ETFs are typically held for longer durations compared to retail trading activity. This, in turn, creates a supply sink that can influence price dynamics, especially if inflows continue.
For context, exchange-held XRP dropped 45% from 3.95 billion to 2.6 billion over the course of 2025, the lowest level since 2018, leaving an already thin order book sensitive to an increase in demand.
A Coinbase and EY-Parthenon survey of 351 institutional investors found that 25% plan to add XRP to their portfolios in 2026 and 18% already hold it, but 65% of those respondents identified regulatory clarity as the single biggest factor holding them back from increasing their crypto exposure.
The passage of the CLARITY Act is currently the most important regulatory factor. Spot XRP ETFs could grow to about $5 billion in AUM if the legislation clears the Senate Banking Committee, which is targeting a markup vote in the second half of April. A hypothetical growth of these ETFs to $5 billion in AUM would lock about 2.5 billion tokens, more XRP than every crypto exchange combined holds at present.
Featured image from Adobe Stock, chart from Tradingview.com
Bitcoin price started a recovery wave above $67,500. BTC is now consolidating below $68,800 and might struggle to continue higher.
- Bitcoin started a recovery wave above $67,000 and $67,200.
- The price is trading above $67,000 and the 100 hourly simple moving average.
- There is a rising channel forming with resistance at $68,800 on the hourly chart of the BTC/USD pair (data feed from Kraken).
- The pair might start another decline if it stays below the $68,500 and $68,800 levels.
Bitcoin Price Eyes Recovery
Bitcoin price formed a base above $65,500 and started a recovery wave. BTC was able to settle above $66,000 to move into a short-term positive zone.
The price climbed above the $67,200 resistance zone. The bulls even cleared the 38.2% Fib retracement level of the downward move from the $71,986 swing high to the $65,030 low. However, the bears are now active near the $68,500 resistance zone.
Bitcoin is now trading above $67,000 and the 100 hourly simple moving average. If the price remains stable above $67,000, it could attempt a fresh increase. Immediate resistance is near the $68,500 level or the 50% Fib retracement level of the downward move from the $71,986 swing high to the $65,030 low.
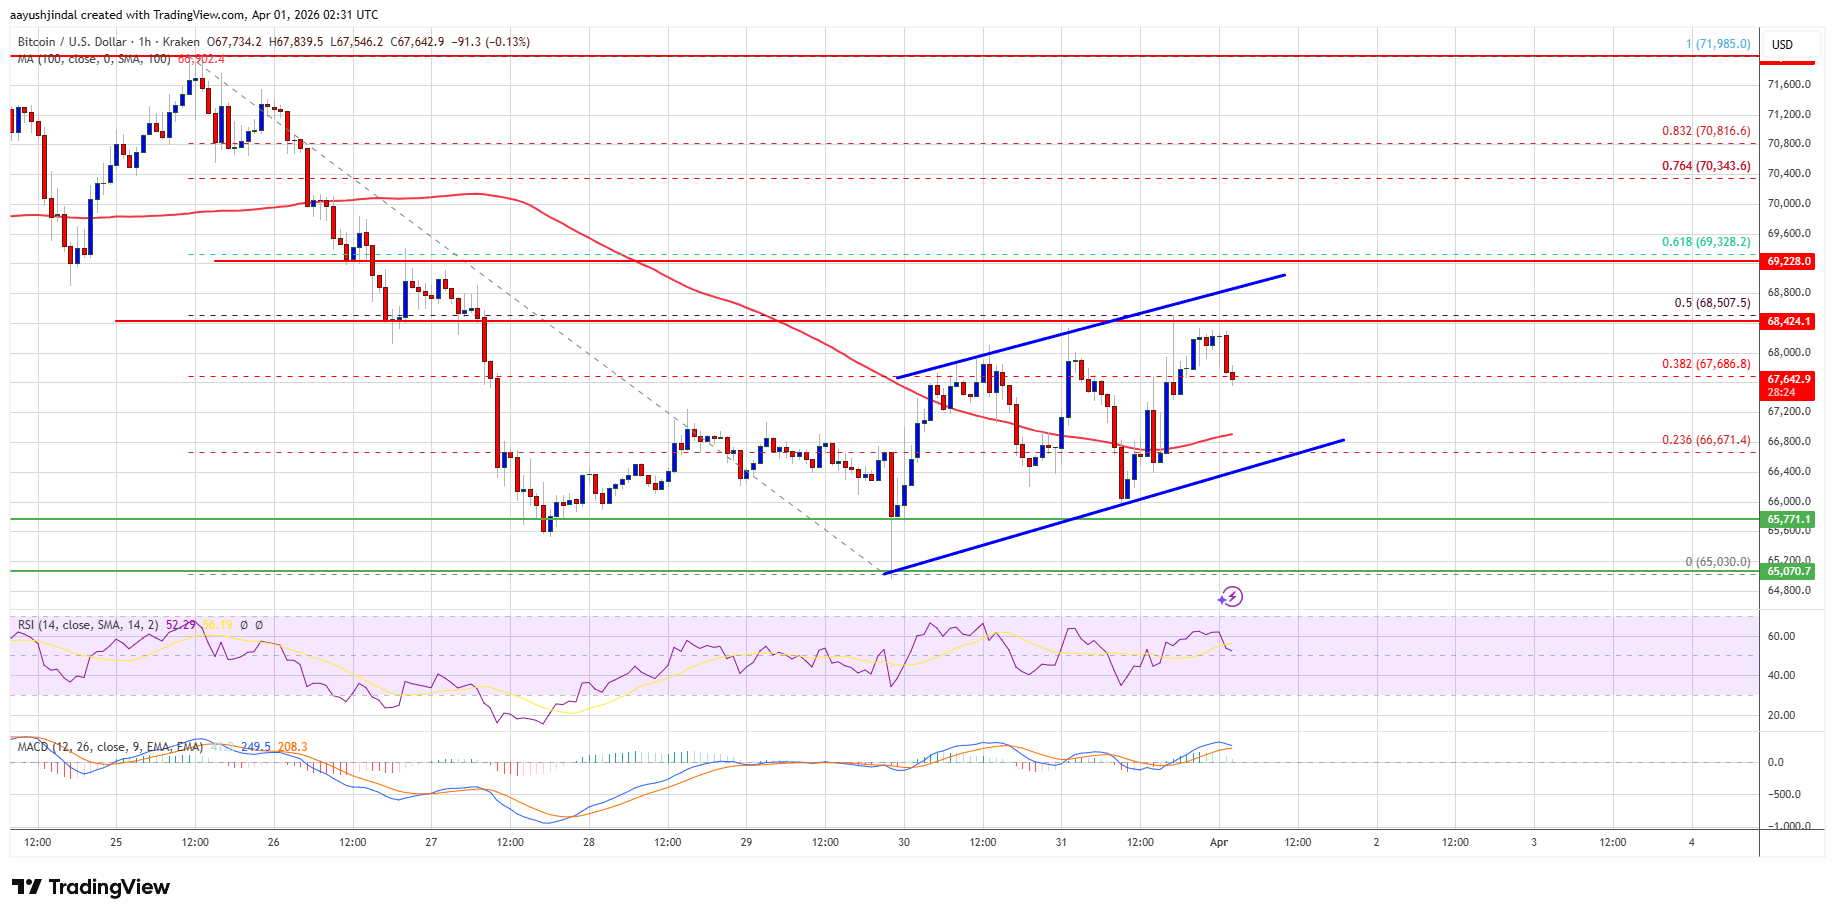
The first key resistance is near the $68,800 level. There is also a rising channel forming with resistance at $68,800 on the hourly chart of the BTC/USD pair. A close above the $68,800 resistance might send the price further higher. In the stated case, the price could rise and test the $69,250 resistance. Any more gains might send the price toward the $69,500 level. The next barrier for the bulls could be $70,000.
Another Drop In BTC?
If Bitcoin fails to rise above the $68,800 resistance zone, it could start another decline. Immediate support is near the $67,000 level. The first major support is near the $66,800 level.
The next support is now near the $65,800 zone. Any more losses might send the price toward the $65,800 support in the near term. The main support now sits at $65,000, below which BTC might struggle to recover in the near term.
Technical indicators:
Hourly MACD – The MACD is now losing pace in the bullish zone.
Hourly RSI (Relative Strength Index) – The RSI for BTC/USD is now above the 50 level.
Major Support Levels – $67,000, followed by $65,800.
Major Resistance Levels – $68,500 and $68,800.
Cardano (ADA) Price: Bears Stay in Control as Whales Begin to Accumulate CoinCentral
Source link ]]>
Shiba Inu (SHIB) On-Chain Data Reveals Top 10 Wallets Control 63 Percent of Supply as Whales Surge openPR.com
Source link ]]>
Cardano (ADA) Price: Bears Are in Control — Can a Rare Buy Signal and Regulatory News Turn the Tide? CoinCentral
Source link ]]>
Cardano Forecast for Mar 17: ADA Stuck Below Key Resistance at $0.305 With Bears in Control Cryptonews.net
Source link ]]>
Ethereum price started a major increase above the $2,150 zone. ETH is now showing positive signs and might aim for more gains above $2,250.
- Ethereum started a steady upward move above the $2,150 zone.
- The price is trading above $2,150 and the 100-hourly Simple Moving Average.
- There is a key bullish trend line forming with support at $2,100 on the hourly chart of ETH/USD (data feed via Kraken).
- The pair could start a fresh decline if it stays below the $2,250 zone.
Ethereum Price Rallies Over 8%
Ethereum price extended its recovery wave after it cleared the $2,050 zone, like Bitcoin. ETH price was able to clear the $2,120 resistance zone.
The bulls pushed the price above the 76.4% Fib retracement level of the downward move from the $2,209 swing high to the $2,062 low. Besides, there is a key bullish trend line forming with support at $2,100 on the hourly chart of ETH/USD.
Finally, the price cleared the $2,200 resistance zone. It tested the 1.236 Fib extension level of the downward move from the $2,209 swing high to the $2,062 low at $2,245.
Ethereum price is now trading above $2,180 and the 100-hourly Simple Moving Average. If the bulls remain in action above $2,150, the price could attempt another increase. Immediate resistance is seen near the $2,245 level. The first key resistance is near the $2,250 level.
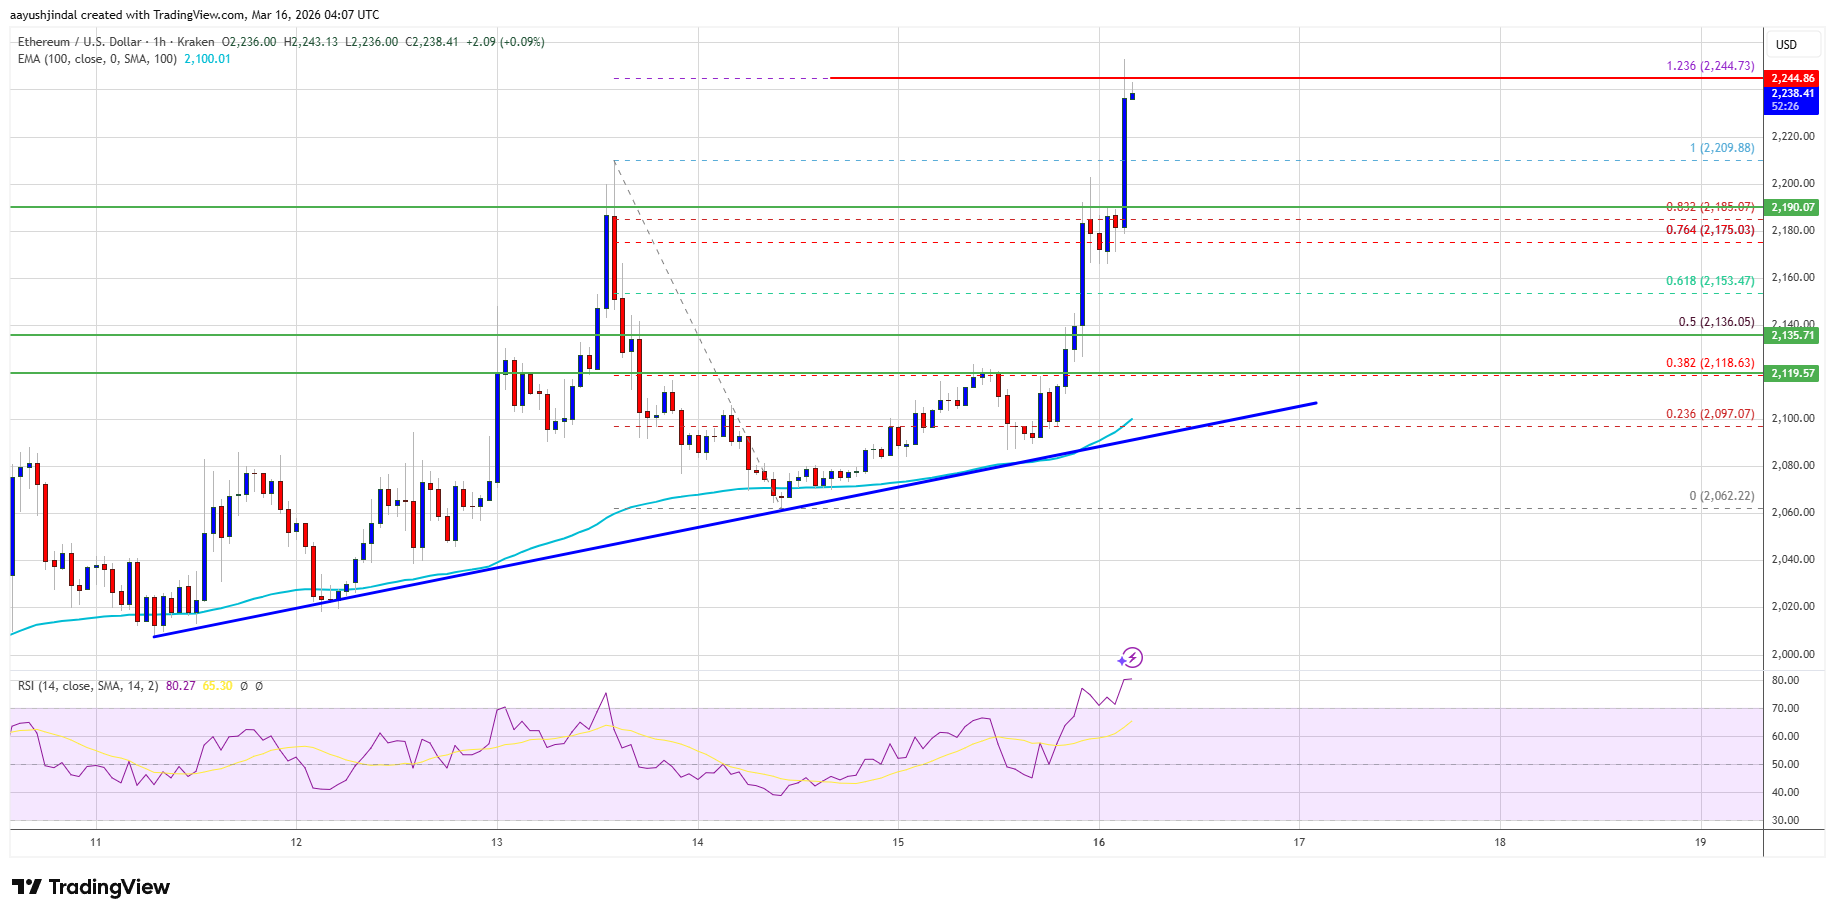
The next major resistance is near the $2,280 level. A clear move above the $2,280 resistance might send the price toward the $2,320 resistance. An upside break above the $2,320 region might call for more gains in the coming days. In the stated case, Ether could rise toward the $2,365 resistance zone or even $2,380 in the near term.
Downside Correction In ETH?
If Ethereum fails to clear the $2,250 resistance, it could start a fresh decline. Initial support on the downside is near the $2,200 level. The first major support sits near the $2,180 zone.
A clear move below the $2,180 support might push the price toward the $2,150 support. Any more losses might send the price toward the $2,100 region. The main support could be $2,050.
Technical Indicators
Hourly MACD – The MACD for ETH/USD is gaining momentum in the bullish zone.
Hourly RSI – The RSI for ETH/USD is now above the 50 zone.
Major Support Level – $2,150
Major Resistance Level – $2,250