Cardano price trades at crossroads as rejection meets fading momentum Cryptonews.net
Source link ]]>
Cardano’s Governance Crossroads: Community Vote to Shape Funding Future ad-hoc-news.de
Source link ]]>
Cardano’s Governance Crossroads: Community Vote to Shape Funding Future AD HOC NEWS
Source link ]]>
A worst-case scenario is now on the table. Some analysts say Bitcoin could fall as low as $41,000 if a bear flag pattern currently forming on price charts plays out — a warning sign drawing attention as the cryptocurrency trades near $66,000, roughly half of what it was worth at its recent high.
Related Reading
Geopolitical Shock Hits At A Bad Time
The closure of the Strait of Hormuz sent oil prices surging this week, rattling global markets and pulling risk assets lower. Bitcoin was caught in the selloff.
Prices slipped below $66,000 as traders weighed rising energy costs, stubborn US inflation, and fresh stress in the bond market. The timing of the geopolitical flare-up has made an already fragile price setup harder to defend.
A bear flag pattern — a technical chart signal where prices briefly consolidate after a decline before continuing lower — is now visible on Bitcoin’s chart.
Based on reports from market analysts, the pattern puts an initial downside target near $50,000, with the $41,000 level emerging as a deeper floor if selling pressure intensifies.
Bitcoin is down 47% from its peak. That kind of drawdown might sound alarming, but analysts who track long-term crypto cycles say it fits a pattern that has shown up before.
A Cycle That Has Played Out Before
Data shows that Bitcoin tends to lose momentum in midterm years. Reports going back to 2014, 2018, and 2022 show a recurring sequence: prices start the year relatively stable, fade through late Q1 into early Q2, and then grind lower through the summer months. The 2026 price action has tracked this historical average closely.
On average, around now is when #Bitcoin continues its decline in midterm years. pic.twitter.com/JZ7Rcx2wJY
— Benjamin Cowen (@intocryptoverse) March 27, 2026
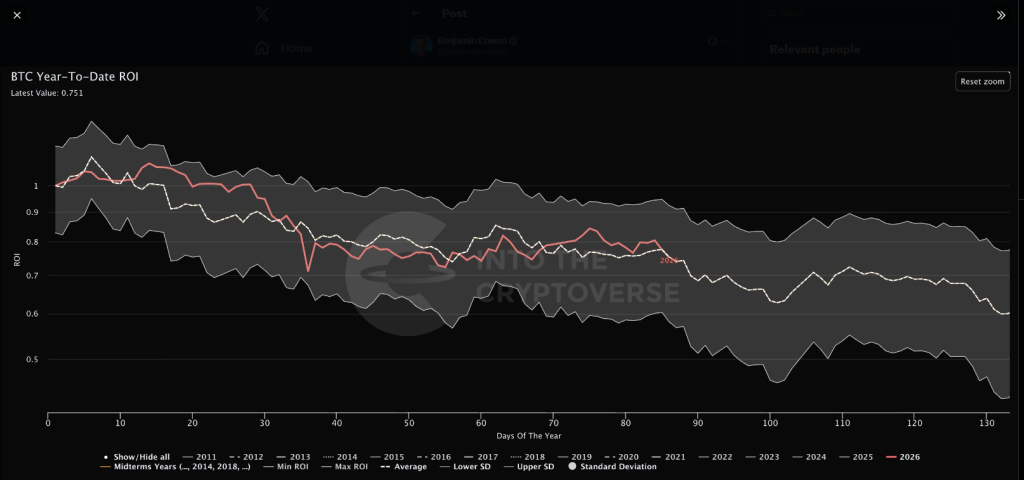
Analyst Benjamin Cowen, who has followed Bitcoin’s multi-year cycles, points to what he calls the mid-cycle dip zone — a phase that typically follows a major bull run and stretches across several quarters.
According to Cowen, midterm years are not crash events. They are cooldown periods. Rallies lose steam. Volatility picks up. Corrections run longer than most investors expect.
That description fits what is happening now. Following a strong run in 2025, Bitcoin’s year-to-date performance has tilted negative, matching the kind of softening seen in prior cycles.
Related Reading
Patience May Be The Only Strategy Left
For long-term Bitcoin holders, the message from analysts is straightforward: this has happened before, and it has always eventually ended.
But the short-term picture offers little comfort. Macro pressures are stacking up at the same moment that Bitcoin’s chart structure is weakening, and there is no clear catalyst in sight to reverse the trend.
Featured image from Unsplash, chart from TradingView
Shiba Inu Approaches a Technical Crossroads as 50 EMA Looms Large Cryptonews.net
Source link ]]>
Dogecoin’s Crossroads: Speculative Hype Meets Structural Reality AD HOC NEWS
Source link ]]>
Dogecoin at Critical Crossroads: Analysts Weigh Parabolic Rally Against Sharp Decline Coinpaper
Source link ]]>
Bitcoin is sitting at a decisive inflection point. After losing key support and pressing into range extremes, the market now faces a clear binary outcome: reclaim the range highs and shift momentum back to the upside, or fail and extend toward new weekly lows. The next move from here will likely set the tone for Bitcoin’s short-term direction.
Bitcoin Tests Range Extremes
Currently, Bitcoin is navigating a period of high tension as it tests its range extremes, a phase that analyst Lennaert Snyder notes can feel intimidating for many traders. However, these moments of extreme volatility often serve as the foundation for the highest-quality setups.
Related Reading
The current strategy remains patient, focusing on a Market Structure Break (MSB) as the primary prerequisite for entering a long position. On the H4 timeframe, the specific level to watch is the $66,590 high. Gaining and holding this level would signal a shift in momentum, providing the initial green light for bulls to step in.
While the $66,590 mark is the first hurdle, the true pivot for a structural bullish flip sits at approximately $68,000. This level is of paramount importance because it hosts the Point of Control (POC) for the entire range. Reclaiming this zone would shift the narrative from a defensive to an offensive posture, confirming that buyers have regained control of the value area.

If Bitcoin successfully regains the $68,000 level, it opens a clear path to the $71,422 resistance. Beyond that, the ultimate objective for this move would be the massive liquidity cluster sitting at $76,971. Thus, the $68,000 zone is also a critical area for bears as it could become a prime short entry following a confirmed rejection.
Conversely, the market must account for the possibility of a bull trap at the lower resistance levels. If Bitcoin sweeps the $66,590 high only to be met with a sharp rejection, it would suggest that the rally was merely a liquidity grab. Such a failure would likely trigger an aggressive short-selling wave, potentially driving the price down to establish new weekly lows.
$65,000 Support Lost — Momentum Shifts Lower
In a recent update, Ted noted that Bitcoin has now broken below the key $65,000 support zone, shifting short-term momentum back in favor of the bears. Losing this level weakens the immediate structure and opens the door for further downside exploration.
Related Reading
That said, significant bid liquidity is stacked between $60,000 and $63,000, creating a potential demand pocket. However, whether that zone holds may largely depend on broader market conditions, particularly how the stock market behaves in the coming sessions. Given the current setup, a sweep of the $60K lows appears increasingly likely before any meaningful reversal attempt.
Featured image from Pixabay, chart from Tradingview.com
Cardano at a Crossroads: Institutional Doors Open Amid Market Uncertainty AD HOC NEWS
Source link ]]>
Cardano’s Crossroads: Navigating Price Weakness Amidst Structural Strengths AD HOC NEWS
Source link ]]>