The Bitcoin and Ethereum prices plunged sharply over the weekend as missiles flew across the Middle East, exposing just how quickly geopolitical crises can send shockwaves through the financial markets. A joint US and Israel strike on Iran triggered a violent selloff that wiped out billions of dollars from the crypto market in a matter of hours. Fresh reports now indicate that Bitcoin and Ethereum are beginning to recover. Still, with geopolitical tensions continuing to escalate, it remains uncertain whether this renewed momentum can be sustained.
Bitcoin Price Recovers After US-Israel War Fueled Crash
Geopolitical shockwaves rattled global financial markets this past weekend as a joint US and Israeli military operation against Iran sent Bitcoin into a sharp but brief decline, wiping out millions of dollars in long positions before a partial recovery took hold. Notably, BTC plummeted to nearly $63,000 overnight following the coordinated strikes on Iranian military targets.
Related Reading
Within 45 minutes of Israel launching its assault, Bitcoin shed $2,500 in value, while more than $200 million worth of long positions were liquidated in just one hour. The broader crypto market saw roughly $72 billion wiped out amid the chaos. The sell-off was swift and severe, with major exchange players including Binance, Coinbase, and trading firm Winternute offloading more than $3.5 billion in Bitcoin within a 20-minute window. This further added downward pressure to the already declining and volatile market.
Despite the carnage, Bitcoin has since climbed back above $66,000, according to CoinMarketCap data, though volatility remains elevated as the Middle East conflict shows no signs of immediate resolution.
Market analysts were quick to explain the technical reasons behind BTC’s price decline. One expert noted that Bitcoin did not crash for no reason. She explained that because it was the most accessible and highest volume asset that trades around the clock, it was significantly exposed to weekend fear and panic selling compared to other major asset classes.
Ethereum Price Rebounds After Massive Sell-Off
Ethereum also took a hit alongside Bitcoin following news of the US-Israel war. ETH dropped roughly 10% within just one hour of the news breaking, falling below $1,900 and erasing all the gains it had made when it briefly touched $2,000 last week. At its lowest point, Ethereum fell to around $1,850 before rebounding back above $1,950.
Related Reading
Notably, the crash triggered sharp declines in Ethereum derivatives markets, with millions of dollars in liquidations. A large percentage of those liquidations came from long positions, suggesting that traders who had bet on Ethereum rising were hit the hardest.
In the broader context, the Ethereum price was already experiencing a downturn, meaning the geopolitical shock had compounded an already painful downtrend for ETH holders. In addition to Ethereum, other altcoins, such as XRP, saw major sell-offs as geopolitical tensions rose.
Featured image from Pixabay, chart from Tradingview.com
Bitcoin’s price action this month has left traders watching closely as big players double down on bullish calls. According to VanEck’s research, the investment firm has reaffirmed a $180,000 year-end target even after Bitcoin slid from a recent high, a sign that some institutional buyers are not backing away despite a pullback.
Related Reading
Institutional Buying Remains Heavy
Reports have disclosed heavy accumulation in July. Exchange-traded products bought 54,000 BTC while Digital Asset Treasuries added 72,000 BTC, giving clear evidence that large holders continue to pile in.
VanEck first laid out its bullish view in November 2024 when Bitcoin traded around $88,000. At the same time, US-listed miners now account for 31% of global Bitcoin hashrate, up from roughly 30% earlier this year, even as equity index fell 4% when excluding Applied Digital’s 50% jump.
Price Moves Show Volatility And Quick Recovery
Bitcoin slid to $112,000 in early August before jumping back to $124,000 on August 13. That move set a new all-time high above July’s $123,838.
At the time of writing, Bitcoin trades close to $115K, roughly 8% below that recent peak. Traders describe the pullback as a repositioning after a run-up, not an obvious breakdown.
Source: VanEck
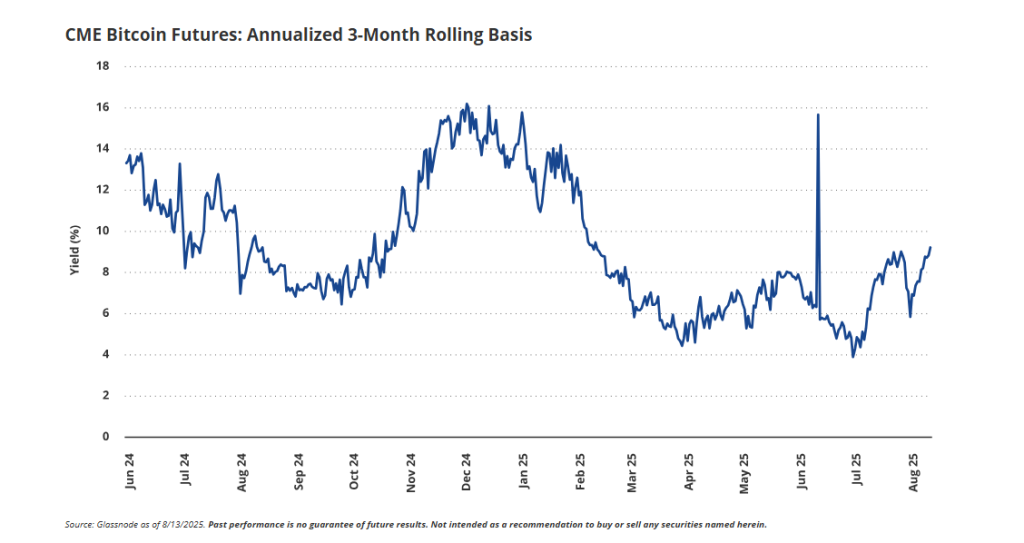
Derivatives metrics back the picture of rising speculative interest. CME basis funding rates have surged to 10%, the highest level since February 2025.
Options markets show call/put ratios hitting 3.21x, the strongest since June 2024, with investors spending $792 million on call premiums.
Yet implied volatility has compressed to 32%, well under the one-year average of 50%, which makes options cheaper for buyers.
On the other hand, futures open interest sits over $6 billion, though a $2.3 billion unwind in open interest during recent corrections ranks among the larger single-session moves.
Source: VanEck
Voices Split On How High Bitcoin Could Go
Executives and analysts disagree on the pace and peak of the rally. Coinbase CEO Brian Armstrong joined figures such as Jack Dorsey and Cathie Wood in suggesting Bitcoin could reach $1 million by 2030, citing clearer rules and wider institutional adoption.
Galaxy Digital’s Mike Novogratz warned that a million-dollar level would more likely reflect severe US economic stress than normal market strength.
Preston Pysh flagged concerns about how Wall Street’s growing role might change Bitcoin’s use and culture.
Related Reading
Support Levels And Technical
Technically, many market watchers view the $100,000-$110,000 range as key support. A decisive break below $112,000 could push prices toward $110,000 and, in a deeper move, $105,000.
For now, the story is mixed. Institutional demand and speculative derivatives flows are pushing price pressure higher, while cheap options and compressed volatility make bullish bets less costly.
Whether that combination lifts Bitcoin to VanEck’s $180,000 target will depend on continued inflows and whether key support holds.
Featured image from Meta, chart from TradingView
Bitcoin (BTC) miners are facing intense heat with the growing cost of production with many now selling their BTC holdings.
Bitcoin Miner Revenue Slump: the Post-Halving Drawdown
Blockchain analytics platform CryptoQuant recently identified a significant uptick in mining pool transfers. This is in addition to a surge in Over-the-counter (OTC) desk sales.
#Bitcoin miners are under pressure and they’ve begun selling.
Let’s explore the recent uptick in mining pool transfers, the surge in OTC desk sales, and why even major publicly traded mining companies are reducing their holdings.
— CryptoQuant.com (@cryptoquant_com) June 13, 2024


Top crypto analyst, Ali Martinez on X linked this current market outlook to the Bitcoin halving event that went live in April. Precisely, Ali stated that the mining cost for the lead cryptocurrency grew significantly right after the halving. Currently, it cost an average of $77,000 to mine a single $BTC today.
“This spike in expenses has led to a wave of capitulation among #BTC miners in the past month,” Ali Charts mentioned.
These Bitcoin miners have ramped up selling as the price of Bitcoin fluctuates between $69,000 to $71,000. At the time of this writing, BTC was trading at $66,618.03 with a drop of 4.39% in the last 24 hours. A few days ago, transfers from mining pools to Binance surged to the point that it hit a 2-month peak of over 3,000 BTC. This shift is in alignment with a price correction that dropped Bitcoin to $66,000.
The situation is the same on OTC desks as the platform also saw a surge in sales. On Monday, miners sold 1,200 Bitcoin through OTC desks, marking the highest daily volume in over two months. Several United States Bitcoin companies have been busy offloading their Bitcoin holdings.
With June just two weeks gone, Marathon Digital Holdings Inc has offloaded 1,400 Bitcoins compared to May when it sold only 390 units. The sales represents 8% of its Bitcoin holdings.
Low Mining Revenue Triggers Selling Pressure
Miners are selling because of the negative turn that mining revenue took post-halving. In March, just around the time that Bitcoin hit its current all-time-high (ATH), miners revenue sat at $78 million. Today, this value has dropped by approximately 55% and is now at $35,000. This plunge in miners’ revenue is fueling the selling activity.
It is worth noting that Bitcoin transactions fees have also dropped reasonably to around 65 Bitcoin from 117 prior to April 18.
There are several expectations that Bitcoin could reach $100,000 by the end of June, however the selling pressure may impact negatively on the price in the short-term. With time, it is expected that the market would balance out with more liquidity.
At this point, BTC could head for its bull run if the demand from spot Bitcoin ETF issuers remains intact.
Read More: FINMA Orders Closure of Crypto Bank FlowBank, Begins Liquidation
The presented content may include the personal opinion of the author and is subject to market condition. Do your market research before investing in cryptocurrencies. The author or the publication does not hold any responsibility for your personal financial loss.
Ethereum (ETH) stands at a crucial juncture, with its eyes set on the $4,000 price mark. Amid this ambitious pursuit, the digital asset faces a significant challenge that could influence its trajectory: scrutiny from the US Securities and Exchange Commission (SEC).
Despite this potential regulatory hurdle, some analysts remain optimistic about Ethereum’s prospects. A detailed analysis by Captain Faibik, a market watcher, highlighted a bullish pattern in ETH’s four-hour candlestick chart, suggesting that the $4,000 threshold is within reach.
Ethereum Eyes $4,000 Milestone
This optimism stems from a descending wedge pattern observed by Faibik, indicating an end to Ethereum’s consolidation phase and signaling a possible price breakout. The technical analysis paints a promising picture for Ethereum, suggesting that the asset could reclaim its lost valuation.
$ETH #Ethereum Descending Broadening Wedge Upside Breakout is Confirmed on the 4hrs timeframe Chart..
$4,000 incoming
https://t.co/qrKE5jiXon pic.twitter.com/MLIXefVsd8
— Captain Faibik (@CryptoFaibik) March 25, 2024


However, the recent market conditions have posed challenges for Ethereum, with the asset experiencing a more than 15% drop over two weeks, further exacerbated by the broader Bitcoin market correction.
This decline saw ETH trading below the $3,500 mark, with a significant dip to $3,070 on March 20, amid reports of the SEC’s increasing interest in classifying Ethereum as a security.
Particularly, reports indicate that the commission has been seeking financial records from US companies engaged with the Ethereum Foundation, intensifying the debate over Ethereum’s classification. Such regulatory scrutiny casts a shadow over Ethereum’s path to $4,000, introducing uncertainty into its future.
ETF analyst James Seyffart suggests that the SEC’s stance could lead to the denial of spot Ethereum ETF applications by May 23, 2024. He cites a lack of engagement on Ethereum specifics, contrasting with the approach taken for Bitcoin ETFs.
My cautiously optimistic attitude for ETH ETFs has changed from recent months. We now believe these will ultimately be denied May 23rd for this round. The SEC hasn’t engaged with issuers on Ethereum specifics. Exact opposite of #Bitcoin ETFs this fall. https://t.co/TyAzAOrAC5
— James Seyffart (@JSeyff) March 19, 2024
Ethereum’s Network Activity: A Silver Lining
Despite these challenges, Ethereum’s network has witnessed notable growth, with increases in daily active users and transaction volumes signaling a bullish outlook for the cryptocurrency. An upsurge in network activity typically indicates heightened demand, a positive sign for Ethereum’s price potential.
From January 3, the number of daily active Ethereum addresses surged by over 46%, coinciding with a significant price rally. This increased activity and price appreciation period highlights Ethereum’s resilience and potential for growth, even in the face of regulatory uncertainties.
As Ethereum navigates through these regulatory and market challenges, the coming weeks will be critical in determining its ability to breach the $4,000 mark. The juxtaposition of technical bullish signals against the backdrop of SEC scrutiny presents a complex scenario for ETH.
However, the strength of its network and the increasing user engagement offer a glimmer of hope for Ethereum enthusiasts and investors.
Featured image from Unsplash, Chart from TradingView
Disclaimer: The article is provided for educational purposes only. It does not represent the opinions of NewsBTC on whether to buy, sell or hold any investments and naturally investing carries risks. You are advised to conduct your own research before making any investment decisions. Use information provided on this website entirely at your own risk.
Ripple is attempting an upside break above the $0.365 resistance zone against the US Dollar. XRP price could fail to gain pace if it stays below the $0.3720 resistance.
- Ripple is currently recovering above the $0.355 resistance zone against the US dollar.
- The price is now trading near $0.360 and the 100 simple moving average (4-hours).
- There was a break above a major bearish trend line with resistance near $0.3480 on the 4-hours chart of the XRP/USD pair (data source from Kraken).
- The pair could start a fresh decline if it breaks the $0.3550 support and pivot zone.
Ripple Price Attempts Recovery
After a major decline, ripple’s XRP found support near the $0.3320 zone against the US Dollar. The price formed a base above the $0.3320 level before it started a recovery wave.
There was a decent increase above the $0.3450 and $0.3500 resistance levels. Besides, there was a break above a major bearish trend line with resistance near $0.3480 on the 4-hours chart of the XRP/USD pair. In the past few sessions, xrp price gained pace above the $0.3550 resistance zone, outperforming bitcoin and ethereum.
The price even spiked above the 50% Fib retracement level of the key decline from the $0.3965 swing high to $0.3320 low. The price is now trading near $0.360 and the 100 simple moving average (4-hours).
An immediate resistance is near the $0.370 zone. The next key resistance is near the $0.372 level. It is near the 61.8% Fib retracement level of the key decline from the $0.3965 swing high to $0.3320 low.

Source: XRPUSD on TradingView.com
A successful break above the $0.372 resistance might send the price towards the $0.400 resistance. Any more gains might send the price towards the $0.425 level in the coming days.
Fresh Decline in XRP?
If ripple fails to clear the $0.372 resistance zone, it could start a fresh decline. An initial support on the downside is near the $0.358 level.
The next major support is near $0.355. If there is a downside break and close below the $0.355 level, xrp price could extend losses. In the stated case, the price could even decline below the $0.332 support.
Technical Indicators
4-Hours MACD – The MACD for XRP/USD is now losing pace in the bullish zone.
4-Hours RSI (Relative Strength Index) – The RSI for XRP/USD is now above the 50 level.
Major Support Levels – $0.355, $0.332 and $0.320.
Major Resistance Levels – $0.370, $0.373 and $0.400.
✓ Share: