Shiba Inu Made a Truck Driver a Millionaire From $650 and Pepeto Is Sitting at That Same Stage Right Now FinanceFeeds
Source link ]]>

Ethereum’s price is displaying signs of bullish momentum once again as the leading altcoin reclaims the $3,000 mark following a rebound across the broader cryptocurrency market. While the price has picked up pace, the ETH derivatives market is heating up, with futures demand rising sharply compared to the spot market.
Futures Appetite Surges Ahead Of Spot Buying
With the price of Ethereum displaying renewed upward strength, the altcoin appears to be changing its tempo, and this change is not coming from where most traders typically look. A recent report from CryptoQuant, a leading on-chain data analytics platform, has revealed a notable divergence between the futures and spot markets.
In the quick-take post, market expert and author with the pseudonym Crazzyblockk highlighted that the futures markets have accelerated significantly while spot activity continues to lag behind. Simply put, demand for futures is surging ahead of spot buying, indicating a shift among ETH investors or traders.
When this key trend emerges, it often serves as an early tremor that frequently precedes more significant developments in Ethereum’s narrative. It suggests that individuals betting on tomorrow may write the next chapter of ETH price action instead of accumulating today.

Over the last several days, ETH’s futures-to-spot ratio has steadily moved higher from the mid-5 range to nearly 6.9 on the most recent reading. Crazzyblockk stated that the rising multiple shows there is a fast increase in speculative interest around Ethereum than spot market participation. What this means is that traders positioning through leveraged markets are expanding rather than acquiring through spot.
In comparison to other major digital assets in the dataset, ETH currently holds the most robust futures demand relative to its spot volume. While Bitcoin and Solana maintain stable ratios in the 3.5–4.5 zone, the altcoin remains the leader and is widening the gap.
ETH Traders Are Choosing Directional Exposure
The divergence points to an environment where traders are opting for directional exposure in ETH more aggressively than in other large assets. Meanwhile, the increase in futures participation could be a sign of impending catalysts or growing expectations for volatility unique to the Ethereum ecosystem.
According to the market expert, the consistency of this upward trajectory is important to the market. When market players expect greater short-term price movement, a rising futures multiple usually arises. Currently, the data indicates that Ethereum traders are sharply positioning ahead of potential trend acceleration.
However, whether this development leads to a persistent upward momentum or short-term volatility, the path remains clear. The behavior reflects heightened conviction and a noticeable change in Ethereum’s trading dynamics toward those driven by derivatives.
At the time of writing, the ETH price was trading at $3,007, demonstrating a 0.73% decline in the last 24 hours. Its trading volume has sharply dropped in the past day by more than 33%, indicating waning sentiment among ETH investors.
Featured image from Peakpx, chart from Tradingview.com
Editorial Process for bitcoinist is centered on delivering thoroughly researched, accurate, and unbiased content. We uphold strict sourcing standards, and each page undergoes diligent review by our team of top technology experts and seasoned editors. This process ensures the integrity, relevance, and value of our content for our readers.
Dogecoin Car To Race In Indianapolis 500: How To Watch, Bet On Driver Devlin DeFrancesco Benzinga
Source link ]]>
Crypto financial services platform Matrixport has predicted that an approval of a spot Bitcoin ETF by the US Securities and Exchange Commission (SEC) could push the price of Bitcoin between $42,000 and $56,000 per unit.
BTC, the world’s largest cryptocurrency, has experienced notable increases in value throughout the current week, with the aim of surpassing the significant threshold of $30,000. The cryptocurrency has been influenced by the operations of a spot Bitcoin Exchange Traded Fund (ETF) as investors continue to await approval to onboard institutional and mainstream exposure to the digital asset.
Bitcoin Is Headed For $56,000
Matrixport conducted an analysis in its newly released report, examining the potential effects of a spot Bitcoin exchange-traded fund (ETF) on the cryptocurrency market, with a specific focus on BTC. Applications for these investment vehicles have gained momentum in recent months, with many now expecting a green light from the SEC.
The report draws a parallel close to the $120 billion precious metals ETF industry. If just 10–20% of investors in precious metal ETFs diversified their holdings into Bitcoin ETFs, it would result in an influx of $12b billion to $24 billion into these investment vehicles.
According to Matrixport, an approval, particularly a BlackRock Bitcoin ETF application, would see leading stablecoin USDT increase by as much as $50 billion in market cap. This, in turn, would lead to Bitcoin’s price rising to $56,000, with Tether acting as an intermediary facilitating the inflow of investments to BTC.
“Our earlier reports analysed the 15,000-strong US registered investor advisor (RIA) community overseeing around $5 trillion. This group holds immense potential, and even a modest 1% allocation recommendation for Bitcoin would usher in around $50 billion in inflows,” the report said.
A lesser influx of $24 billion into Tether would see BTC rise to $42,000 in the short term. With BTC currently trading at $29,370 with a market cap of $625.03 billion, this represents an increase of 90% and 43% in both scenarios.
BTC readies to break $30,000 | Source: BTCUSD on Tradingview.com
What’s Next For BTC? Is A Rally Inevitable?
The price of Bitcoin has always reacted to news regarding spot Bitcoin ETFs. Just news of applications from BlackRock, Fidelity, and other investment companies sent BTC surging. Recently, rumors that the SEC had approved BlackRock’s ETF application sent the industry into a frenzy, and $74 million worth of BTC positions were liquidated in just a few minutes.
There’s no denying the amount of capital a spot Bitcoin ETF would unlock for the crypto industry. If approved, a spot Bitcoin ETF could unlock a massive inflow of capital from institutional investors, up to $17.7 trillion from financial institutions.
According to Fundstrat co-founder Tom Lee, spot ETFs could push BTC to $150,000 or maybe even further by the end of next year.
Featured image from Forkast News, chart from Tradingview.com
Dogecoin (DOGE) Joins Altcoin Push, Here’s Its Growth Driver U.Today
Source link ]]>
SHIB Burns Jump 2,057% as Shiba Inu Price Surges Impacted by This Crucial Driver U.Today
Source link ]]>
Truck Driver That Made $3 Million from Dogecoin (DOGE) is Now Selling His Bags to Invest in This New Memecoin Analytics Insight
Source link ]]>
Truck Driver Turned Shiba Inu (SHIB) Millionaire is Now Invested in … Crypto News Flash
Source link ]]>
Bank Of America Reveals Surprise Crypto ‘Key Driver’ Amid $300 Billion Bitcoin, Ethereum, BNB, XRP, Cardano, Dogecoin, Polygon And Solana Price Boom Forbes
Source link ]]>
A quant has suggested that Bitcoin will again become the driving force in the crypto market once the Ethereum merge hype dies down.
Bitcoin Share Of Crypto Trading Volume Already Seems To Be Overtaking Ethereum’s
As explained by an analyst in a CryptoQuant post, there are some signs that point to BTC surpassing ETH once more to be the dominant power in the market.
The relevant indicator here is the “dominance by volume,” which measures what part of the total crypto trading volume is contributed by each coin in the sector.
The “trading volume” is a metric that measures the total amount of crypto being involved in transactions in spot markets.
Now, here is a chart that shows the trend in the dominance by volume for both Bitcoin and Ethereum:
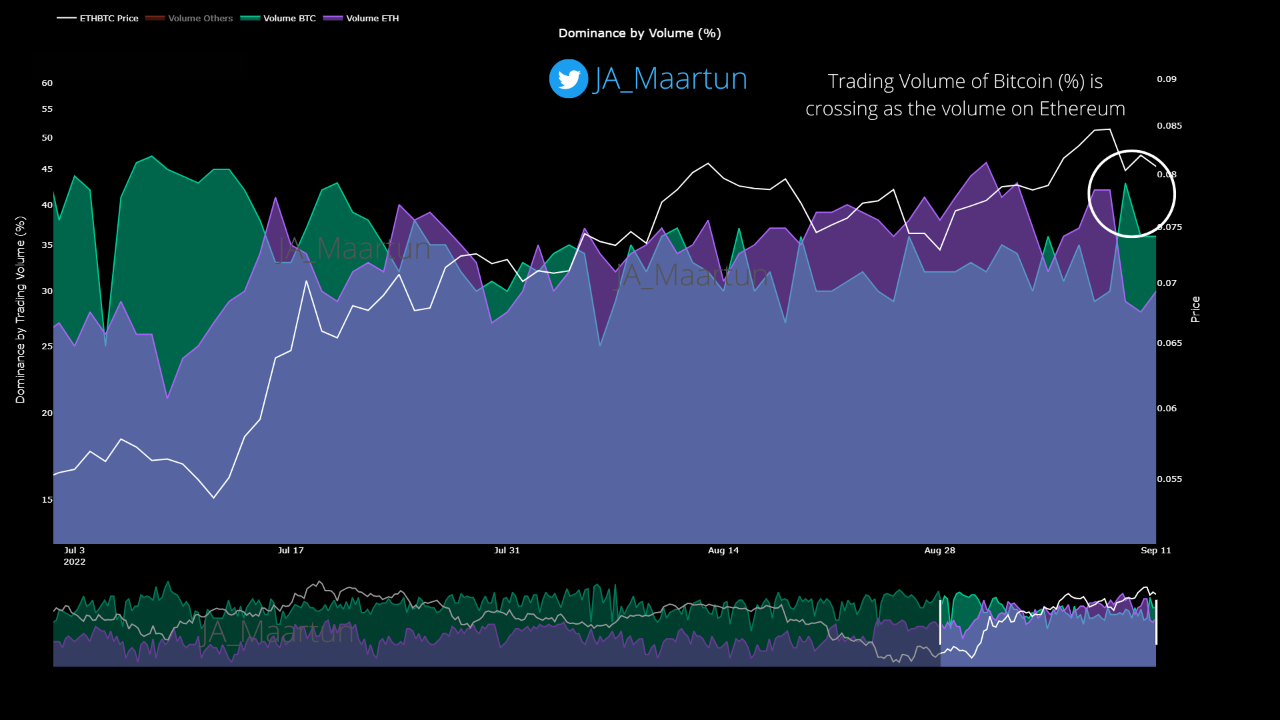
The value of the metric for BTC seems to have crossed over that of ETH in recent days | Source: CryptoQuant
As you can see in the above graph, the Bitcoin percentage share of the trading volume was significantly higher than Ethereum’s during the start of July.
However, as the middle of that month approached, ETH slowly started surging up and passing above the BTC volumes.
Related Reading: Bitcoin Taker Buy Sell Ratio Hits Highest Value in 636 days
In August, the ETH dominance by volume remained higher than BTC’s for the entire month, save for a couple brief spikes for the latter.
This continued into September, until just a few days ago. The reason behind Ethereum leading the bear market for almost two months was the hype created by the upcoming PoS merge.
The quant believes that once the merge is finished in approximately two days, this narrative that kept the crypto’s volumes up will be gone.
Related Reading: Chiliz and Big Eyes Coin: Two Ethereum-based Cryptos that Might Overthrow the Binance Crypto Project
Around three days ago, BTC’s share of the trading volume crossed over that of Ethereum’s and has since stayed up. The analyst points out that this is one of the early signs for a shift in the investor behavior around the merge launch.
BTC overtaking the volumes on exchanges now means soon after the merge, Bitcoin will be back to being the main driving force in the crypto market.
BTC Price
At the time of writing, Bitcoin’s price floats around $22.2k, up 13% in the last seven days. Over the past month, the crypto has lost 7% in value.
The below chart shows the trend in the price of the coin over the last five days.

Looks like the value of the crypto has been observing some upwards momentum during the last few days | Source: BTCUSD on TradingView
Featured image from Peio Bty on Unsplash.com, charts from TradingView.com, CryptoQuant.com