Ethereum is holding firmly above the $3,150 level as the market shifts into a more bullish phase after enduring weeks of heavy selling pressure and fear-driven liquidation. The recovery has sparked debate among analysts: some view the bounce as nothing more than a relief rally within a broader bearish trend, while others believe Ethereum may be building the foundation for a more sustained rebound.
Related Reading
A new CryptoQuant report offers one of the clearest insights. According to Ethereum data on Binance, the past several weeks have shown heightened volatility in the Cumulative Volume Delta (CVD) — a metric that tracks real-time buying and selling pressure. This volatility reflects sharp, rapid shifts in trader behavior as the market attempts to stabilize.
Although Ethereum remains in a downtrend from its August peak, recent CVD spikes point to the return of notable buying activity. However, the report emphasizes that these bursts of demand are sporadic and lack the sustained strength needed to confirm a full bullish reversal.
CVD Volatility Highlights Ongoing Battle Between Buyers and Sellers
According to the Arab Chain report, Ethereum’s CVD recently turned positive, coinciding with the price’s attempt to stabilize above the $3,100 level. This shift indicates fresh liquidity entering the market through short-term buy orders, suggesting that some traders are stepping in to accumulate during dips.
However, the sudden spikes and rapid pullbacks within the CVD reveal that the market remains locked in a strong tug-of-war between buyers and sellers. This volatility underscores the fact that Ethereum has not yet reached either temporal stability or a clear structural trend.

The report also highlights the importance of the 30-day correlation between price and CVD, which has held steady at around 0.6 despite lower price levels. This relatively high reading shows that liquidity flows continue to influence Ethereum’s price direction in a meaningful and consistent way. Even though buying pressure appears irregular, its recurring impact on price suggests that traders are still actively responding to market conditions.
Overall, this pattern reflects investors attempting to capitalize on volatility, especially as anticipation grows around potential liquidity inflows tied to upcoming network upgrades. Yet, Arab Chain stresses that without a more sustained accumulation phase and reduced short-term selling, Ethereum may struggle to generate a decisive upward movement.
Related Reading
Ethereum Attempts a Recovery but Faces Key Resistance
Ethereum’s latest price action shows a cautious recovery as ETH climbs back above the $3,150 level, but the chart reveals that the broader structure remains fragile. After a steep decline from the October highs near $4,500, ETH found support slightly above $2,700, where buyers stepped back in with increased volume—visible in the recent surge of green candles at the bottom of the chart. This reaction suggests renewed interest at lower levels, but not yet a decisive shift in trend.

The price is now pressing against the 100-day SMA (red line), a level that previously acted as support and has now flipped into resistance. Reclaiming this line would be an important step toward restoring bullish momentum. Above it, ETH faces another barrier at the 50-day SMA (blue line), which continues to slope downward, reflecting ongoing medium-term selling pressure.
Related Reading
Despite the rebound, volume remains inconsistent, indicating hesitation among market participants. ETH will need stronger follow-through buying to challenge the next resistance zone around $3,300–$3,350, a region aligned with previous breakdown levels.
Featured image from ChatGPT, chart from TradingView.com
Ethereum price extended its increase above the $3,880 zone. ETH is now consolidating gains and might soon aim for a move toward $4,000.
- Ethereum started a fresh increase above the $3,820 and $3,880 levels.
- The price is trading near $3,800 and the 100-hourly Simple Moving Average.
- There was a break below a key bullish trend line with support at $3,800 on the hourly chart of ETH/USD (data feed via Kraken).
- The pair could start a fresh increase if it remains supported above the $3,720 zone in the near term.
Ethereum Price Corrects Some Gains
Ethereum price remained supported above the $3,720 level and started a fresh increase, like Bitcoin. ETH price traded above the $3,800 and $3,850 resistance levels.
There was a move above the $3,880 level. The price tested the $3,920 zone. A high was formed at $3,939 and the price is now correcting gains. There was a move below the 23.6% Fib retracement level of the upward move from the $3,515 swing low to the $3,939 high.
Besides, there was a break below a key bullish trend line with support at $3,800 on the hourly chart of ETH/USD. Ethereum price is now trading near $3,800 and the 100-hourly Simple Moving Average.
On the upside, the price could face resistance near the $3,820 level. The next key resistance is near the $3,840 level. The first major resistance is near the $3,880 level. A clear move above the $3,880 resistance might send the price toward the $3,940 resistance.

An upside break above the $3,940 resistance might call for more gains in the coming sessions. In the stated case, Ether could rise toward the $4,000 resistance zone or even $4,120 in the near term.
Another Drop In ETH?
If Ethereum fails to clear the $3,820 resistance, it could start a downside correction. Initial support on the downside is near the $3,720 level. The first major support sits near the $3,700 zone.
A clear move below the $3,700 support might push the price toward the $3,650 support. Any more losses might send the price toward the $3,550 support level in the near term. The next key support sits at $3,420.
Technical Indicators
Hourly MACD – The MACD for ETH/USD is losing momentum in the bullish zone.
Hourly RSI – The RSI for ETH/USD is now below the 50 zone.
Major Support Level – $3,720
Major Resistance Level – $3,820
The on-chain analytics firm Glassnode has revealed how the Ethereum futures market is still overheated despite the long squeeze that just occurred.
Ethereum Open Interest Still Notably Above The Yearly Average
In a new post on X, Glassnode has discussed about how the Ethereum futures market has changed during the past day. ETH, like other digital assets, has witnessed significant volatility inside this window. Sharp price action usually means chaos for the derivatives side of the sector and indeed, a large amount of liquidations have piled up on the various exchanges.
Given that the price action has been majorly towards the downside for Ethereum, the long investors would be the most heavily affected. Below is the chart shared by the analytics firm that shows the trend in the long liquidations related to ETH over the past year.

From the graph, it’s visible that the Ethereum futures market has just witnessed a massive amount of long liquidations. “Yesterday, $76.4M in ETH long liquidations hit the market, with $55.8M wiped out in a single hour – the second-largest spike in a year, just behind Dec 9’s $56M,” notes Glassnode.
These liquidations have meant that a notable ETH leverage flush-out has occurred on the derivatives platforms. Here is another chart, this time for the Open Interest, which showcases the market deleveraging:

The “Open Interest” is an indicator that keeps track of the total amount of Ethereum-related futures positions that are open on all centralized derivatives exchanges. At the start of the month, this metric was sitting around $20.5 billion, but after the mass liquidation event, its value has come down to $15.9 billion.
This suggests $4.6 billion in positions have been wiped out from the market. While this represents a large decrease, it has actually not been enough to cause a sufficient cooldown in the Open Interest.
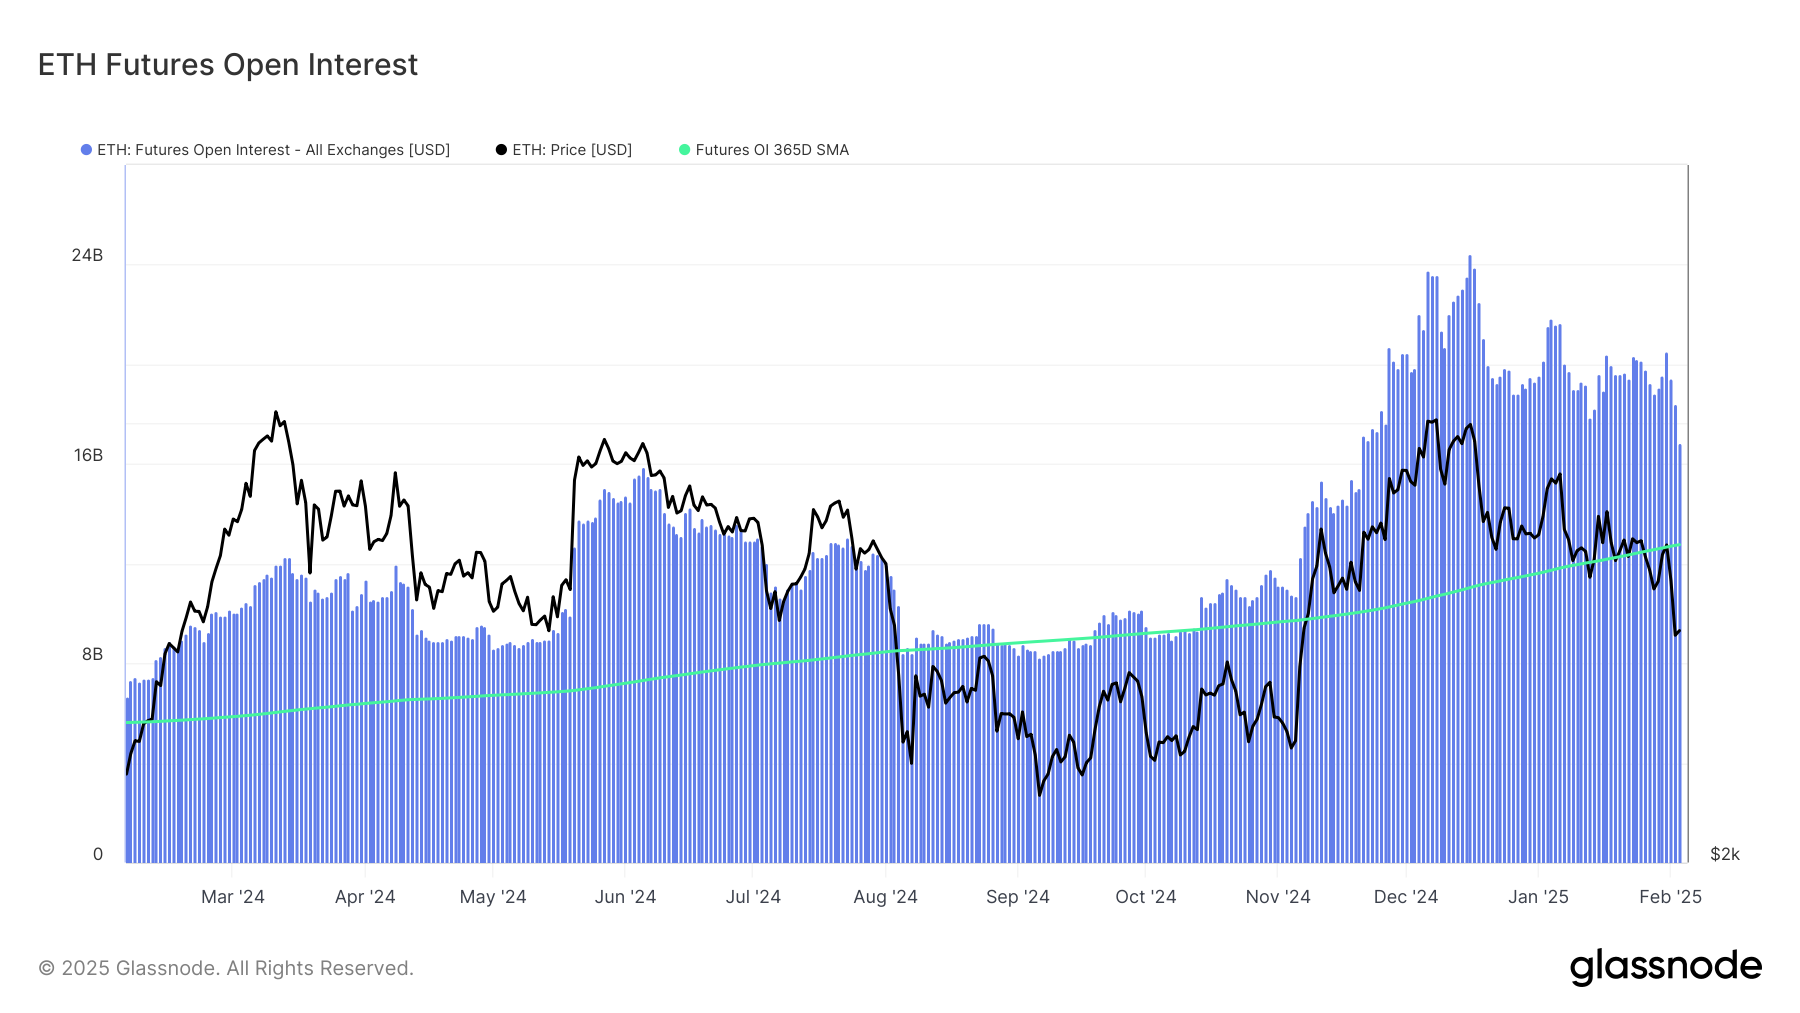
As displayed in the above chart, the 365-day moving average (MA) of the Ethereum Open Interest is currently situated at $13 billion. Thus, the metric’s daily value is around 22% higher than the average for the past year.
This could be a potential indication that the leverage in the sector is still at elevated levels, despite the massive amount of liquidations that the long investors have suffered.
Historically, an overheated futures market has generally unwound with volatility for the coin’s price, so it’s possible that more sharp action could follow for ETH in the near future.
ETH Price
Ethereum saw a crash towards the $2,100 mark yesterday, but it would appear the cryptocurrency has seen a rebound as its price is now trading around $2,800.
]]>How BlockDAG’s Iconic Keynote Elevated its Potential for 30000x ROI; More on Shiba Inu Price & Tron DeFi Ecosystem Techpoint Africa
Source link ]]>
Shibarium’s Activity Surge: Wallet Growth And Elevated SHIB Burn Rate – Bullish Signal For Shiba Inu? NewsBTC
Source link ]]>
Bitcoin, ethereum defy slide in equities; dogecoin stays elevated (Cryptocurrency:BTC-USD) Seeking Alpha
Source link ]]>
Dogecoin Still Elevated; Bitcoin Trading Just Below $28,000 The Wall Street Journal
Source link ]]>

-
Artificial Intelligence (AI) assets have surged in 2023.
-
In the US, C3.ai stock price has more than doubled.
-
AI cryptocurrencies like SingularityNET, Fetch, and ALI have surged.
Artificial Intelligence (AI) has been the most popular phrase in 2023 following the successful unveiling of ChatGPT by OpenAI. In the aftermath, most investors have flooded to AI assets. In stocks, the C3.ai stock price has soared by over 124% in the past 30 days.
The performance has also happened in the crypto industry. Recently, Justin Sun, the founder of Tron announced that his organization will start working on AI. At the same time, many cryptocurrencies with an AI and big data tilt have done well.
However, historically, such parabolic moves end in tears. For example, in 2021, the talk of town was on the best metaverse cryptocurrencies like Decentraland and Sandbox. Their tokens then crashed in 2022. Similarly, gaming cryptocurrencies like Gala and MOBOX also crashed.
Therefore, it might be rewarding to be contrarian and short some of the high-flying AI cryptocurrencies that are soaring.
SingularityNET | AGIX and SDAO
SingularityNET’s tokes, AGIX and SDAO have surged in the past few months. They have jumped by 647% and 340%, respectively in the past 30 days. According to CoinMarketCap, they have soared by 195% and 252% in the past 7 days. This makes them some of the best-performing coins in the industry.
SingularityNET is building a decentralized AI platform where anyone can search and buy AI products. Developers can also build and sell their AI products. It also has a Domain Specific Language (DSL). While the ecosystem is growing, I suspect that the AGIX and SDAO prices will retreat soon, as I wrote in this article.
How to buy SingularityNET
Fetch.ai | FET
Fetch.ai is another AI cryptocurrency that has done well in 2022. The token has surged by over 200% in the past 30 days and by 90% in the past 30 days. Fetch is a platform that builds autonomous agents that help developers to automate repeatable processes. It helps to power peer-to-peer applications with automation and AI.
Like SingularityNET, the main reason why FET price has jumped is because of its AI tools. It also introduced staking a few months ago and got listed by several exchanges. However, with no major catalysts, I suspect that the coin will come back to earth as momentum wanes.
How to buy Fetch.ai
eToro
eToro offers a wide range of cryptos, such as Bitcoin, XRP and others, alongside crypto/fiat and crypto/crypto pairs. eToro users can connect with, learn from, and copy or get copied by other users.
Binance.US
Binance.US provides secure and reliable access to the world’s most popular cryptocurrencies, with some of the lowest fees in the industry.
Artificial Liquid Intelligence | ALI
Artificial Liquid Intelligence has moved from nowhere to become one of the biggest cryptocurrencies in the world. ALI, its token is now valued at over $280 million. Yet little is known about the coin, other than the fact that its name has AI in it. Reminds me of when bogus companies used to introduce dot com suffix during the dot com bubble.
ALI is the native token for Alethea AI, which describes itself as the world’s first multimodal AI system that generates characters from natural language. According to its website, it is backed by Binance, Crypto.com, and Multicoin Capital. Therefore, like Fetch and Singularity, I suspect that ALI price will nosedive soon.
Please note that this criticism is based purely on price action and the fact the ongoing rally is not sustainable. It is also guided by the statement that investors should always be greedy when everyone is greedy.
How to buy Artificial Liquid Intelligence
As ALI is such a new asset, it’s yet to be listed on major exchanges. You can still purchase ALI using a DEX (decentralised exchange) though, which just means there are a few extra steps. To buy ALI right now, follow these steps:
1. Buy ETH on a regulated exchange or broker, like eToro ›
We suggest eToro because it’s one of the world’s leading multi-asset trading platforms, an exchange and wallet all-in-one with some of the lowest fees in the industry. It’s also beginner-friendly, and has more payment methods available to users than any other available service.
2. Send your ETH to a compatible wallet like Trust Wallet or MetaMask
You’ll need to create your wallet, grab your address, and send your coins there.
3. Connect your wallet to the 1Inch DEX
Head to 1Inch, and ‘connect’ your wallet to it.
4. You can now swap your ETH for ALI
Now that you’re connected, you’ll be able to swap for 100s of coins including ALI.
Ethereum has seen an upwards push of 4% in the last couple of days as whales have displayed elevated levels of activity.
Ethereum Whale Transactions At Highest Level Since December 16th
As per data from on-chain analytics firm Santiment, whales have made 611 transactions in the past day. The relevant indicator here is the “whale transaction count,” which measures the total number of Ethereum transfers taking place on the chain that is worth more than $100,000.
When the value of this metric is high, it means whales are making a large number of transactions right now. Since whale transactions involve the movement of a significant number of coins, enough of them taking place close together can cause visible effects on the price of the crypto. Thus, periods with high values of the metric can be quite volatile.
On the other hand, low values suggest whales aren’t that active at the moment, which can lead to the price not observing any significant action. Now, here is a chart that shows the trend in the Ethereum whale transaction count over the past month:
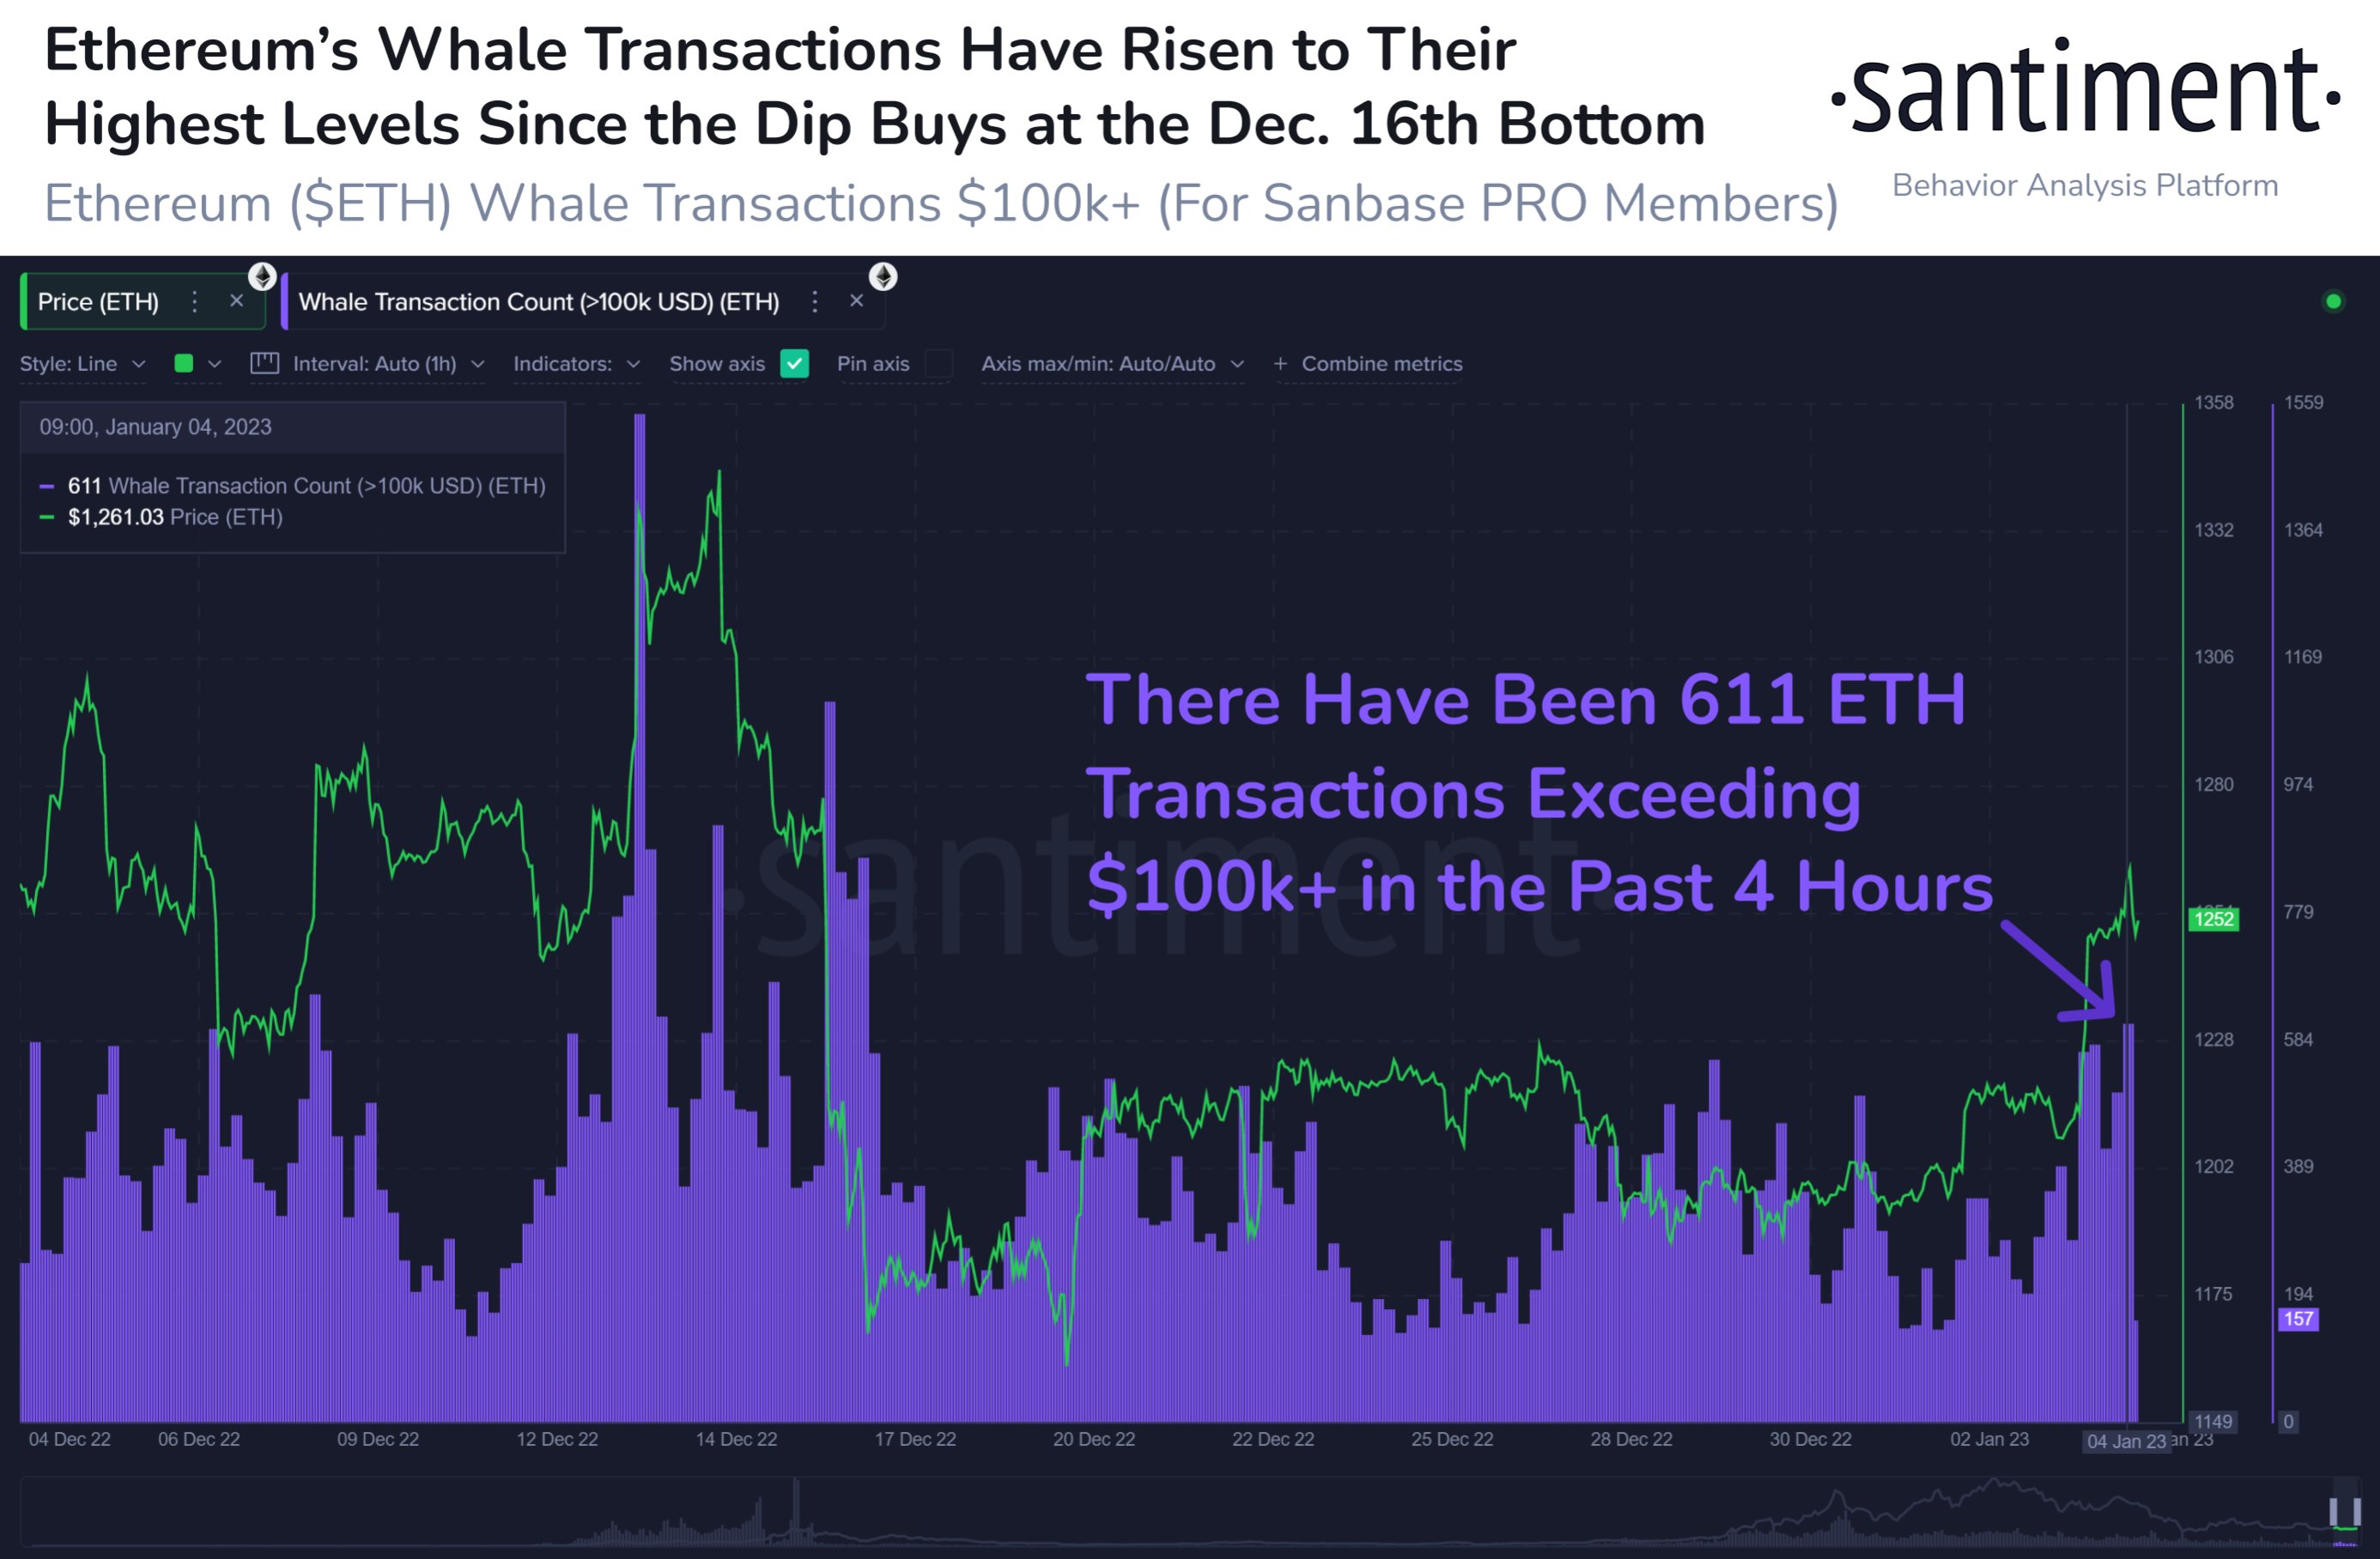
The value of the metric seems to have been relatively high in recent days | Source: Santiment
As the above graph displays, the Ethereum whale transaction count has observed a surge in the past day. During this period of elevated activity, whales have made 611 transactions so far, which is the highest level since December 16, when the price of the crypto saw a sharp downward move and created a local bottom of around $1,160.
This spike on the December 16 bottom was higher in magnitude than the current one and was a sign that a large number of whales were buying up the crypto at those low prices. The latest spike, on the other hand, has occurred while the ETH price has been climbing up, as is apparent from the chart.
One possibility is that this could imply whales are optimistic about this latest buildup and are thus buying more while they still can. Such backing from these humongous holders could sustain the rally further, and take Ethereum to higher levels.
However, another probable scenario is that these rapid transactions might be happening for the purpose of selling instead, which, if true, would rather provide an obstacle to this latest price push, as already happened with the rally above $1,300 in the first half of December.
ETH Price
At the time of writing, Ethereum’s price floats around $1,250, up 4% in the last week.

Looks like the value of the crypto has seen some uplift during the last couple of days | Source: ETHUSD on TradingView
Featured image from DrawKit Illustrations on Unsplash.com, charts from TradingView.com, Santiment.net
Major coins regained buoyancy late on Thursday, after crashing a day prior, in wake of soft economic data released. The global cryptocurrency market cap shot up 8.85% to $880 billion at 8:41 p.m. EST.
| Coin | 24-hour | 7-day | Price |
|---|---|---|---|
| Bitcoin BTC/USD | 7.8% | -13.85% | $17,454.51 |
| Ethereum ETH/USD | 11.9% | -16.85% | $1,278.40 |
| Dogecoin DOGE/USD | 18.6% | -22.9% | $0.09 |
| Cryptocurrency | 24-Hour % Change (+/-) | Price |
|---|---|---|
| Chiliz (CHZ) | +38.9% | $0.22 |
| Polygon (MATIC) | 30.5% | $1.11 |
| FTX Token (FTT) | +34.6% | $3.42 |
See Also: Robinhood vs. Forex.com Review
Why It Matters: Gains in Dogecoin surpassed those in Bitcoin and Ethereum at the time of writing after cryptocurrencies staged a recovery following data that showed October inflation cooled down to 7.7%, below estimates of 8%.
Thursday’s data indicates that steps taken by the U.S. Federal Reserve are having an impact on moderating price rises.
“This inflation report was a nice surprise. Inflation has been very slow to come down, but this report gives up hope that this deceleration with pricing pressures might bring back hopes of a soft landing,” said Edward Moya, a senior market analyst with OANDA.
“This inflation was a good sign that the Fed is on the right path for winning this war with inflation, but there will still be a lot of variables thrown its way over the next couple of quarters. The Fed could easily bring rates to 5.00% and if inflation proves to be [more sticky], it could be as high as 5.50%,” said Moya, in a note seen by Benzinga.
On the current crisis, Moya said, “FTX contagion risks remain elevated and while today’s broad-based crypto rally is rather impressive with Bitcoin rising over 10% and Ethereum surging by 16%, investment into cryptocurrencies will likely struggle here as too many key institutional investors and crypto companies have money tied up with the bankruptcy bound exchange.”
On Thursday, cryptocurrency and decentralized finance platform BlockFi said it was “limiting” activity and pausing client withdrawals, citing uncertainty over the FTX crisis.
Michaël van de Poppe tweeted that Bitcoin should have been at $25,000 in wake of the drop in consumer price inflation.
“Patience required as FTX just happened and need to see how [the] coming 48 hours develop,” said the trader.
Justin Bennett noted that the dollar index was down 1.8% at the time he tweeted. The trader said, “Last Friday’s 2% decline was the largest single-day percentage drop since 2015. Crazy to have two daily candles like this in two consecutive weeks.”
The dollar index was seen at 108.41 at the time of writing. In recent months, the index and Bitcoin and cryptocurrencies have had an inverse relationship.
The highest negative funding rates in 2022 are currently in play, said CryptoQuant analyst Minkyu Woo.
“It can be interpreted that many traders are placing short positions on BTC and are willing to pay long traders,” said the analyst.
“In general, massive liquidations which are opposite to the funding rates are likely to occur.”
Read Next: Tron’s Justin Sun Says Working With FTX to ‘Initiate Pathway Forward’ After Binance Fallout