Crypto analyst Merlijn has revealed that Bitcoin has just re-entered the DCA zone, indicating it’s a good time to buy BTC. The leading crypto is already staging another rebound, rising to the psychological $70,000, which has so far proved to be a major resistance level.
Bitcoin Reenters DCA Zone As Price Eyes Another Rally
In an X post, Merlijn stated that Bitcoin has just entered the DCA zone on the rainbow chart and that BTC is now back in the DCA zone. He noted that a massive rally has followed every time this has happened. At the same time, this is when retail investors have panicked and sold. The analyst added that this chart has never been wrong.
Related Reading
In another X post, Merlijn stated that Bitcoin has reached a critical level, especially as it continues to trade within a tight range between $60,000 and $70,000. His accompanying chart showed that BTC could rally above $120,000 if it holds this support level. However, there is the possibility of a larger decline if it fails to hold this current range.

The analyst also revealed that Bitcoin is mirroring the 2021 top exactly with the same sequence, lower highs, and the same structure. He noted that 2021 ended with one final flush before the recovery. Merlijn said the $60,000 level is the last line of defense, and a hold above it would mean buyers are taking control. However, a drop below this level would put liquidity clusters below as the next targets.
Bitcoin saw a violent recovery following the final flush below, and the analyst is confident that this time won’t be different. Crypto analysts like Benjamin Cowen have predicted that BTC could recover by the second half of this year as part of the 4-year cycle.
Peter Brandt Predicts A Breakout For BTC
Veteran trader Peter Brandt has predicted that Bitcoin could break out to the upside. In an X post, he said, alluding to BTC’s daily and weekly charts, that “the Big Banana is forming a Little Banana — and it indicates there is about to be a Banana Split.” His accompanying chart showed that the flagship crypto could rally to $82,500 by April.
Related Reading
In the long term, Brandt predicted that Bitcoin could rally to $120,000 and possibly $280,000. His prediction comes just days after he admitted that BTC may be in the midst of a bullish reversal. The veteran trader said that he viewed Bitcoin’s rally to $74,000 back then as potentially a significant change in price behavior since the October top last year.
At the time of writing, the Bitcoin price is trading at around $69,900, up over 3% in the last 24 hours, according to data from CoinMarketCap.
Featured image from Pngtree, chart from Tradingview.com
Bitcoin’s higher-timeframe structure is in an interesting state, according to crypto analyst Crypto Patel, who is of the notion that the cryptocurrency has officially entered bearish territory after breaking a long-term support level at $107,000.
Technical analysis of price action on the weekly candlestick price chart shows Bitcoin is now in this bearish territory, with a projection of a deeper correction to as low as $35,000 in 2026. The outlook is based on Fibonacci retracement levels that could determine Bitcoin’s next price move.
Bearish Territory Kicked In After Breakdown Below $107,000
The outlook of this technical analysis is based on the premise that Bitcoin entered into bearish territory after the price broke down below a major higher-timeframe ascending trendline around $107,000. This trendline, which is visible on the weekly chart shared by Crypto Patel, acted as dynamic support throughout much of the 2023 to 2025 rally. It connected a series of higher lows and helped sustain the broader bullish structure that ended with Bitcoin reaching a peak price of $126,080.
Related Reading
The chart shows the breakdown zone with a red circle, indicating where the price decisively lost that upward support. After the breach, Bitcoin entered into a changed momentum and began printing lower highs. According to Patel, that trendline was the line in the sand, and losing it was when Bitcoin officially entered bearish territory. The market now needs a healthy correction before the next leg up.

Fibonacci Levels Point To $44,000 And $35,000
Bitcoin has been on a downward path since the beginning of the year, and the projection is that this will continue until it bottoms out around $35,000. This outlook is based on how much the Bitcoin price corrected in previous cycles.
Related Reading
For instance, the 2018 bear market saw an approximately 84% decline from peak to trough. Similarly, the 2022 correction erased roughly 77% from its cycle high. In both instances, these deep retracements came before the next major rally.
Based on that historical perspective, a move below $50,000 from the current price level would not be unprecedented. Instead, it would fit within Bitcoin’s established cycle behavior.
The projected downside targets are derived from Fibonacci retracement levels drawn from the October 2025 all-time high. Two levels stand out clearly on the chart. The first level is the 0.5 Fibonacci retracement, which is currently around $44,000. The 0.5 Fibonacci retracement is a mid-cycle pullback level and has always attracted strong buying interest in previous corrections, making it a possible stabilization point if selling pressure slows down.
Should Bitcoin fail to find support near $44,000, then the next level is the 0.618 Fibonacci retracement around $35,000. The expectation is that Bitcoin will eventually bottom at $35,000 even if it fails to hold above $44,000. At the time of writing, Bitcoin is trading at $63,740, down by 6% in the past 24 hours.
Featured image from Pngtree, chart from Tradingview.com
Dogecoin RSI Just Entered Historical Oversold Levels Again, Will It Repeat 2021? Bitget
Source link ]]>
A crypto analyst has announced that the XRP price has just entered a neutral state and could be gearing up for a major rally. He explains how this phase has historically appeared before strong rallies and outlines what the current market structure may signal for XRP moving forward.
XRP Price Enters Neutral State Before Bull Rally
Crypto expert and data analyst CW recently shared a fresh update on XRP’s price action, noting that the cryptocurrency has broken out from its bottom and moved into a neutral state. He said this shift marks the early stage of a larger bull rally, with a decisive move above the previous all-time high acting as the key signal for price acceleration.
Related Reading
The chart he shared shows XRP following a repeated four-phase pattern across multiple market cycles, first from 2014 to 2018 and again from 2017 to date. In the 2014 cycle, Phase 1 began with a sharp breakout to TP1, setting a new ATH. From that peak, XRP entered Phase 2, which formed a Symmetrical Triangle. During this phase, XRP moved sideways within a tightening range for several months.
Phase 3 came next, marking a long consolidation period for XRP. Eventually, XRP’s price broke the upper boundary of the symmetrical triangle and entered Phase 4. In this final phase, XRP surged to TP2, reaching a second ATH at the 6.618 Fibonacci extension level.

According to the chart, XRP has already completed Phases 1-3 in the current cycle and has entered Phase 4. After hitting its first peak around $3.5 (TP1) earlier in 2025, the cryptocurrency recently broke above the upper boundary of a similar Symmetrical Triangle pattern, entering a “neutral state.”
Now that XRP has reached this state, CW noted that it has entered Phase 4, the final stage of the four-phase historical pattern. The analyst has projected a second new all-time high for XRP near $21.5, aligning with the 6.618 Fibonacci extension level from the 2014 cycle.
How Momentum Indicators Reacted During Each Phase
At the bottom of CW’s price chart is a Stochastic Oscillator and a Moving Average Convergence Divergence (MACD) histogram. The stochastic shows overbought and oversold conditions for each cycle.
Related Reading
In Phase 2 of each cycle, the stochastic frequently hits oversold levels, which align with the extended consolidation and price decline observed in that period. During Phase 3, it stays around the middle range, reflecting a neutral state. Finally, in Phase 4 of the 2014 cycle, it spikes toward overbought levels, coinciding with strong price breakouts.
Meanwhile, the MACD histogram mirrors momentum shifts in each phase. During Phase 1, the histogram shows strong positive bars during the initial breakout. Phase 2 saw negative bars as the price declined, signaling bearish momentum. After this, Phase 3 showed small, fluctuating bars, indicating low momentum. Lastly, in Phase 4, the histogram rapidly expands on the breakout, pushing its price to new ATHs in 2014.
Featured image from Freepik, chart from Tradingview.com
Bitcoin (BTC) has entered an extreme oversold phase, with momentum indicators dropping to levels that historically signal market exhaustion and a trend reversal. Researchers tracking macro conditions and long-term price behavior say that the current drawdown reflects a reset in positioning, not the end of the bull market. Based on past recovery patterns, the analyst believes that Bitcoin could soon forge a path toward a new all-time high.
Bitcoin Enters Extreme Oversold Territory
Thomas Lee, Co-founder and Chief Investment Officer (CIO) of Fundstrat Capital, has flagged Bitcoin’s latest market condition as a key technical development. He pointed to data from Bittel Julien, head of macro research at Global Macro Investor, which highlights how deeply oversold Bitcoin has become within the current cycle and the cryptocurrency’s potential to reach a new ATH.
Related Reading
In his post on X, Lee publicly commended Julien’s analysis, emphasizing that historically extreme oversold conditions in BTC have often been followed by meaningful bounces. Julien, who also shared his report on X this Wednesday, explained that his analysis responds to frequent requests for updates on a long-running market model that tracks Bitcoin’s behavior following major momentum breakdowns.
According to him, the model examines BTC’s average price path after the Relative Strength Index (RSI) falls below 30, a level widely considered to indicate extreme oversold conditions. The analyst stated that Bitcoin’s recent price action has closely followed technical historical patterns, provided the broader bull market structure remains intact.
The accompanying chart compares current Bitcoin price behavior with the average historical trajectory observed after the last five instances in which the cryptocurrency entered oversold territory. The point at which RSI declines below 30 is marked as “time zero.” In previous cycles, this moment typically followed a period of stabilization and a strong upward recovery over the following weeks and months.

Based on historical averages, Julien sees a potential path toward new all-time highs if Bitcoin continues to track past recovery patterns. While the market researcher cautions that the chart is not perfect, he argues that it remains a useful analytical framework, particularly if the four-year cycle thesis continues to play out.
BTC Cycle Could Extend Into 2026 As 4-Year Pattern Breaks
Julien’s analysis also suggests that the current Bitcoin cycle could extend well into 2026 and challenge the relevance of the traditional four-year cycle thesis. According to the market researcher, the BTC cycle has never been driven by halving events, contrary to what the broader crypto community believes. Instead, he stated that the cycle is fueled by public debt refinancing, which was delayed by a year after COVID.
Related Reading
He highlighted that Bitcoin’s four-year cycle is now officially broken due to an increase in the weighted average maturity of the debt term structure. He also noted that liquidity conditions and ongoing interest expense monetization, which far exceed GDP growth, support a prolonged cycle.
Furthermore, Julien emphasized that Bitcoin’s price bases usually take time to form and often include periods of volatility before a significant upward move occurs. The market researcher explained that his analysis was not a signal of an immediate market decline but rather a framework that assumes the bull market is still firmly in place.
Featured image created with Dall.E, chart from Tradingview.com
Crypto analyst Dark Defender has been one of the most vocal supporters of XRP, and this stance has not changed despite the altcoin’s current price action. If anything, the analyst believes that the current downtrend actually plays into the XRP long-term target, claiming that the cryptocurrency remains inherently bullish. If the analyst is right, then it means that the XRP price could be gearing up for another major uptrend that could send it to new peaks.
XRP Price Is Only In Wave 4, Not A Bear Market
In the post that was shared on X, Dark Defender explained that the XRP cryptocurrency was not in any kind of bear market. Instead, the current downtrend is only a result of the altcoin entering Wave 4 of the Elliot Wave, leading to the decline.
Related Reading
Given that Wave 4 is a historically bearish wave, it would explain why the XRP price has dropped so quickly. However, the crypto analyst explained that this wave did not just start, as it has been in play since February 2025. Hence, it would need to play out completely before the next wave can begin.
Going by this analysis, it would mean that the last and final wave of the theory is yet to play out, which is often the most bullish of all the waves. As a result, the analyst urges XRP investors not to panic as the price continues to play out according to plan. In the end, the target remains $5.85, according to Dark Defender, beating its previous all-time high of $3.8.

Price Could Be Rounding A Bottom
Another analyst also contributes that the XRP price is not in a bear market, and could, in fact, be putting in a bottom. STEPH IS CRYPTO points out that the XRP RSI is actually showing a rare bullish divergence on the daily chart, one of the few times that this has happened over the years.
Related Reading
This is significant because back in 2022, a similar bullish divergence had appeared on the daily chart ,and the result was a rapid rise once the distribution was done. As the crypto analyst explains, the fact that this bullish RSI divergence has appeared on the XRP daily chart again suggests that the sellers are actually running out of steam.
While there is no set target for where the XRP price is headed, the prediction suggests that a rally could be in the works. “Nothing is guaranteed — but from a technical perspective, this is one of the strongest early reversal signals you can get,” the analyst stated.
Featured image from Dall.E, chart from TradingView.com
Tired of Dogecoin (DOGE) Losses? This Audited Token Just Entered The Market and Hit 50% Gains in Weeks TradingView
Source link ]]>
Cardano (ADA) Bulls Are Exhausted, XRP Risks Losing $2 After This, Shiba Inu (SHIB) Just Entered Local Uptrend U.Today
Source link ]]>
Market Veteran Identifies 4 Factors Suggesting Dogecoin Has Entered a Parabolic Run The Crypto Basic
Source link ]]>
Crypto analyst Ash Crypto has revealed that Bitcoin has entered the ‘thrill’ phase. The analyst further explained what to expect from the flagship crypto moving forward, having entered this phase of the bull run.
What To Expect From Bitcoin In ‘Thrill’ Phase
In an X post, Ash Crypto revealed that Bitcoin is entering the thrill phase. Based on this, he told market participants to expect high volatility and more liquidation. Overall, the analyst remarked that the Bitcoin price trend will be to the upside as it continues to hit new all-time highs (ATHs). He predicts that BTC will rally to as high as $150,000.
Related Reading
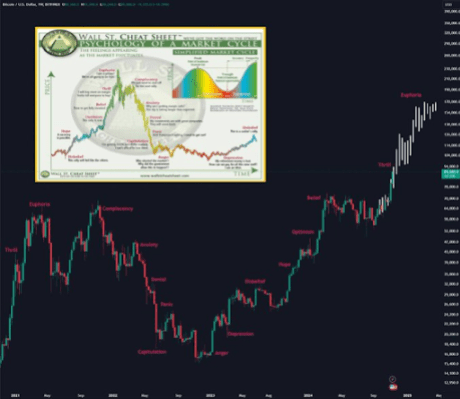
His accompanying chart showed that the thrill phase of the market cycle is when investors and traders may get overexcited about the bull rally and decide to go all in with leverage. However, as Ash Crypto indicated, this could go wrong since there will be a lot of liquidations during this period.
Despite this being a bull market, the Bitcoin price has, at different times, corrected after reaching new highs and flushing out over-leveraged longs in the process. Alex Thorn, Head of Research at Galaxy Research, also explained earlier in the year that bull markets aren’t straight lines up and that significant price corrections are expected.
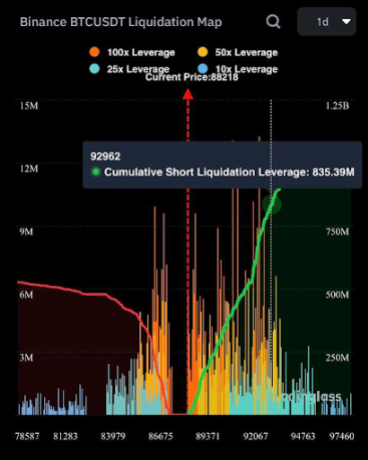
However, in the long run, the bears get the short end of the stick in a bull run as prices trend upwards. Crypto analyst Ali Martinez recently revealed that over $800 million will be liquidated if Bitcoin rebounds towards $93,000. This is a price level that BTC just reached two days ago as it rallied to a new ATH of $93,400.
The Bitcoin price has since corrected and dropped below $90,000. This was partly due to the US PPI inflation data, which was higher than forecasted. That development has cast some doubts about whether the Fed will be willing to further cut interest rates in December.
More Price Correction In The Short Term?
Ali Martinez suggested that the Bitcoin price could experience further declines in the short term. In an X post, the crypto analyst said that the daily Relative Strength Index (RSI) shows that Bitcoin is in overbought territory, which typically signals a potential price correction ahead.
Related Reading
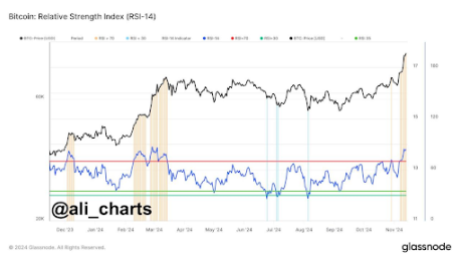
This price correction could also happen as Bitcoin investors look to secure profits. Martinez revealed that $5.2 billion in BTC profits have been realized and that the sell-side risk ratio has surged to 0.524%. He warned market participants to stay alert and proceed with caution. Bhutan Government falls among whales that are already securing profits as they recently sold $33 million worth of BTC, just weeks after selling $66 million BTC.
At the time of writing, the Bitcoin price is trading at around $87,780, down over 2% in the last 24 hours, according to data from CoinMarketCap.
Featured image created with Dall.E, chart from Tradingview.com