Bitcoin is facing panic selling as tensions between the U.S. and Iran escalate, with both countries launching airstrikes, a move that has sparked fears of a full-blown war. Expert Colin has warned of a BTC crash as the leading crypto risks losing key support levels. Bitcoin Faces Panic Selling, Raising Concerns Of A BTC Crash
The post Bitcoin Faces $1.8B in Panic Selling as U.S.-Iran Airstrikes Escalate; Will BTC Crash Below $60k? appeared first on CoinGape.
]]>
Bitcoin (BTC) continued its pullback on June 17, sliding over 4% amid renewed military and political friction between Israel and Iran.
The flagship crypto fell to an intraday low of $103,300 before bulls stepped in to steady the price and push it back above $104,000,
As of press time, Bitcoin was trading at $104,439, down roughly 3.87% over the past 24 hours. Meanwhile, the wider crypto market fared relatively worse with a 6% average decline across the board.
The impact on altcoins is highlighted by the nearly $508 million in liquidations in the past 24 hours, with over $167 million attributed to Ethereum (ETH) positions, according to Coinglass data.
ETH was trading at $2,471.72 as of press time, down 5.58% over the past 24 hours, while XRP was trading at $2.16 after a 6% decline. BNB saw significantly lower volatility over the same period and was down around 1.6% over the past day and trading at $647.77 as of press time.
Solana was down 5.6% and trading at $148.77 as of press time, while Cardano was down 5.6% to $0.6175.
Middle East tensions escalate
Price action was directly linked to the outbreak of fresh hostilities in the Middle East. Israel said its forces killed a senior Islamic Revolutionary Guard Corps commander in Tehran early on June 17.
This latest strike in a five-day exchange that has involved missiles, drones, and warnings to civilians.
In Washington, President Donald Trump posted that the US “knows where Iran’s Supreme Leader is hiding” and demanded Iran’s “UNCONDITIONAL SURRENDER,” escalating rhetoric around possible US involvement.
Traders watch as the prospect of wider regional conflict instigates risk aversion across global assets, including crypto.
Viable hedge
Analysts recently highlighted Bitcoin’s relative strength, calling it a viable alternative to increase a hedge in portfolios.
Ecoinometrics found that adding a 10% Bitcoin sleeve to a classic 60/40 allocation lifted the past-year risk-adjusted return to 0.80 with a 14% gain, versus 0.62 and 12% for the same swap into gold.
Fidelity strategists Chris Kuiper and Jurrien Timmer say that persistent inflation and policy uncertainty have weakened the hedging role of bonds, making scarce digital assets such as Bitcoin an increasingly favored ballast in diversified portfolios.
Bitcoin Market Data
At the time of press 10:13 pm UTC on Jun. 17, 2025, Bitcoin is ranked #1 by market cap and the price is down 3.85% over the past 24 hours. Bitcoin has a market capitalization of $2.08 trillion with a 24-hour trading volume of $58.21 billion. Learn more about Bitcoin ›
Crypto Market Summary
At the time of press 10:13 pm UTC on Jun. 17, 2025, the total crypto market is valued at at $3.25 trillion with a 24-hour volume of $141.25 billion. Bitcoin dominance is currently at 63.90%. Learn more about the crypto market ›
Mentioned in this article
Bitcoin, Ethereum, Dogecoin Drop As Geopolitical Tensions Escalate Benzinga
Source link ]]>
 ADA News: Internal Tensions Escalate as Cardano Leaders Disagree on Budget Strategy Binance
Source link ]]>
Predictions Escalate as 1Fuel (OFT) Prepares to Impact Shiba Inu’s Market with Innovative Strategies Analytics Insight
Source link ]]>
Bitcoin, Ethereum, Dogecoin Slide As Middle East Tensions Escalate After Hezbollah’s Israel Attack: Trader Says Sentiment Will Remain Bullish As Long As King Crypto Stays Above This Level Benzinga
Source link ]]>
This week, the Bitcoin price has been facing strong selling pressure with the Bitcoin ETFs reporting two consecutive days of outflows after 19 consecutive days of inflows. On Tuesday, June 11, the total outflows registered by the US bitcoin ETFs surged to $200 million.
Bitcoin ETF Trading Volumes Spikes
According to data from Santiment, Bitcoin ETF trading volume has surged to its highest level since May 15. This spike, observed among the top seven largest ETFs, suggests a potential for a price turnaround. Analysts believe the recent volume increase is likely a response to a dip-buying opportunity, indicating renewed investor interest and activity in the market.

On June 11, US Bitcoin spot ETFs experienced a total net outflow of $200 million, marking the second consecutive day of outflows. Grayscale’s GBTC alone saw a single-day outflow of $121 million. Consequently, the total net asset value of Bitcoin spot ETFs has dropped below $60 billion, currently standing at $59.227 billion.
BTC Price Rebound Ahead?
Santiment reports that Bitcoin’s recent dip below $67,000 has led to an increase in buy calls on social media. Historically, when sell calls start to close the gap on buy calls, it indicates rising panic and fear, often leading to a rebound in cryptocurrency prices.
The May 2024 Consumer Price Index (CPI) report will arrive later today, at 12:30 pm UTC (11 hours from now). Analysts currently anticipate a 3.4% Year-over-Year (YoY) or 0.3% Month-over-Month (MoM) increase.
Should the actual figures come in lower than expected, it could signify a slowdown in inflation, potentially boosting the prospects of cryptocurrency prices rising. Conversely, if the numbers exceed expectations, it may indicate ongoing inflation concerns, potentially leading to a drop in cryptocurrency values.
Ahead of the FOMC meeting, the Bitcoin price faces strong selling pressure amid BTC miner capitulation. If the Bitcoin price drops under $67,000, we can see a further pullback of 5-8% in the coming weeks.
The presented content may include the personal opinion of the author and is subject to market condition. Do your market research before investing in cryptocurrencies. The author or the publication does not hold any responsibility for your personal financial loss.
Cardano (ADA) Marks New Yearly High in Bitcoin-led Rally, Hopes of Reaching $1 Escalate DailyCoin
Source link ]]>
XRP price is moving lower below the $0.5200 support. The price could gain bearish momentum if there is a close below the $0.50 support.
- XRP is showing bearish signs below the $0.525 and $0.512 resistance levels.
- The price is now trading below $0.520 and the 100 simple moving average (4 hours).
- There was a break below a key contracting triangle with support at $0.5220 on the 4-hour chart of the XRP/USD pair (data source from Kraken).
- The pair is now at risk of more downsides below the $0.5000 support zone.
XRP Price Takes Hit
In the past few days, XRP price heavy bearish moves below the $0.550 support. The bears remained active near the $0.5500 resistance and protected a recovery wave, unlike Bitcoin and Ethereum.
There was a fresh decline from the $0.5389 high and the bears pushed the price below $0.5200. There was a steady decline and there was a break below a key contracting triangle with support at $0.5220 on the 4-hour chart of the XRP/USD pair.
The price is now trading below $0.520 and the 100 simple moving average (4 hours). A low is formed near $0.5012, and the price is now consolidating losses. On the upside, immediate resistance is near the $0.520 zone. It is near the 50% Fib retracement level of the downward wave from the $0.5389 swing high to the $0.5012 low.
The first key resistance is near $0.530 or the 76.4% Fib retracement level of the downward wave from the $0.5389 swing high to the $0.5012 low, above which the price could rise toward the $0.5380 resistance.
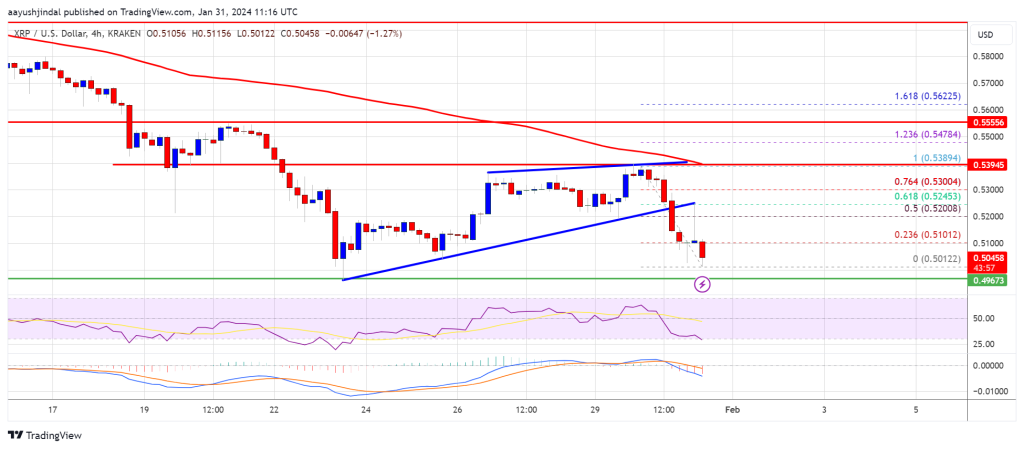
Source: XRPUSD on TradingView.com
A close above the $0.5380 resistance zone could spark a strong increase. The next key resistance is near $0.5550. If the bulls remain in action above the $0.5550 resistance level, there could be a rally toward the $0.5800 resistance. Any more gains might send the price toward the $0.6000 resistance.
Key Downside Break?
If XRP fails to clear the $0.5200 resistance zone, it could continue to move down. Initial support on the downside is near the $0.502 zone.
The next major support is at $0.500. If there is a downside break and a close below the $0.500 level, XRP price might accelerate lower. In the stated case, the price could retest the $0.450 support zone.
Technical Indicators
4-Hours MACD – The MACD for XRP/USD is now gaining pace in the bearish zone.
4-Hours RSI (Relative Strength Index) – The RSI for XRP/USD is now below the 50 level.
Major Support Levels – $0.505, $0.500, and $0.450.
Major Resistance Levels – $0.520, $0.538, and $0.550.
Disclaimer: The article is provided for educational purposes only. It does not represent the opinions of NewsBTC on whether to buy, sell or hold any investments and naturally investing carries risks. You are advised to conduct your own research before making any investment decisions. Use information provided on this website entirely at your own risk.
Bitcoin price is sliding and trading below $27,000. BTC is still at risk of more downsides below the $26,500 and $26,200 support levels.
- Bitcoin is moving lower and showing bearish signs below $27,000.
- The price is trading below $27,000 and the 100 hourly Simple moving average.
- There are two bearish trend lines forming with resistance near $26,950 and $27,400 on the hourly chart of the BTC/USD pair (data feed from Kraken).
- The pair could continue to move down toward the $26,000 support in the near term.
Bitcoin Price Extends Losses
Bitcoin price struggled to start a recovery wave above the $27,500 resistance. BTC remained in a bearish zone and declined further below the $27,000 level.
There was a drop below the $26,800 level and the price tested the $26,500 support. A low is formed near $26,551 and the price is again attempting a recovery wave. There was a minor increase above the $26,800 level. However, the price is still facing many hurdles.
Bitcoin is now trading below $27,000 and the 100 hourly Simple moving average. There are also two bearish trend lines forming with resistance near $26,950 and $27,400 on the hourly chart of the BTC/USD pair.
Immediate resistance is near the $26,950 level and the first trend line. It is close to the 23.6% Fib retracement level of the downward move from the $28,284 swing high to the $26,551 low. The next key resistance could be near the $27,400 level and second the trend line.
The second trend line is near the 50% Fib retracement level of the downward move from the $28,284 swing high to the $26,551 low. The first major resistance is $27,500 and the 100 hourly Simple moving average, above which Bitcoin might test $27,800.
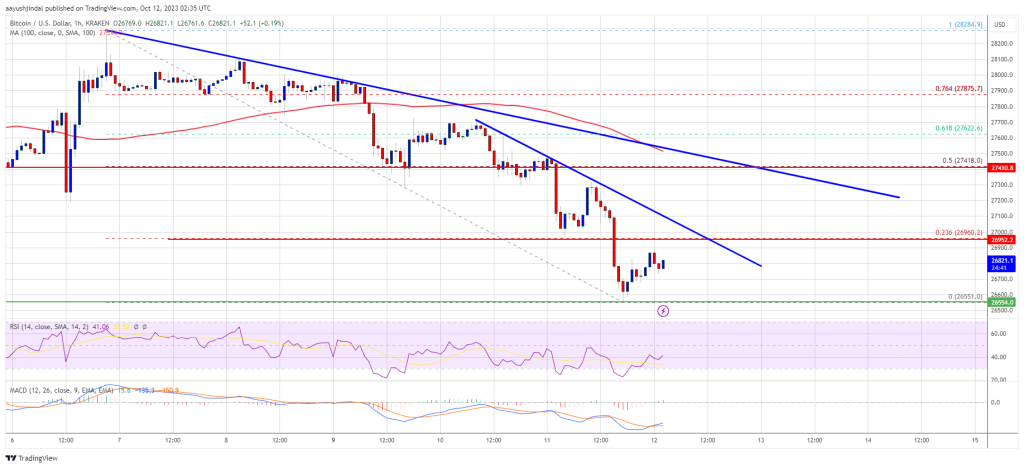
Source: BTCUSD on TradingView.com
The main hurdle is still $28,500. A close above the $28,500 resistance could start another increase. In the stated case, the price could rise toward the $30,000 resistance.
More Losses In BTC?
If Bitcoin fails to recover higher above the $27,000 resistance, there could be more losses. Immediate support on the downside is near the $26,650 level.
The next major support is near the $26,500 level. A downside break and close below the $26,500 support might send the price further lower. The next support sits at $26,000.
Technical indicators:
Hourly MACD – The MACD is now losing pace in the bearish zone.
Hourly RSI (Relative Strength Index) – The RSI for BTC/USD is now below the 50 level.
Major Support Levels – $26,650, followed by $26,500.
Major Resistance Levels – $27,000, $27,400, and $27,500.
✓ Share: