Reason to trust
![]()
Strict editorial policy that focuses on accuracy, relevance, and impartiality
Created by industry experts and meticulously reviewed
The highest standards in reporting and publishing
Strict editorial policy that focuses on accuracy, relevance, and impartiality
Morbi pretium leo et nisl aliquam mollis. Quisque arcu lorem, ultricies quis pellentesque nec, ullamcorper eu odio.
Bitcoin price started a fresh decline below the $103,000 zone. BTC is now consolidating and might struggle to recover above the $103,500 resistance.
- Bitcoin started a fresh decline below the $103,000 zone.
- The price is trading below $102,500 and the 100 hourly Simple moving average.
- There is a key bearish trend line forming with resistance at $101,250 on the hourly chart of the BTC/USD pair (data feed from Kraken).
- The pair could start a fresh increase if it stays above the $100,000 zone.
Bitcoin Price Dips Further
Bitcoin price started a fresh decline below the $105,500 zone. BTC gained pace and dipped below the $104,200 and $103,000 levels.
There was a clear move below the $102,000 support level. Finally, the price tested the $98,250 zone. A low was formed at $98,277 and the price started a consolidation phase. There was a minor recovery above the 23.6% Fib retracement level of the downward move from the $106,470 swing high to the $98,277 low.
However, the bears were active below the $101,200 zone. Bitcoin is now trading below $102,000 and the 100 hourly Simple moving average. There is also a key bearish trend line forming with resistance at $101,250 on the hourly chart of the BTC/USD pair.
On the upside, immediate resistance is near the $101,250 level. The first key resistance is near the $102,500 level or the 50% Fib retracement level of the downward move from the $106,470 swing high to the $98,277 low. The next key resistance could be $103,500.

A close above the $103,500 resistance might send the price further higher. In the stated case, the price could rise and test the $105,000 resistance level. Any more gains might send the price toward the $106,200 level.
Another Drop In BTC?
If Bitcoin fails to rise above the $102,000 resistance zone, it could start another decline. Immediate support is near the $100,150 level. The first major support is near the $98,500 level.
The next support is now near the $96,500 zone. Any more losses might send the price toward the $95,500 support in the near term. The main support sits at $95,000, below which BTC might struggle to find bids.
Technical indicators:
Hourly MACD – The MACD is now losing pace in the bearish zone.
Hourly RSI (Relative Strength Index) – The RSI for BTC/USD is now below the 50 level.
Major Support Levels – $100,150, followed by $100,000.
Major Resistance Levels – $101,250 and $103,500.
The price of Bitcoin has managed to stay afloat over the past few days despite the growing conflict in the Middle East and the ensuing bearish pressure. The premier cryptocurrency continues to hover around the $105,000 level, with its value down by merely 0.8% in the past week.
According to the latest on-chain data, the Bitcoin price might not be down for too long, as investors seem unbothered by the rising tensions between Israel and Iran. Below is what the BTC investors have been up to since the military action started in the past week.
BTC Investors Still Holding On To Their Assets: Analyst
In a Quicktake post on the CryptoQuant platform, a pseudonymous on-chain analyst, CryptoMe revealed that the Bitcoin market has remained relatively quiet despite the ongoing geopolitical events. The relevant indicators here are the Bitcoin exchange netflow and Open Interest.
To start, CryptoMe analyzed the BTC Exchange Netflow, which measures the difference between Bitcoin sent to and withdrawn from centralized exchanges. Typically, this metric helps to gauge the selling pressure on a particular cryptocurrency (Bitcoin, in this scenario).
Given that one of the services offered by exchanges is selling, exchange inflows are often considered a bearish signal for the Bitcoin price. However, CryptoMe noted that there has been no significant change in Netflow, meaning that investors are not looking to offload their assets.
The on-chain analyst also highlighted the Open Interest on centralized exchanges, which estimates the amount of capital flowing into a cryptocurrency at every given time. CryptoMe attributed the reduced Open Interest to the liquidated long positions following the price correction.

The crypto pundit added:
But when we look at the bigger picture, Open Interest still looks strong, and investors are still keeping their positions open FOR NOW despite all the WAR news.
Furthermore, CryptoMe mentioned the Bitcoin Open Interest on the Chicago Mercantile Exchange (CME), where institutions and speculators trade. The analyst noted that while some positions were closed and the Open Interest dropped after the event, there has still not been any significant exit movement on the CME.
Ultimately, the absence of major movements into centralized exchanges suggests that the investors are not in panic mode yet. While most positions on Bitcoin derivatives are still open at the moment, there is no telling what will happen if the war tension escalates further. Hence, investors might want to approach the market with caution over the next few days.
Bitcoin Price At A Glance
As of this writing, the price of BTC stands at around $104,760, reflecting an almost 1% decline in the past 24 hours.
]]>Bitcoin price failed to clear the $67,000 resistance. BTC trimmed gains and is now struggling to stay above the $63,650 support zone.
- Bitcoin started another decline after it failed to surpass the $67,200 resistance zone.
- The price is trading below $65,000 and the 100 hourly Simple moving average.
- There was a break below a key bullish trend line with support at $66,200 on the hourly chart of the BTC/USD pair (data feed from Kraken).
- The pair could correct higher, but the bears might remain active near the $65,500 zone.
Bitcoin Price Dips Again
Bitcoin price struggled to clear the $67,000 and $67,200 resistance levels. BTC formed a short-term topping pattern and started a fresh decline below the $66,000 level.
There was a move below the $65,500 support. Besides, there was a break below a key bullish trend line with support at $66,200 on the hourly chart of the BTC/USD pair. The pair even spiked below $63,650. A low was formed at $63,583 and the price is now consolidating losses.
Bitcoin price is now trading below $65,500 and the 100 hourly Simple moving average. Immediate resistance is near the $64,500 level or the 23.6% Fib retracement level of the downward move from the $67,195 swing high to the $63,583 low.
The first major resistance could be $65,350 or the 50% Fib retracement level of the downward move from the $67,195 swing high to the $63,583 low. A clear move above the $65,350 resistance might send the price higher. The next resistance now sits at $65,850. If there is a clear move above the $65,850 resistance zone, the price could continue to move up. In the stated case, the price could rise toward $67,000.
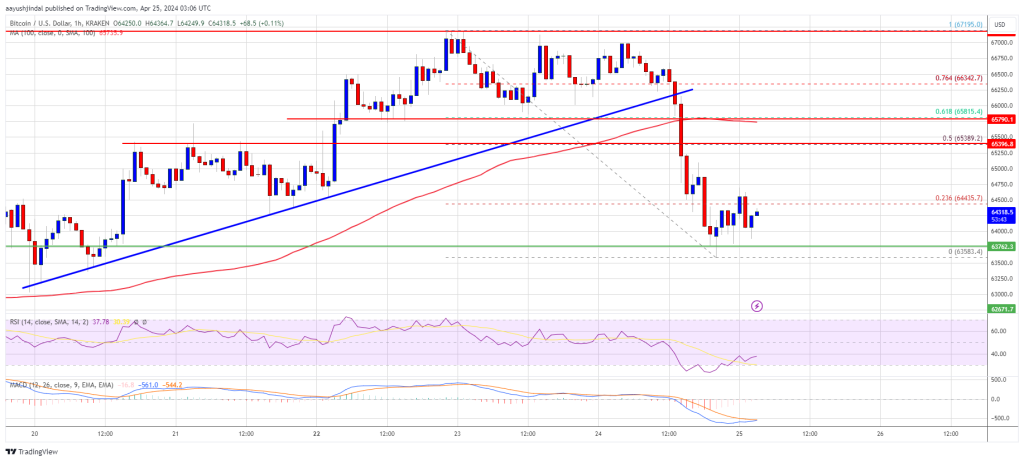
Source: BTCUSD on TradingView.com
The next major resistance is near the $67,200 zone. Any more gains might send Bitcoin toward the $68,800 resistance zone in the near term.
More Losses In BTC?
If Bitcoin fails to rise above the $65,350 resistance zone, it could continue to move down. Immediate support on the downside is near the $63,500 level.
The first major support is $62,600. If there is a close below $62,600, the price could start to drop toward $61,200. Any more losses might send the price toward the $60,000 support zone in the near term.
Technical indicators:
Hourly MACD – The MACD is now losing pace in the bearish zone.
Hourly RSI (Relative Strength Index) – The RSI for BTC/USD is now below the 50 level.
Major Support Levels – $63,500, followed by $62,600.
Major Resistance Levels – $65,350, $65,850, and $67,000.
Disclaimer: The article is provided for educational purposes only. It does not represent the opinions of NewsBTC on whether to buy, sell or hold any investments and naturally investing carries risks. You are advised to conduct your own research before making any investment decisions. Use information provided on this website entirely at your own risk.
Bitcoin price is slowly moving lower below the $19,200 support against the US Dollar. BTC could slide further if there is further escalation in Russia-Ukraine war situation.
- Bitcoin is slowly moving lower below the $19,200 and $19,000 levels.
- The price is trading below above $19,500 and the 100 hourly simple moving average.
- There is a connecting bearish trend line forming with resistance near $19,260 on the hourly chart of the BTC/USD pair (data feed from Kraken).
- The pair could continue to move down if there is a clear move below the $18,920 support.
Bitcoin Price Slides
Bitcoin price remained in a bearish zone below the $20,000 support zone. BTC slowly moved and settled below the $19,500 support plus the 100 hourly simple moving average.
There was a clear move below the $19,200 support zone, increasing pressure on the bulls. Finally, the price moved below the $19,000 level and traded as low as $18,970. The price is now consolidating losses near the $19,000 pivot level.
Bitcoin price is trading below above $19,500 and the 100 hourly simple moving average. There is also a connecting bearish trend line forming with resistance near $19,260 on the hourly chart of the BTC/USD pair.
On the upside, an immediate resistance is near the $19,110 level. It is near the 23.6% Fib retracement level of the recent decline from the $19,559 swing high to $18,970 low. The next major resistance sits near the $19,260 zone and the trend line.
The trend line is close to the 50% Fib retracement level of the recent decline from the $19,559 swing high to $18,970 low. A clear move above the trend line might send the price towards the $19,500 resistance or the 100 hourly simple moving average.
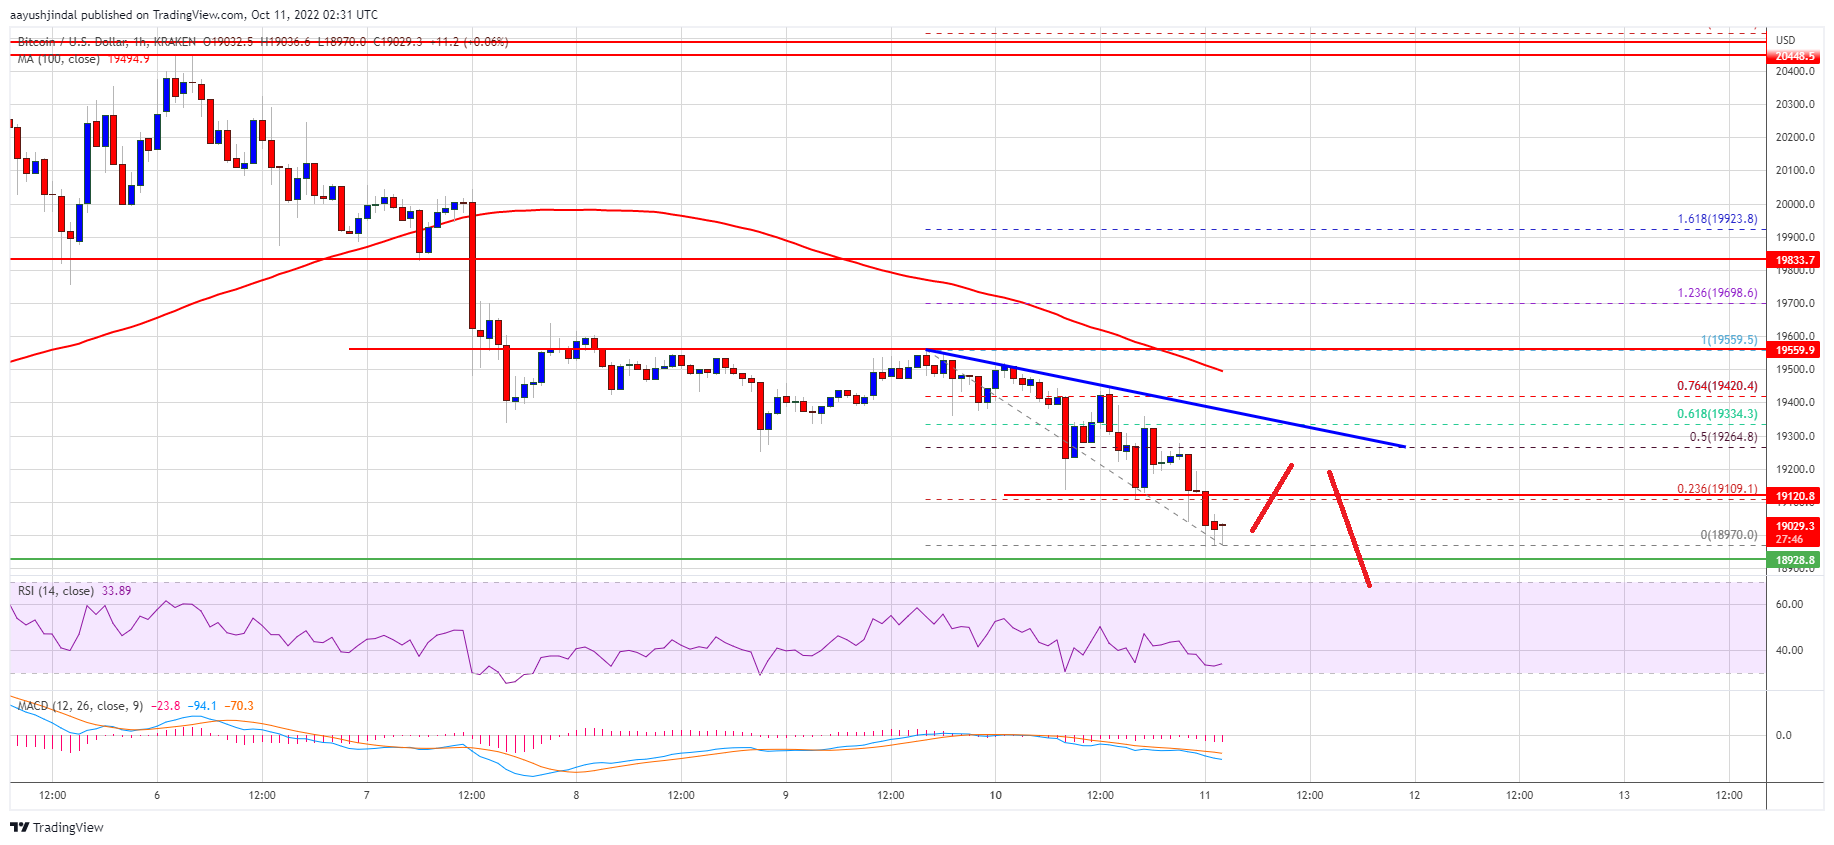
Source: BTCUSD on TradingView.com
Any more gains might send the price above the $19,600 resistance. In the stated case, the price could rise towards the $20,000 resistance level.
More Losses in BTC?
If bitcoin fails to rise above the $19,260 resistance zone, it could continue to move down. An immediate support on the downside is near the $19,000 zone.
The next major support is near the $18,920 zone. A downside break below the $18,920 support zone might call for more losses. In the stated case, there is a risk of a move towards the $18,500 support zone.
Technical indicators:
Hourly MACD – The MACD is now gaining pace in the bearish zone.
Hourly RSI (Relative Strength Index) – The RSI for BTC/USD is now below the 50 level.
Major Support Levels – $19,000, followed by $18,500.
Major Resistance Levels – $19,260, $19,500 and $20,000.