Shiba Inu Price Prediction: SHIB Signals Shift as 82.5 Billion Tokens Exit Exchanges Coinpaper
Source link ]]>

Ethereum is testing resistance as the market finds some relief. The price is at a decision point. And a CryptoQuant analyst has identified a supply structure beneath that resistance that has no precedent in the current cycle — and a clear one in the cycle that preceded it.
The analyst’s data reveals a 57% collapse in Ethereum’s exchange supply: reserves have fallen from approximately 35 million ETH to 14.9 million ETH — a reduction that leaves significantly less ETH available for immediate sale than at any comparable point during the 2020-2021 period. The coins have not disappeared. They have moved into the custody of holders who are not sending them to exchanges to sell.

The inflow data confirms the behavioral picture. Exchange inflows have increased recently — but the scale remains dramatically below the peaks of the 2021-2022 cycle top, when inflows approached the 10 to 20 million ETH range. The current clusters are a fraction of those peaks. Large-scale distribution — the kind that characterized the previous cycle’s top — is not present in the data.
Ethereum testing resistance with 57% less sellable supply than its previous cycle peak, and without the distribution behavior that accompanied that peak, is a structurally different test. The overhead exists. The ammunition to sustain it is historically thin.
Two Signals. One Conclusion
The analyst’s framework rests on the relationship between two independent data points that are currently moving in a configuration that has historically mattered. The first is what has happened to exchange reserves: a 57% collapse that has removed the majority of ETH’s immediately available sell-side supply from the market.
The second is what has not happened to exchange inflows: the extreme deposit spikes — 10 to 20 million ETH ranges — that characterized the 2021-2022 distribution phase have not returned. Holders are not flooding exchanges with ETH to take profit or cut losses at scale.

That combination — supply depleted, distribution absent — describes a market where the structural pressure for downside has been significantly reduced without the structural signal of panic that typically accompanies cycle bottoms at their most acute. The market is not experiencing forced selling at a scale that matches previous major lows. It is experiencing quiet.
The price context adds the final dimension. Ethereum is currently moving near the lows of previous correction ranges — the price levels that, in prior cycles, represented the zone where the risk-reward balance shifted in favor of patient capital rather than continued selling.
The analyst names this carefully: a constructive signal under current conditions. Not a confirmation. Not a guarantee. A structural alignment between depleted supply, absent distribution pressure, and historically significant price levels that, taken together, describes a market where the conditions for recovery are present even if the catalyst has not yet arrived.
Ethereum Reclaims Weekly Pivot as Recovery Tests Structure
Ethereum is trading near $2,350–$2,400 on the weekly timeframe, reclaiming a key pivot level that has repeatedly acted as both support and resistance throughout the current cycle. After the sharp drawdown earlier in 2026, ETH has staged a recovery from the $1,600–$1,800 region, where strong demand emerged and halted the decline.
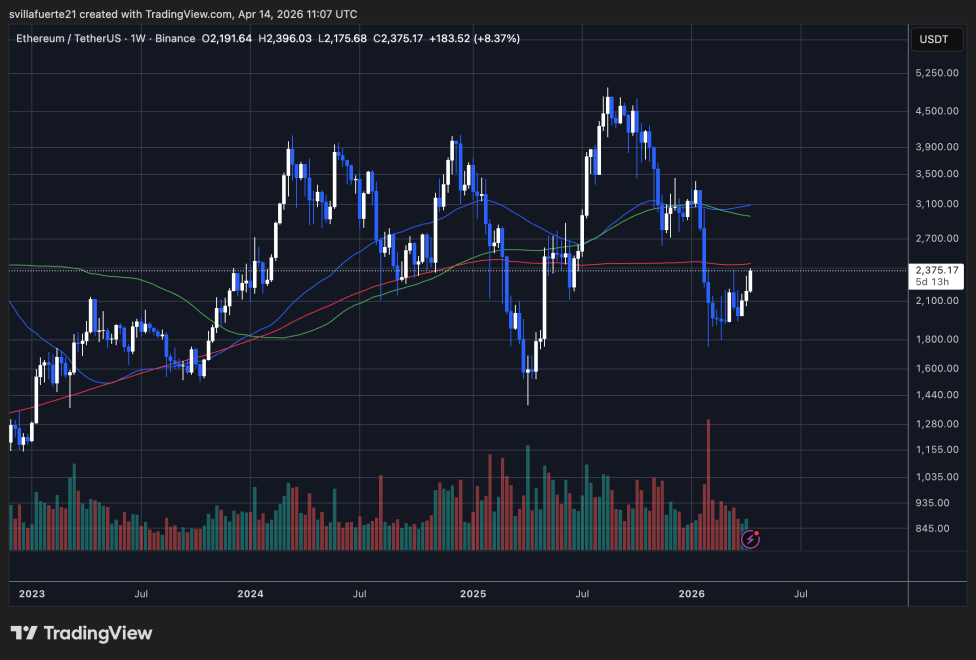
The current structure reflects a market attempting to transition back toward equilibrium. Price is now interacting with the 100-week (green) and 200-week (red) moving averages, which are converging near the $2,300 zone. This area represents a critical technical threshold: reclaiming it suggests stabilization, while failure would reinforce the broader corrective trend.
The 50-week moving average (blue) is flattening and beginning to turn upward, indicating improving short-term momentum. However, ETH has not yet established a clear higher high on the weekly timeframe, which keeps the recovery unconfirmed.
Volume patterns remain consistent with a post-capitulation environment. The spike during the sell-off indicates forced liquidations, while the subsequent normalization suggests reduced stress but not strong accumulation.
Structurally, Ethereum is at a decision point. Sustained acceptance above $2,400 would open the path toward $2,800–$3,100, while rejection would likely return price toward the $2,000 support zone.
Featured image from ChatGPT, chart from TradingView.com
Editorial Process for bitcoinist is centered on delivering thoroughly researched, accurate, and unbiased content. We uphold strict sourcing standards, and each page undergoes diligent review by our team of top technology experts and seasoned editors. This process ensures the integrity, relevance, and value of our content for our readers.
Shiba Inu Nears Top 30 Exit as Rivals Close In Cryptonews.net
Source link ]]>
Shiba Inu nears top 30 exit as market competition intensifies Coinpaper
Source link ]]>
Bitcoin, Ethereum, XRP, Dogecoin Spike Amid Trump’s Iran Exit Signal: Analytics Firm Highlights ‘Best’ Pl benzinga.com
Source link ]]>
Binance’s XRP Reserve Signals Demand, Shiba Inu Shorts Exit, Dogecoin Key Metric Turns Bullish — U.Today Crypto Digest TradingView
Source link ]]>
Shiba Inu (SHIB) Sees Shorts Exit in 4 Hours While Price Eyes Recovery mexc.co
Source link ]]>
Shiba Inu (SHIB) Sees Shorts Exit in 4 Hours While Price Eyes Recovery Cryptonews.net
Source link ]]>
Tom Lee used a Hong Kong conference stage to argue that Ethereum may be close to a cyclical turn, pointing to historical market analogs and on-chain cost-basis data that, in his view, suggest the selloff has reached exhaustion.
Speaking at the 3rd Futu Expo 2026 in Hong Kong on March 13–14, Lee said Bitmine advisor Tom DeMark had identified a striking resemblance between Ethereum’s recent price action and two major S&P 500 declines: the 1987 crash and the 2011 selloff. Lee described the setup as unusually tight.
Is The Ethereum Bottom In?
“Tom DeMark, he’s a legendary market timer, and he’s provided an analysis to us that says Ethereum, in the last few months, especially since October, is really mirroring what happened to the S&P 500 in 2011 and what happened to the S&P 500 in 1987,” Lee said. “If you were involved in US markets, both times marked major declines in the S&P. Well, according to him, there’s a 93% correlation to what Ethereum’s doing today to what the S&P did in 1987.”
Related Reading
That comparison is doing a lot of work in Lee’s argument. If the 1987 analog holds, he said, Ethereum would have already bottomed on March 7. If the 2011 comparison is the better fit, the market is bottoming now. In either case, Lee’s conclusion was the same: “So using his analysis, we think we’re at the bottom or exiting the crypto winter now.”
He did not leave the case resting on chart symmetry alone. Lee also pointed to Ethereum’s realized price, the on-chain metric that estimates the average acquisition cost of coins based on their last movement on the blockchain. In his telling, that figure now sits at $2,241 for ETH, giving investors a way to judge how deeply underwater the average holder has become.
Lee said the pattern at prior lows is revealing. In 2022, Ethereum fell to a 39% discount to realized price. In 2025, the discount reached 21% before ETH turned higher. “Currently, we’re at 22%,” he said, adding that the market is now sitting in roughly the same zone where last year’s reversal began. “So we’re at the level where in 2025, Ethereum started to turn higher.”
Related Reading
In other words, Lee’s thesis is that Ethereum does not need a pristine macro backdrop or a fresh narrative cycle to stabilize; it only needs to revisit the kind of holder pain that has historically marked exhaustion. By his measure, that threshold is already here.
TOM LEE:
THE ETHEREUM BOTTOM IS INBitmine x TOM DEMARK mapped ETH against past S&P 500 crash recoveries.
The structure now closely matches 1987 and 2011, both major cycle bottoms.
93% correlation to 1987
— BMNR Bullz (@BMNRBullz) March 19, 2026

He also tried to zoom out from the immediate drawdown and re-anchor ETH in a longer time horizon. “Before you lose any hope, keep in mind that over the last 10 years, Ethereum has outperformed every other asset class over the past decade,” Lee said. “In the last 10 years, Ethereum’s return is 49,000%. That means almost 490 times your money.”
Lee contrasted that with Bitcoin’s 11,000% gain over the same span and even with Nvidia, which he called “the single best stock in the US,” saying it had returned 65 times investors’ money.
At press time, ETH traded at $2,147.

Featured image created with DALL.E, chart from TradingView.com
Whales Exit as ADA Open Interest Hits 2-Month Low: Is a Cardano Bottom Near $0.25? 99Bitcoins
Source link ]]>