Bitcoin price started a recovery wave above the $75,000 zone. BTC is consolidating and might aim for more gains if it clears the $77,350 resistance zone.
- Bitcoin managed to form a base above $74,500 and started a recovery wave.
- The price is trading above $75,500 and the 100 hourly simple moving average.
- There is a rising channel forming with resistance at $77,350 on the hourly chart of the BTC/USD pair (data feed from Kraken).
- The pair might gain bullish momentum if it settles above the $77,500 zone.
Bitcoin Price Regains Traction
Bitcoin price remained supported above the $74,000 zone. BTC formed a base and settled above $74,500 to start a recovery wave. There was a move above the $75,000 and $75,500 levels.
The bulls were able to push the price above the 61.8% Fib retracement level of the downward move from the $78,344 swing high to the $73,637 low. There is also a rising channel forming with resistance at $77,350 on the hourly chart of the BTC/USD pair.
Bitcoin is now trading above $75,500 and the 100 hourly simple moving average. If the price remains stable above $75,000, it could attempt a fresh increase. Immediate resistance is near the $77,250 level and the 76.4% Fib retracement level of the downward move from the $78,344 swing high to the $73,637 low.
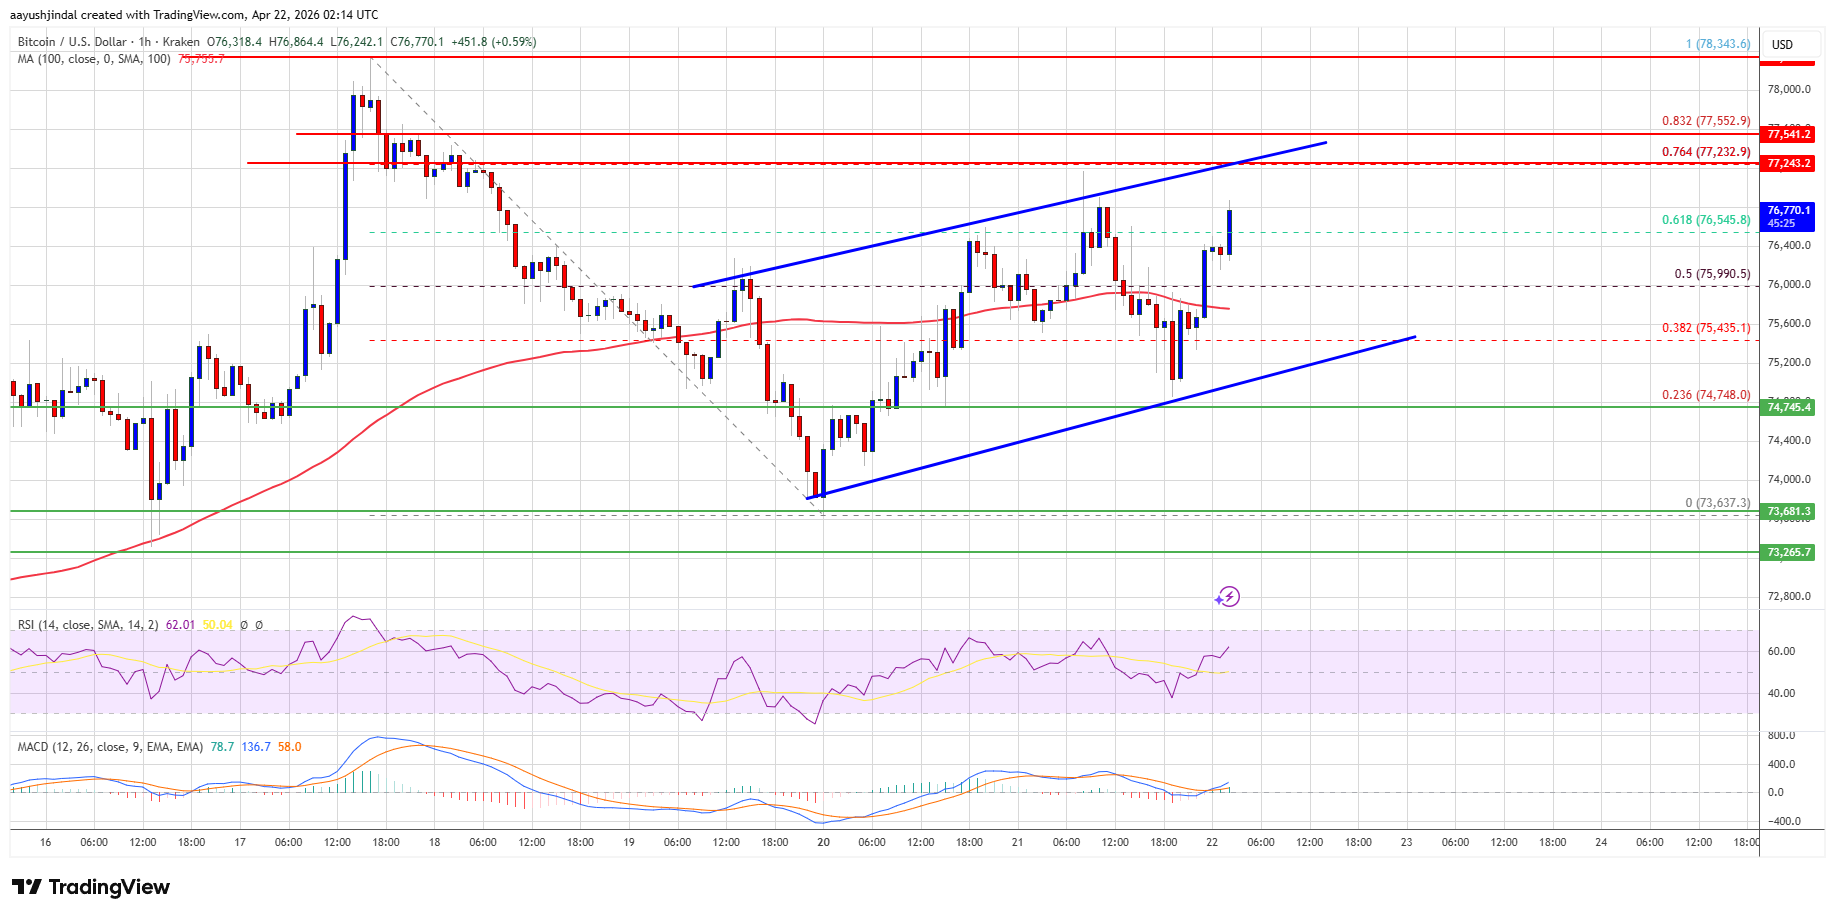
The first key resistance is near the $77,350 level. A close above the $77,350 resistance might send the price further higher. In the stated case, the price could rise and test the $78,000 resistance. Any more gains might send the price toward the $78,500 level. The next barrier for the bulls could be $80,000.
Another Decline In BTC?
If Bitcoin fails to rise above the $77,350 resistance zone, it could start another decline. Immediate support is near the $76,000 level.
The first major support is near the $75,650 level. The next support is now near the $75,400 zone. Any more losses might send the price toward the $74,250 support in the near term. The main support now sits at $73,200, below which BTC might struggle to recover in the near term.
Technical indicators:
Hourly MACD – The MACD is now gaining pace in the bullish zone.
Hourly RSI (Relative Strength Index) – The RSI for BTC/USD is now above the 50 level.
Major Support Levels – $76,000, followed by $75,400.
Major Resistance Levels – $77,250 and $78,000.
Dogecoin Price Prediction: DOGE Hashrate Reaches ATH As Bulls Eye $0.1028 Breakout Bitget
Source link ]]>
Ethereum price started a fresh decline and traded below $2,350. ETH is now consolidating above $2,250 and might struggle to recover.
- Ethereum started a downside correction from the $2,465 zone.
- The price is trading below $2,350 and the 100-hourly Simple Moving Average.
- There is a bearish trend line forming with resistance at $2,300 on the hourly chart of ETH/USD (data feed via Kraken).
- The pair could start a fresh increase if it stays above the $2,250 zone.
Ethereum Price Dips Again
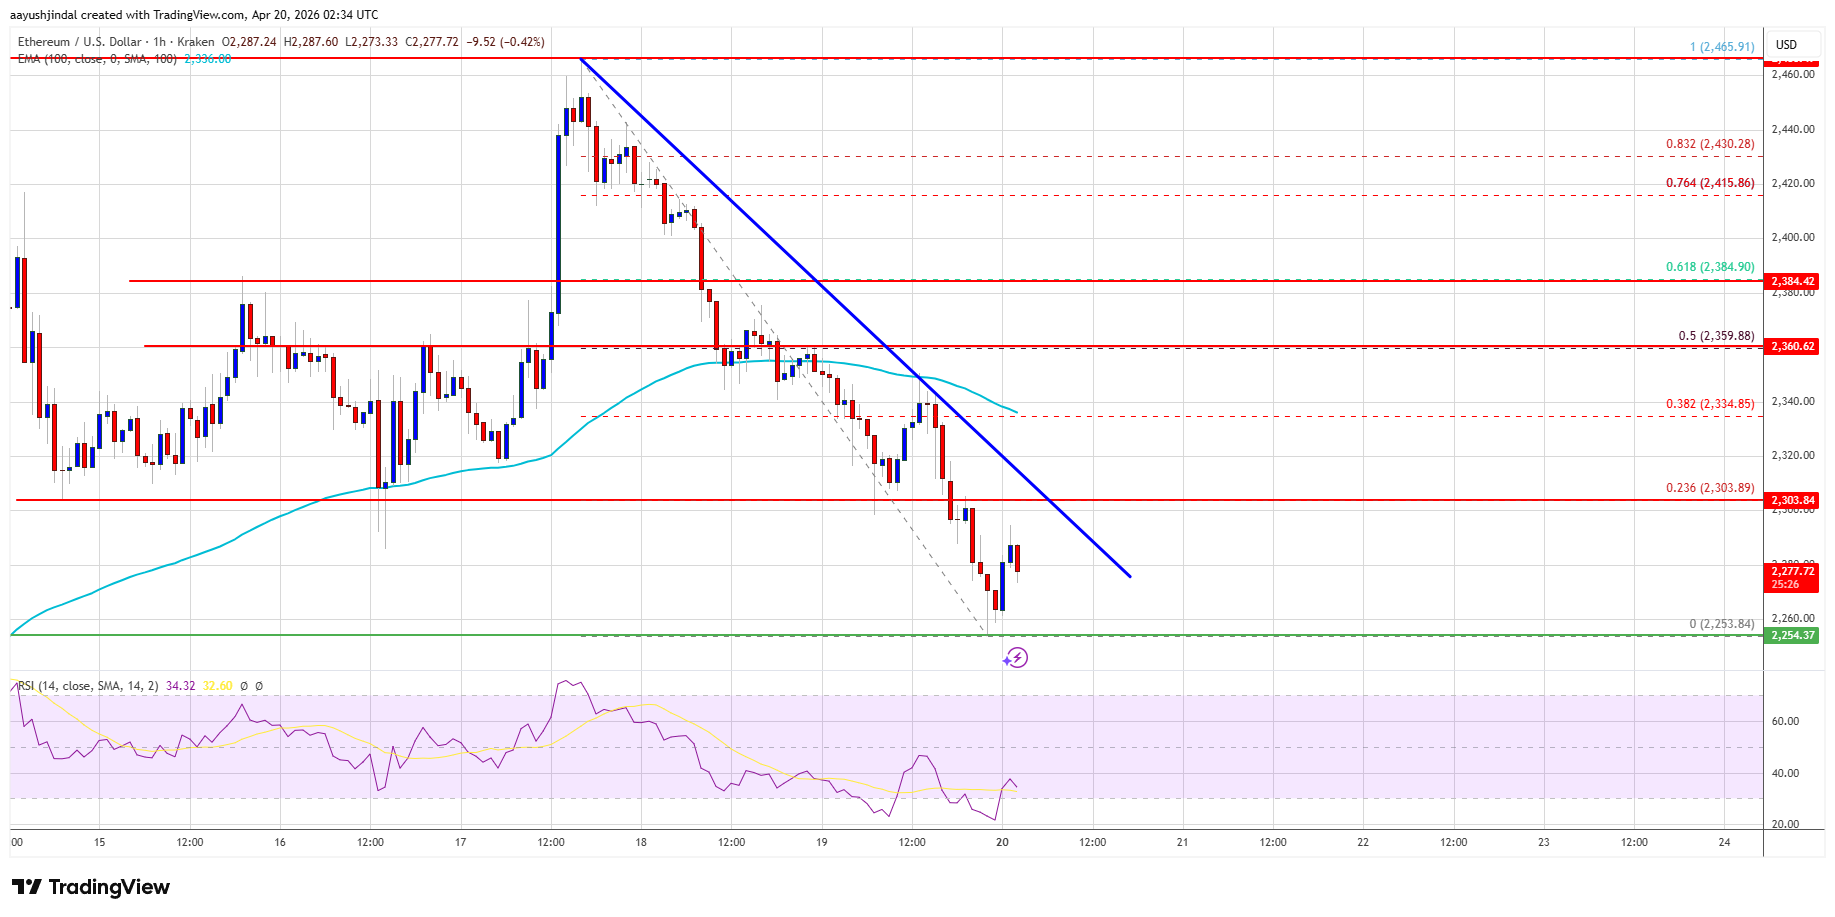
Ethereum price failed to remain stable above $2,420 and started a downside correction, like Bitcoin. ETH price dipped below the $2,400 and $2,350 levels.
The pair traded as low as $2,253, and is currently consolidating losses below the 23.6% Fib retracement level of the downward move from the $2,465 swing high to the $2,253 low. There is also a bearish trend line forming with resistance at $2,300 on the hourly chart of ETH/USD.
Ethereum price is now trading below $2,350 and the 100-hourly Simple Moving Average. If the bulls remain in action above $2,250, the price could attempt another increase. Immediate resistance is seen near the $2,300 level and the trend line.
The first key resistance is near the $2,335 level. The next major resistance is near the $2,360 level or the 50% Fib retracement level of the downward move from the $2,465 swing high to the $2,253 low.
A clear move above the $2,360 resistance might send the price toward the $2,415 resistance. An upside break above the $2,415 region might call for more gains in the coming days. In the stated case, Ether could rise toward the $2,465 resistance zone or even $2,500 in the near term.
Another Decline In ETH?
If Ethereum fails to clear the $2,360 resistance, it could start a fresh decline. Initial support on the downside is near the $2,250 level. The first major support sits near the $2,220 zone.
A clear move below the $2,220 support might push the price toward the $2,200 support. Any more losses might send the price toward the $2,150 region. The main support could be $2,120.
Technical Indicators
Hourly MACD – The MACD for ETH/USD is gaining momentum in the bearish zone.
Hourly RSI – The RSI for ETH/USD is now below the 50 zone.
Major Support Level – $2,250
Major Resistance Level – $2,360
Cardano Price Prediction 2026: ADA and AVAX Eye Cycle Gains NFT Plazas
Source link ]]>
Ethereum (ETH), the world’s largest altcoin, is up by over 3% in the past day, reflecting the current bullish momentum in the cryptocurrency market following the major relief over the US-Iran conflict. Notably, Iran’s Foreign Minister Abbas Araghchi announced that the Strait of Hormuz would be opened to commercial ships for the remainder of the 10-day ceasefire between the warring states.
This positive development soon triggered a drop in oil prices, improving macroeconomic conditions and driving significant inflows into global financial markets, including risk assets such as Ethereum. According to renowned analyst Ali Martinez, Ethereum has benefited significantly from this shift, successfully flipping a key price resistance level during its market recovery.
Ethereum Moves To Validate Major Ascending Triangle Formation
An ascending triangle is a bullish chart pattern used in technical analysis that signals a potential continuation of an uptrend. Here, price repeatedly makes higher lows while also repeatedly hitting a horizontal resistance without breaking above it. When the price finally breaks above the resistance level, it often leads to a strong upward move.
In an X post on April 17, Ali Martinez explains that Ethereum has broken through the $2,385 critical barrier, which represented the resistance line of a major ascending triangle that has been forming since February. In a previous post on April 14, the seasoned analyst noted that the TD Sequential indicator had issued a sell signal around this level, an event that triggered a price correction when ETH last reached around $2,400, despite positive signs such as the initial reclamation of the 100-day SMA.
Ethereum $ETH opens the path to $2,900!
Ethereum has officially cleared the X-axis of its ascending triangle, breaking through the critical $2,385 resistance level.
This breakout is a significant structural shift. By flipping $2,385 into a support floor, ETH has neutralized the… https://t.co/NLesHeyzQH pic.twitter.com/Pi0H5ypcts
— Ali Charts (@alicharts) April 17, 2026
However, following the recent gain above this resistance zone, Martinez claims the bearish TD Sequential signal has been nullified, with the altcoin now primed to reach higher targets. With $2,385 now a support level, the analyst explains that Ethereum’s major technical target lies at $2,900. However, immediate resistance lies around $2,721, indicating an additional price surge of at least 12% in the short term. However, Martinez warns that this bullish outlook is only valid as long as Ethereum maintains its new support zone. A retracement below $2,385 would rouse market uncertainty and strengthen bearish sentiments.
Ethereum Price Overview
At the time of writing, Ethereum trades at $2,420, up 3.43% in the last 24 hours. The altcoin is also up by 9.93% on its monthly chart, underscoring its underlying bullish momentum. However, Ethereum remains deep in bearish territory, down 51% from its all-time high of $4,955 in August 2025.
]]>Dogecoin started a decent increase above $0.0950 against the US Dollar. DOGE is now consolidating and might aim for an upside break above $0.10.
- DOGE price started a fresh increase above $0.0950 and $0.0975.
- The price is trading above the $0.0965 level and the 100-hourly simple moving average.
- There is a bullish trend line forming with support at $0.0970 on the hourly chart of the DOGE/USD pair (data source from Kraken).
- The price could aim for a fresh increase if it remains stable above $0.0950.
Dogecoin Price Aims Higher
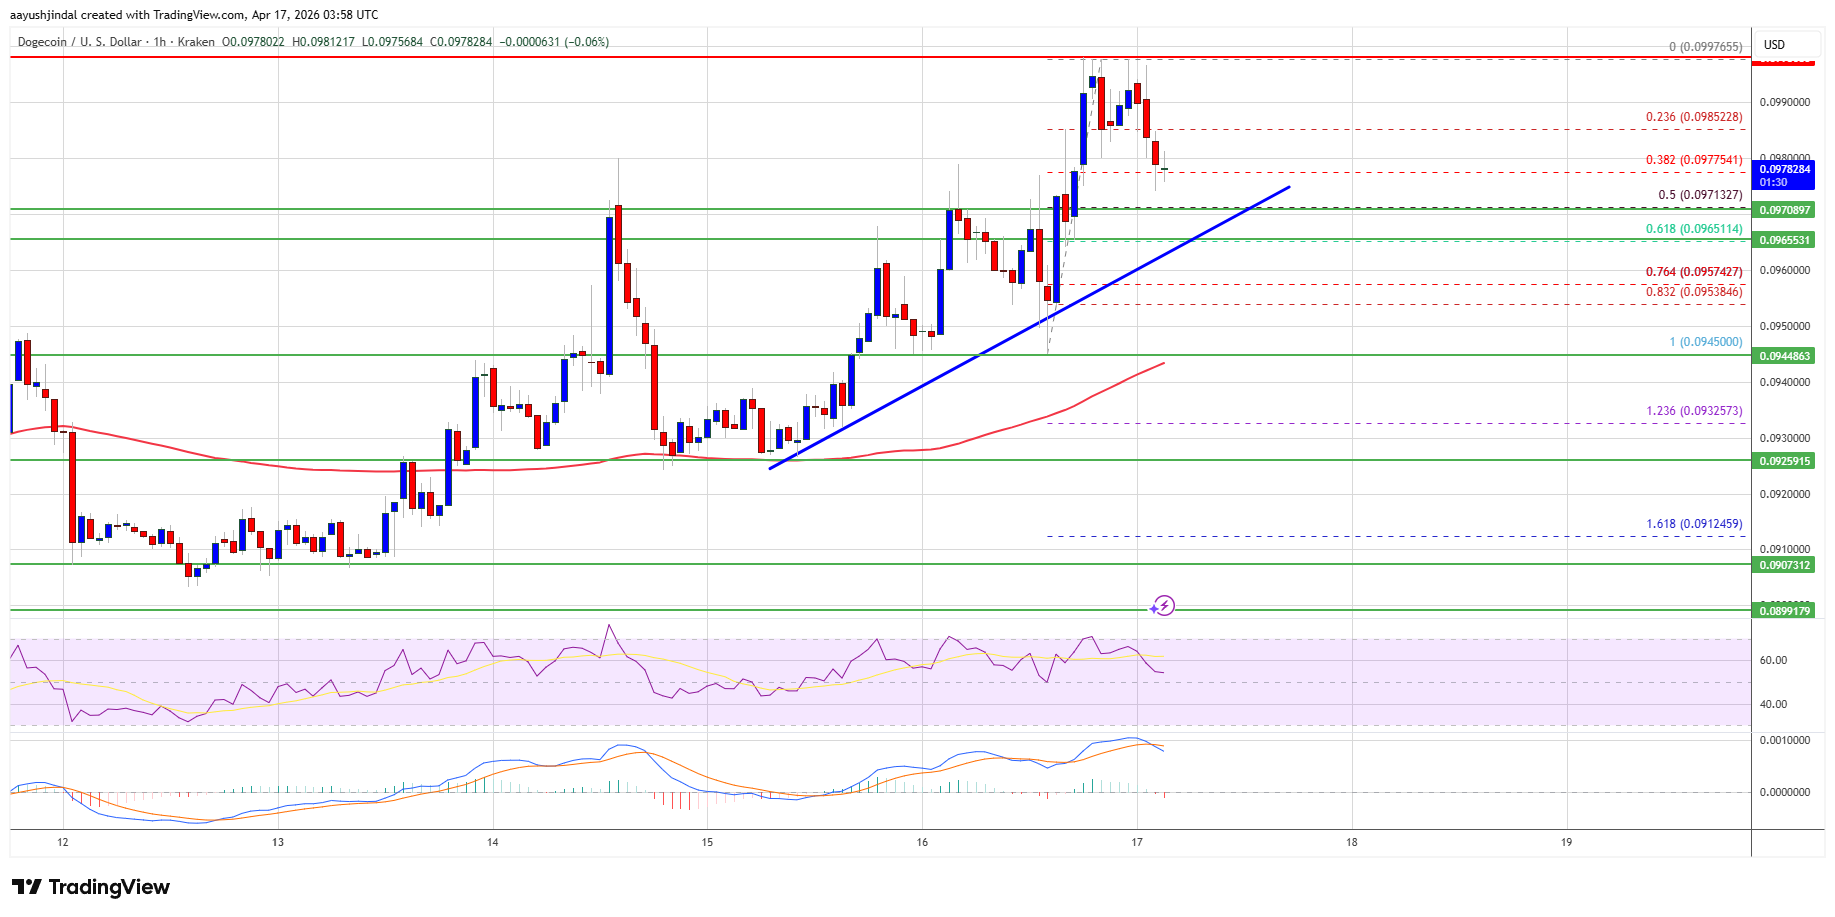
Dogecoin price started a fresh increase after it settled above $0.0950, like Bitcoin and Ethereum. DOGE climbed above the $0.09650 resistance to enter a positive zone.
The bulls were able to push the price above $0.0980. A high was formed at $0.0997 and the price is now correcting some gains. There was a move below the 23.6% Fib retracement level of the upward move from the $0.0945 swing low to the $0.0997 high.
Dogecoin price is now trading above the $0.0965 level and the 100-hourly simple moving average. There is also a bullish trend line forming with support at $0.0970 on the hourly chart of the DOGE/USD pair.
If there is another increase, immediate resistance on the upside is near the $0.0990 level. The first major resistance for the bulls could be near the $0.0995 level.
The next major resistance is near the $0.10 level. A close above the $0.10 resistance might send the price toward $0.1120. Any more gains might send the price toward $0.1150. The next major stop for the bulls might be $0.120.
Another Decline In DOGE?
If DOGE’s price fails to climb above the $0.10 level, it could start a downside correction. Initial support on the downside is near the $0.0970 level and the trend line. The next major support is near the $0.0965 level or the 61.8% Fib retracement level of the upward move from the $0.0945 swing low to the $0.0997 high.
The main support sits at $0.0945. If there is a downside break below the $0.0945 support, the price could decline further. In the stated case, the price might slide toward the $0.0905 level or even $0.090 in the near term.
Technical Indicators
Hourly MACD – The MACD for DOGE/USD is now losing momentum in the bullish zone.
Hourly RSI (Relative Strength Index) – The RSI for DOGE/USD is now above the 50 level.
Major Support Levels – $0.0970 and $0.0965.
Major Resistance Levels – $0.0995 and $0.1000.
]]>Dogecoin (DOGE) Price Prediction: X Money Beta Launch Targets 600M Users as Analysts Eye $0.118 Range openPR.com
Source link ]]>
Dogecoin Price Holds Steady Amid Broader Crypto Market Volatility as U.S. Investors Eye Memecoin Sen AD HOC NEWS
Source link ]]>
Dogecoin Price Holds Steady Amid Broader Crypto Market Volatility as U.S. Investors Eye Meme Coin Ro AD HOC NEWS
Source link ]]>
Dogecoin Price Holds Steady Amid Broader Crypto Market Pullback as U.S. Investors Eye Memecoin Resil AD HOC NEWS
Source link ]]>