After the bearish price action that began over the last weekend, Bitcoin has left some unfilled gaps open that could point to where the price is headed next. With two Fair Value Gaps (FVGs) yet to be filled, according to crypto analyst TehThomas, investors should expect a wave of uncertain movement in either direction. This is because Bitcoin needs to clear multiple liquidity levels before it is finally in a position to make a clean breakout.
The Two FVGs Holding The Bitcoin Price Down
In the analysis, Thomas explains that Bitcoin has created fair value gaps both above and below the current support level. The first of these lies above $117,000 and is expected to be the first to be filled. This position holds a lot of liquidity, and it is likely that this upper imbalance will be targeted first. Such a move would trigger stop losses and trap late longs who are tricked into buying the breakout.
However, this Bitcoin breakout is not expected to last for long since only one FVG will have been filled at this level. The next FVG is way below the recent lows recorded at the start of August, sitting just above $111,000. The crypto analyst expects that a retracement from the breakout will push it back down to this level. This decline is, in itself, bullish as it will fill the imbalance at a point where there is a lot of demand.
Just like the sweep upward above $117,000, the retracement to $111,000 is expected to clear internal liquidity. This will provide a clean slate from the compressing structure that the Bitcoin price has been trading within and could be the start of the next major move upward.
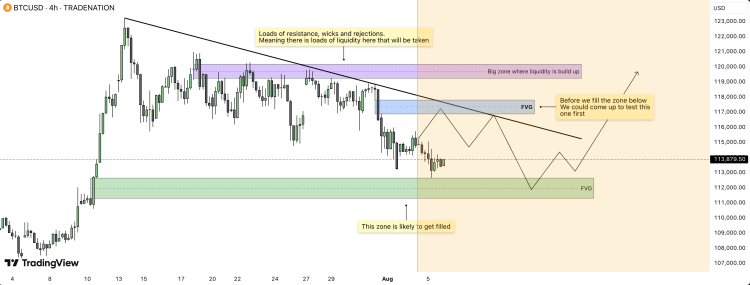
What’s Next After Internal Liquidity Is Cleared?
Once this move is in motion, the analyst points to the descending trendline as the next important formation on the Bitcoin price chart. For the price to continue upward, Thomas explains that Bitcoin would have to react from the upper imbalance of the trendline before falling back lower. This is the level that would determine confirmation for the next move.
With internal liquidity also completely cleared at the end of the trend, Bitcoin is expected to have a “clean position to rally.” Targets would be the liquidity build-up at the previous wicks and area of rejection, which pushes all the way up toward $120,000. “This would complete the full cycle of imbalance fill, liquidity grab, and directional expansion,” Thomas said. However, he also added that “Price is unlikely to sustain a move higher until both zones have been addressed.”
]]>Shiba Inu (SHIB) Price: Retail Investors Fill Void Left by Whale Exodus CoinCentral
Source link ]]>
Reason to trust
![]()
Strict editorial policy that focuses on accuracy, relevance, and impartiality
Created by industry experts and meticulously reviewed
The highest standards in reporting and publishing
Strict editorial policy that focuses on accuracy, relevance, and impartiality
Morbi pretium leo et nisl aliquam mollis. Quisque arcu lorem, ultricies quis pellentesque nec, ullamcorper eu odio.
Ethereum is facing renewed downward selling pressure, with the entire crypto market entering a fresh downtrend in the past 24 hours. This renewed selling pressure has seen the Ethereum price lose a strong support level at $1,800, causing it to fall by about 14.5% from its price 24 hours ago at the time of writing.
The trading trend shows that the Ethereum price is about to break below $1,500, with one analyst even suggesting a potential break to $1,000. Yet, despite the sharp decline, technical patterns suggest the possibility of Ethereum revisiting much higher price levels upwards to $3,933, specifically to fill multiple CME futures gaps that are still open above.
Ethereum Breaks Below Key Support, Larger Breakdown Ahead
The loss of the $1,800 support has strengthened the bear case for Ethereum, especially amid broader weakness in the altcoin market. One of the more blunt takes comes from crypto analyst Andrew Kang, who argued that the price of Ethereum is actually overvalued. He described Ethereum’s $215 billion market cap as “ridiculous” for what he calls a “negative growth/profitability asset.”
Related Reading
According to Kang, the momentum of speculative winds that used to ignite Ethereum’s price surge has run dry, and a revisit of the $1,000 to $1,500 zone is not only likely but overdue. What adds weight to Kang’s warning is how quickly the market appears to have validated his concerns.
Since his statement, Ethereum’s market cap has dropped significantly, sliding to $186.5 billion at the time of writing. Although the decline is due to other market factors, the pace and depth of this decline suggest that investor confidence in Ethereum may be lower than expected, with no immediate signs of reversal in sight. If bearish pressure continues, Ethereum could soon find itself trading at the lower end of Kang’s projected range at $1,000.
CME Gaps Above $2,500 Offer A Technical Outlook For Rebound
Even as price action trends lower, Ethereum’s CME futures chart tells a different story. Titan of Crypto pointed out that three distinct CME gaps are unfilled above the current market level. These include a gap between $2,550 and $2,625, another between $2,890 and $3,050, and a partially filled third gap between $3,917 and $3,933.
Related Reading
The CME gap theory is rooted in the observation that asset prices often return to fill these voids, even if the move takes weeks or months. In the case of Ethereum, the odds of a return to the CME gaps are very low in the short term.
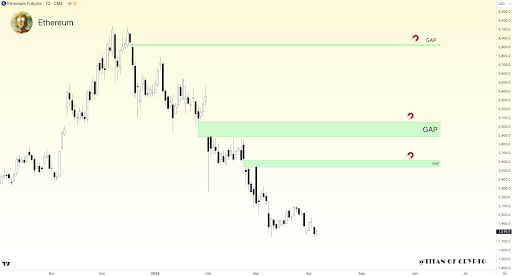
However, considering Q2 2025 is only just starting, there is still enough time to witness the buying pressure needed to fill these levels before the end of the year. At the time of writing, Ethereum is trading at $1,540, down by 14.5% in the past 24 hours.
Featured image from Unsplash, chart from Tradingview.com
China’s Intchains scrambling to fill Dogecoin rig orders after Trump, Musk boost The Block
Source link ]]>
ADA picks up as whales fill bags with TRX and DTX for major gains crypto.news
Source link ]]>
Dogecoin Whales Fill Up Bags As DOGE Price Dips 5% NewsBTC
Source link ]]>
Emurgo to invest and fill 21 areas ‘missing’ from Cardano — CEO Cointelegraph
Source link ]]>
Bitcoin price is slowly moving higher above $26,000. BTC is showing signs of recovery but is still struggling to clear the $26,500 resistance zone.
- Bitcoin is up 2% and trading above the $26,000 resistance zone.
- The price is trading well above $26,000 and the 100 hourly Simple moving average.
- There was a break above a key bearish trend line with resistance near $25,940 on the hourly chart of the BTC/USD pair (data feed from Kraken).
- The pair could struggle to clear the $26,500 and $26,750 resistance levels.
Bitcoin Price Avoids Downside Break
Bitcoin price managed to stay above the $25,350 support zone. BTC bulls protected a major downside break and pushed the price above the $25,850 resistance.
There was a move above the $26,000 resistance zone. Besides, there was a break above a key bearish trend line with resistance near $25,940 on the hourly chart of the BTC/USD pair. The pair even climbed toward the $26,500 resistance zone where the bears appeared.
A high is formed near $26,487 and the price is now consolidating gains. It traded below the 23.6% Fib retracement level of the recent increase from the $25,609 swing low to the $26,487 high.
Bitcoin is now trading well above $26,000 and the 100 hourly Simple moving average. Immediate resistance on the upside is near the $26,400 level. The first major resistance is near the $26,500 level. A proper close above the $26,500 level might start a decent increase.
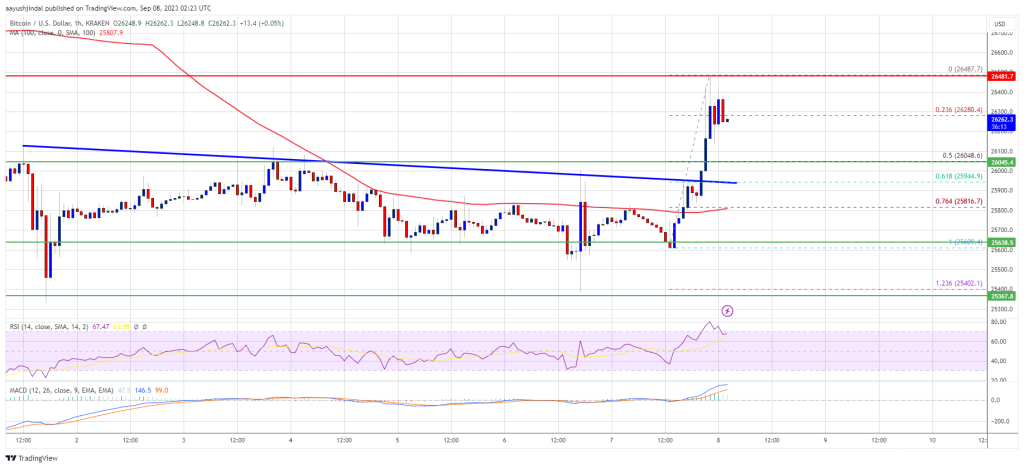
Source: BTCUSD on TradingView.com
The next major resistance is near $27,000, above which the bulls could gain strength. In the stated case, the price could test the $28,000 level.
Are Dips Now Limited In BTC?
If Bitcoin fails to clear the $26,500 resistance, it could start a downside correction. Immediate support on the downside is near the $26,100 level.
The next major support is near the $26,000 level or the 50% Fib retracement level of the recent increase from the $25,609 swing low to the $26,487 high. A downside break and close below the $26,000 level might increase selling pressure. In the stated case, the price could drop toward $25,500 or even $25,350.
Technical indicators:
Hourly MACD – The MACD is now losing pace in the bullish zone.
Hourly RSI (Relative Strength Index) – The RSI for BTC/USD is now above the 50 level.
Major Support Levels – $26,100, followed by $26,000.
Major Resistance Levels – $26,400, $26,500, and $27,000.
HedgeUp (HDUP) Anticipates 50X at Launch in June, Shiba Inu (SHIB) and Dogecoin (DOGE) Investors Fill Their wallets NewsBTC
Source link ]]>
Here’s Why You Should Fill Your Bags With Floki Inu, Dogecoin, and Big Eyes Coin | Bitcoinist.com Bitcoinist
Source link ]]>