Dogecoin price analysis for December 7, 2022, shows the meme cryptocurrency following a declining movement for the last 48 hours. The price crashed from $0.1024 to $0.0961 on December 6, 2022. Dogecoin gained a negative movement today and significantly decreased its value. Today the cryptocurrency continues a bearish movement and is at $0.0961 at the time of writing.
Dogecoin has been down 3.97% in the last 24 hours with a trading volume of $666,092,936 and a live market cap of $12,765,461,117, and DOGE currently ranks at #8. However, the cryptocurrency shows potential for a reversal as the recent price analysis indicates the DOGE cost is moving toward the support.
DOGE/USD 4-hour price analysis: Recent developments
Dogecoin price analysis seems to show the market following a negative movement, with the market’s volatility entering an opening movement, consequently expanding the market. This makes the price of the cryptocurrency more prone to experience volatile change on either extreme. As a result, Bollinger’s band upper limit is present at $0.1071, representing the strongest resistance for DOGE. Conversely, the lower limit of Bollinger’s band is present at $0.0961, representing another resistance for the meme cryptocurrency.
The DOGE/USD appears to cross under the curve of the Moving Average, indicating a bearish movement. The price seems to move upwards towards the MA curve, attempting to break it. As the volatility happens to close, this could be in favor of the bulls, as a breakout would explode the volatility providing more room to the bulls for further activity.

Dogecoin price analysis reveals the Relative Strength Index (RSI) to be 37, indicating an undervalued number for DOGE, falling under the lower neutral region. In addition, the RSI score appears to move upwards, indicating an increasing market and dominant buying activities signifying an increase in the market.
Dogecoin price analysis for 24 hours
Dogecoin price analysis shows the market to be following a constant movement, with its volatility increasing. In addition, the market appears to be undergoing an opening movement, indicating future volatility bursts. This makes the DOGE price more prone to undergo change on either extreme. The upper limit of Bollinger’s band exists at $0.1124, serving as the strongest resistance of DOGE. Conversely, the lower limit of Bollinger’s band is at $0.0724, representing the strongest support for DOGE.
Dogecoin appears to follow a bearish movement, with the DOGE/USD price crossing under the curve of the Moving Average. The downward movement indicates a declining market for the meme cryptocurrency. The price attempts to meet the support band soon. If they happen to meet, the market will break and reverse the market dynamic.

The Relative Strength Index (RSI) score is 51, signifying the stability of the meme cryptocurrency. Dogecoin falls in the stable region following a declining movement. The decrease in the RSI score represents the dominance of the selling activities and the movement toward further declining dynamics.
Dogecoin Price Analysis Conclusion
Dogecoin price analysis reveals the cryptocurrency following a declining movement, showing potential towards the negative extreme. However, the market shows colossal potential for a reversal in the coming days due to the price moving toward the support. If the bulls manage to use it to their advantage, they might engulf the market and help raise the price of Dogecoin beyond expectations.
Disclaimer. The information provided is not trading advice. Cryptopolitan.com holds no liability for any investments made based on the information provided on this page. We strongly recommend independent research and/or consultation with a qualified professional before making any investment decisions.

- Warning Signs for crypto everywhere
- Hidden bearish divergence is running wild across multiple cryptocurrency pairs.
- Threats of another flash-crash are nearing their tipping point.
Cardano (ADAUSD)
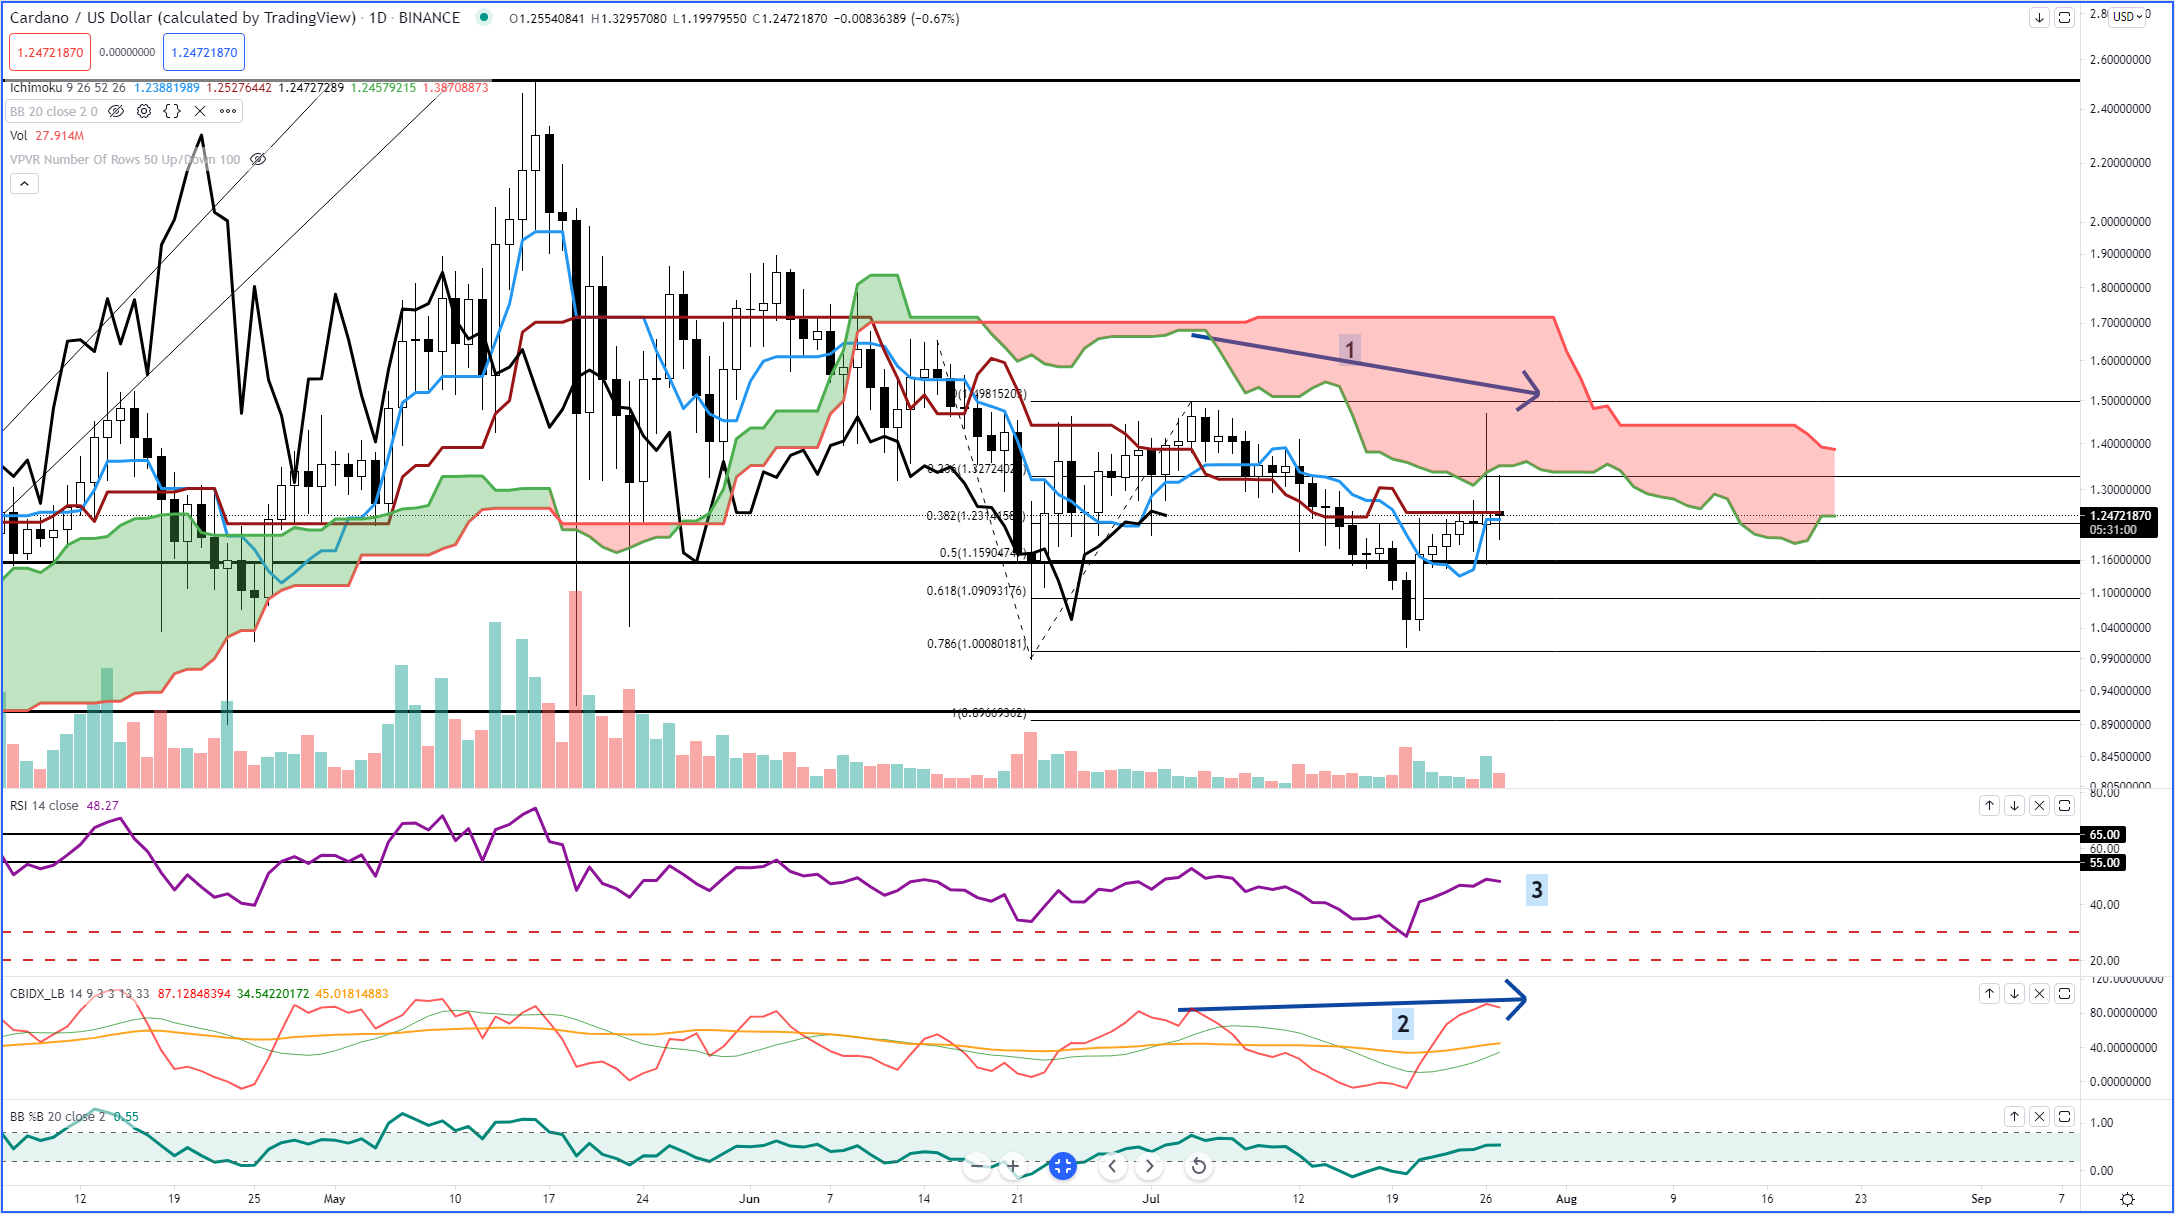
Above: Cardano (ADAUSD)
Cardano, like Bitcoin, had an amazing performance on Monday… until it sold off nearly all of the gains. At one point, Cardano printed a nearly +20% gain (+19.56%), only to retrace nearly all of that movement to close slightly higher with a +2.07% gain. During today’s trade (July 27th, 2021), traders again attempted to push Cardano higher, but were stalled out. After nearing a +6% gain it is now, at the time of writing this article (1410 EST), down -1.07%. A major contributing factor to the selling pressure is the existence of a bearish continuation pattern known as hidden bearish divergence. Hidden doesn’t mean ‘hard to see or hiding’ – it’s more like a hint or a warning that the current bullish price action will likely terminate and resume the broader bearish trend. Hidden bearish divergence occurs when the price chart shows lower highs/closes while an oscillator like the Composite Index prints higher highs. #1 on the price chart shows the descending highs while the #2 on the Composite Index shows the rising peaks: hidden bearish divergence. The likelihood of continued selling below $1.00 value area is reinforced by the presence of some major resistance levels. First, bulls were slapped down lower at the bottom of the daily Cloud today and yesterday. Second, the hidden bearish divergence occurs as the RSI tested the first overbought level in a bear market at 55 and is now sloping lower (#3). I expect to see a fairly strong drop back down to $0.9795. However – I do maintain that moment the daily chart has a daily close above the candlesticks, we are probably looking at a new bull run – but for now it remains bearish.
Bitcoin (BTCUSD)
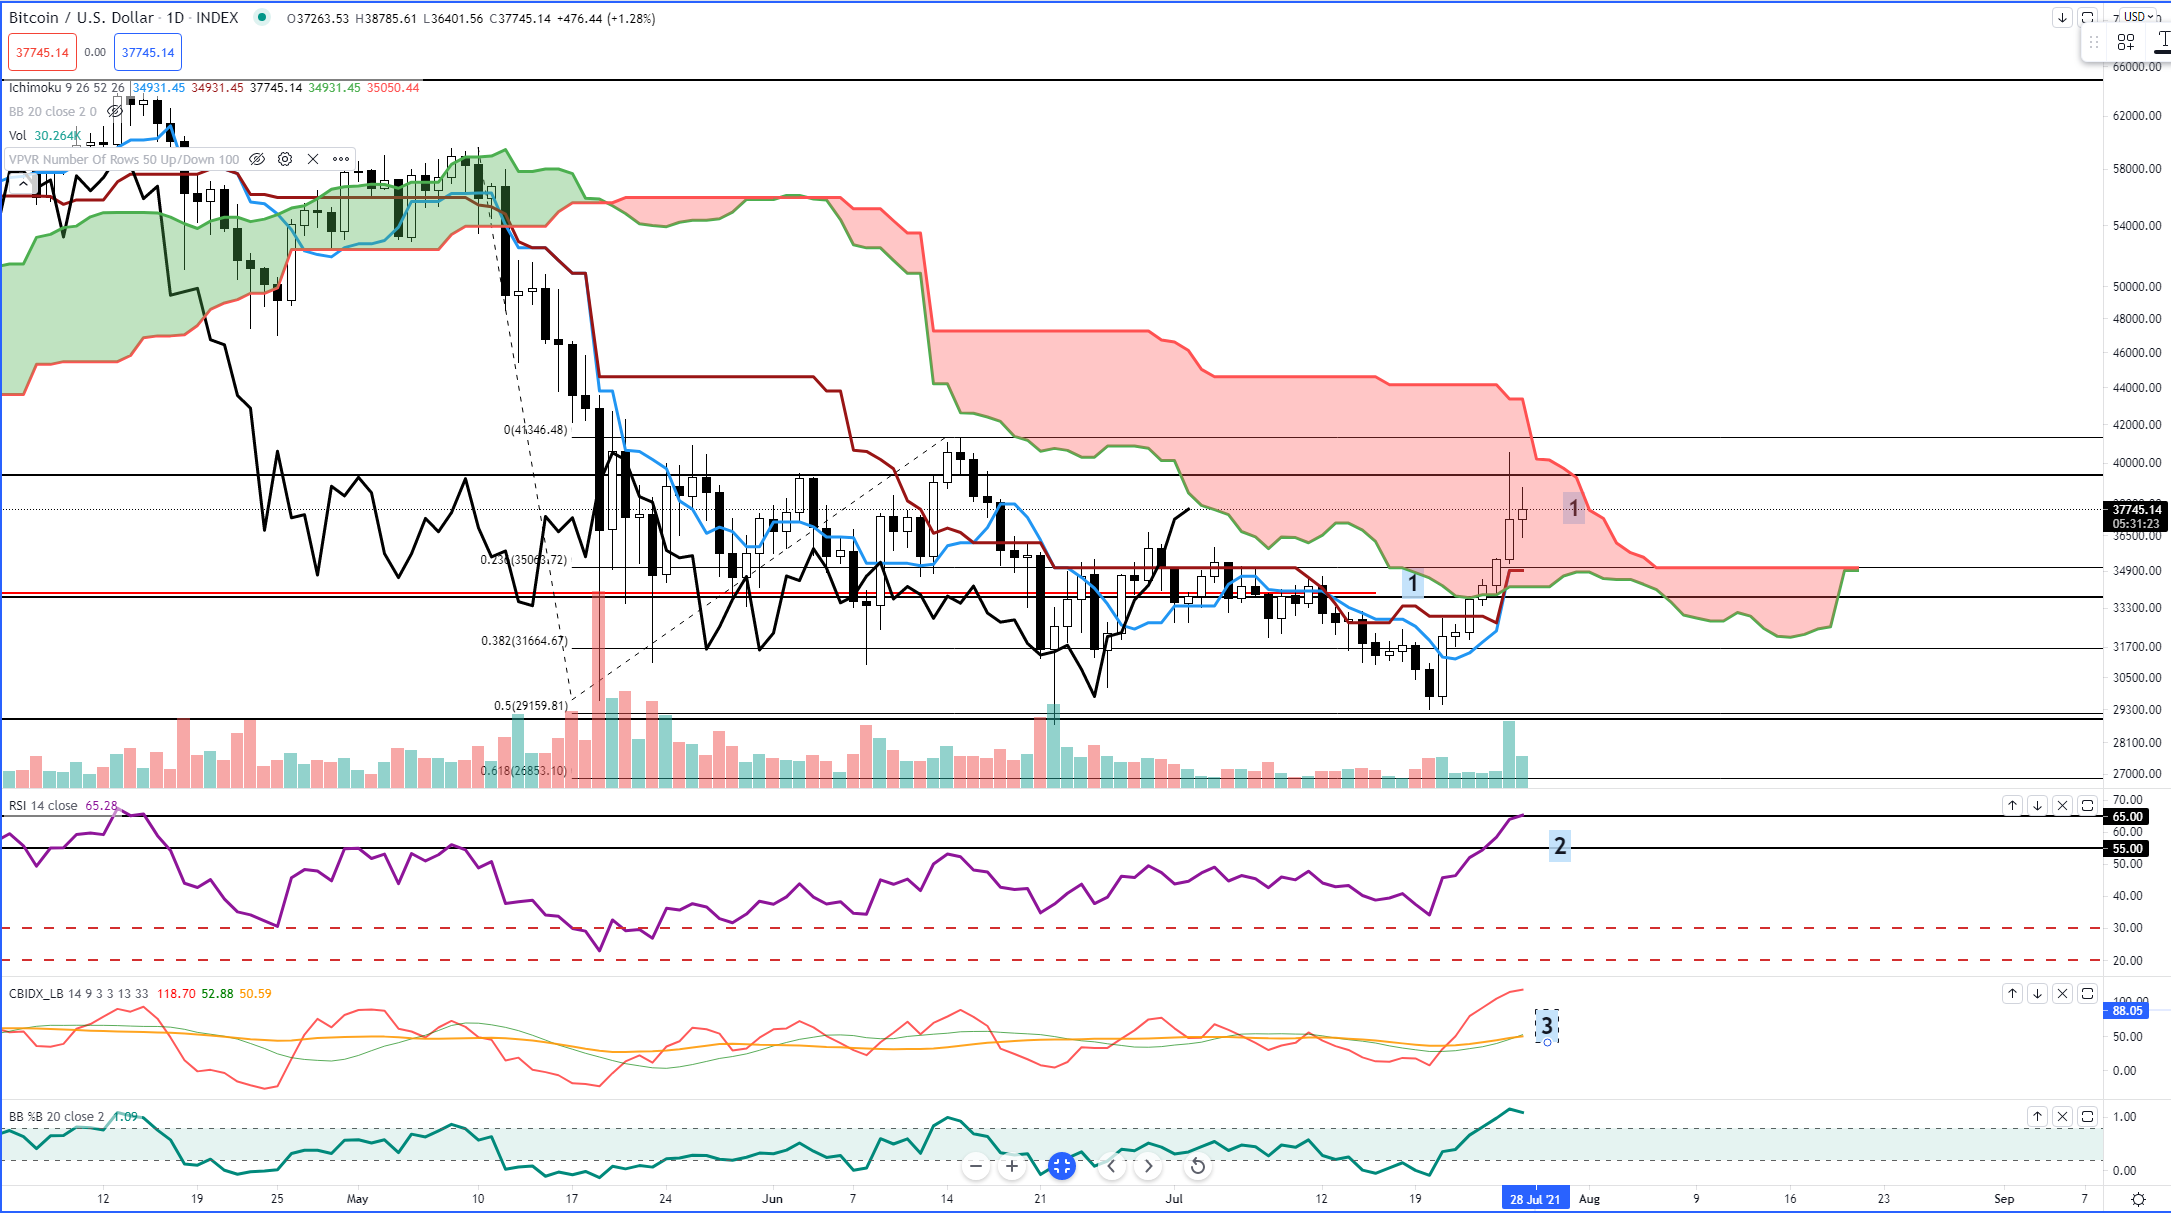
 Above: Bitcoin (BTCUSD)
Bitcoin had one heck of a run during the Monday trade session (July 26th, 2021) – but it sold off the great majority of its intraday gains. Almost the exact same conditions present on Cardano’s chart are present on Bitcoin’s chart. The current daily candlestick shows an inside bar forming inside the Cloud (#1). A quick note about trading an instrument inside the Cloud: don’t. The Cloud is a place I affectionately call: “The Place Where Trading Accounts Go To Die.” The Cloud represent indecision, volatility, whipsaws, misery, tears, depression, madness, insanity, and pain. How many people today are wondering why Bitcoin, after a breakout above resistance, isn’t moving higher? There’s a lot of reasons, but I think the best illustration is between the hidden divergence on the daily chart (not shown, but almost exactly the same as Cardano’s) and the RSI (#2). In a bear market, the two overbought levels in the RSI are 55 and 65. It is no coincidence that as hidden bearish divergence developed, momentum higher has disspated right on top of the RSI hitting the last overbought level at 65. I am expecting a fast return to the $28,516.41 level. BUT – and this is a big but – Bitcoin’s Laggin/Chikou Span is above the candlesticks and the current price level, while inside the Cloud, could very easily breakout above the Cloud, thereby negating a significant amount of the bearish conditions. This is a good place to just sit an watch, at least that’s why I plan on doing for a few days.
Advertisement
Save money on your currency transfers with TorFX, voted International Money Transfer Provider of the Year 2016 – 2020. Their goal is to connect clients with ultra competitive exchange rates and a uniquely dedicated service whether they choose to trade online or over the telephone.
Find out more here.