Cardano, Tron and even Dogecoin are all in danger of being flipped by this new crypto superstar Latest news from Azerbaijan
Source link ]]>
Over the last month, Bitcoin ranged within the $100,000 — $110,000 price region until its recent breakout to reach a new all-time high. On-chain data show that a shift in BTC holder behavior may have played a significant role in the flagship cryptocurrency’s recent price action.
LTHs Begin Distributing, But STHs Accumulate
In a July 12 post on the X platform, on-chain analyst Boris explained how a shift in Bitcoin holder activity has affected the market over the past months. This explanation was based on indicators measuring the Accumulation Vs Distribution of Long-Term Holders (LTH) and Short-Term Holders (STH).
For these two holder categories, the metric tracks and analyzes wallet behavior to determine whether they are increasing or decreasing their Bitcoin holdings over time.
Related Reading: Bitcoin Breaks Records: What Miners and Leverage Traders Are Doing Behind the Scenes
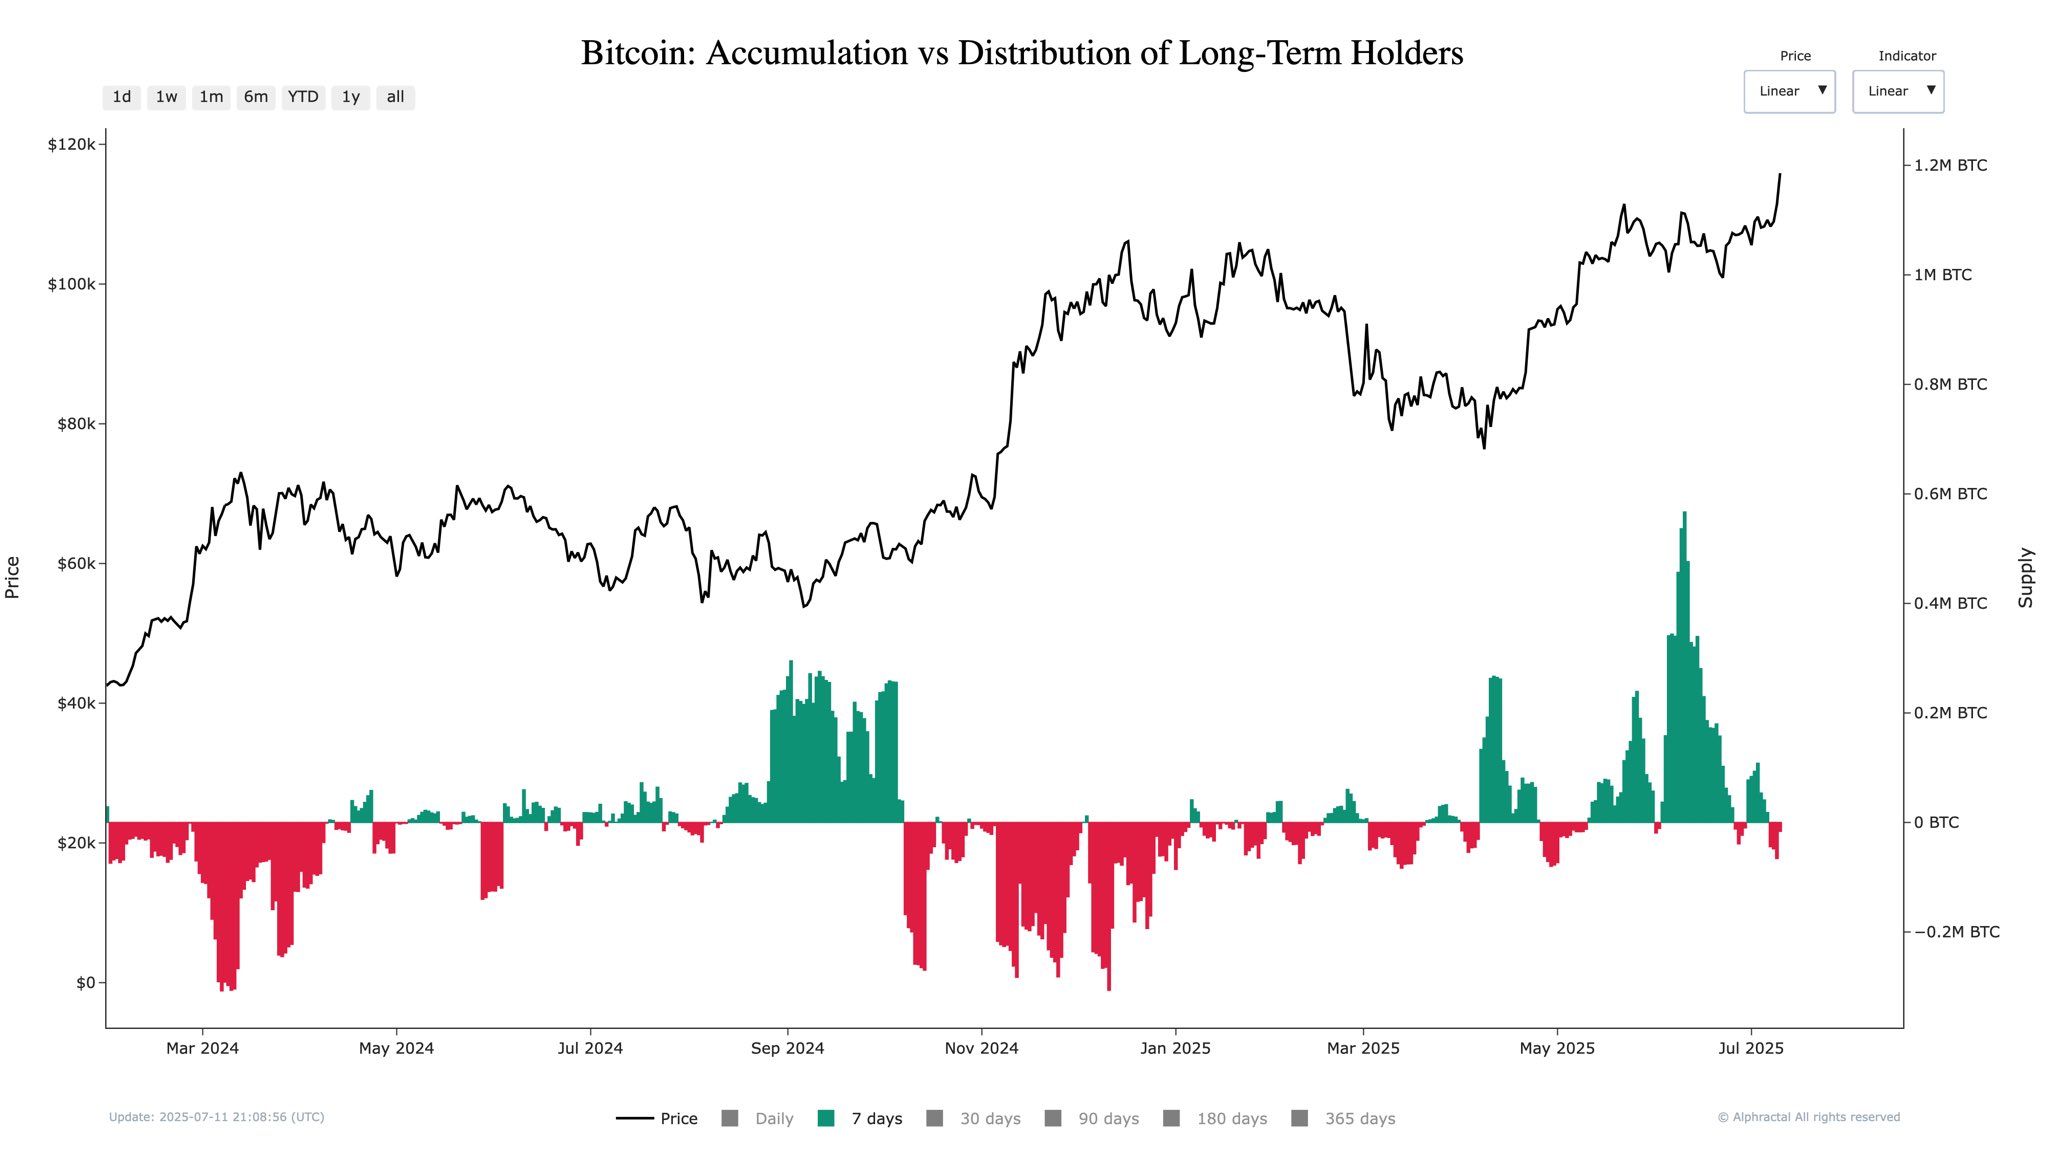
For the long-term holders, the chart above shows how accumulation grew from the later days of May to the end of June. This is represented by the growing green graphs over the red.
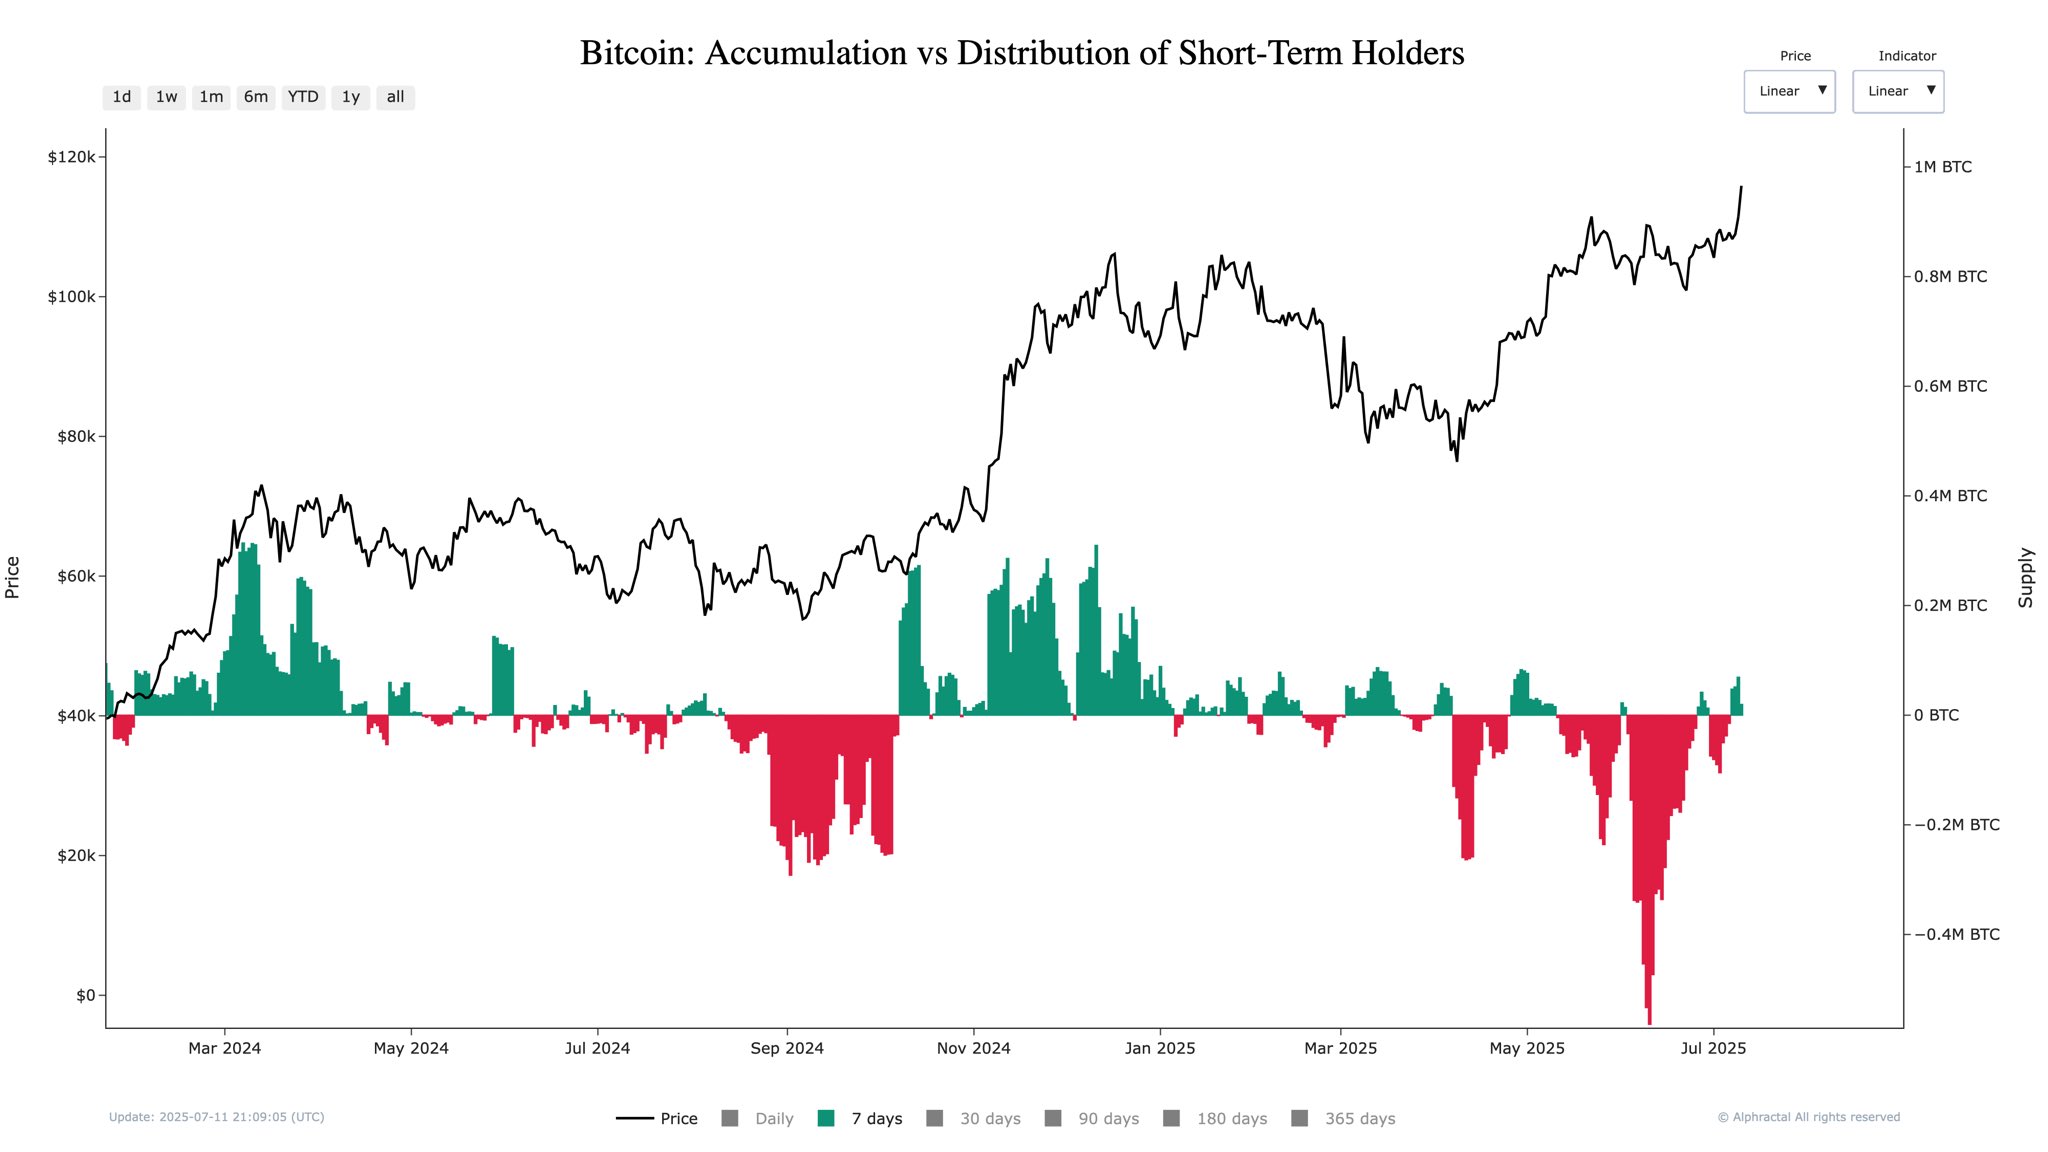
Within the same timeframe, the chart below shows short-term holders were represented more by the red graphs than the green, indicating more distribution than accumulation in the past month.
Boris credited the LTHs for Bitcoin’s survival above the $100,000 support zone. “Despite heavy STH distribution and retail selling pressure, BTC defended the 100K support — a clear sign of structural accumulation led by LTH wallets,” the on-chain analyst said.
According to Boris, the short-term holders were observed to have sold more than 563,000 BTC as Bitcoin continued to range. As this happened, the Long-Term holders steadily accumulated Bitcoin, and this absorbed most of the selling pressure from STHs.
However, this dynamic seems to have reversed very recently. The online pundit reported that the Long-Term Holders started distributing their Bitcoin holdings. This sell-off from the LTHs may be a result of profit-taking, as the cryptocurrency’s upward drift would necessitate.
On the other hand, the short-term holders have started to accumulate Bitcoin. This trend seen with this reactive group of investors indicates renewed retail interest or speculative entry amidst the current bullish rally.
Boris further inferred that this handover from LTH support to STH support must have fuelled Bitcoin’s latest breakout, as short-term momentum is injected into the market.
What’s Next For Bitcoin?
While this rotation of supply between holder classes may not be strange in crypto market cycles, the scale and timing of this switch suggest that Bitcoin’s price action holds more interesting rallies in the near future. However, if the short-term buying pressure should taper, the absence of long-term support may cause a lower support to be retested. As of this writing, Bitcoin is valued at $117,300, reflecting no significant movement in the past 24 hours.
Related Reading
Featured image from iStock, chart from TradingView
Tron (TRX) Just Flipped Dogecoin (DOGE), Here’s Why It Matters TradingView
Source link ]]>
Tron (TRX) Just Flipped Dogecoin (DOGE), Here’s Why It Matters U.Today
Source link ]]>
Comparing Ethereum Against Cardano and Solana: Can ETH Be Flipped or Will It Dominate for Years to Come? MSN
Source link ]]>
Notice: Function wp_get_loading_optimization_attributes was called incorrectly. An image should not be lazy-loaded and marked as high priority at the same time. Please see Debugging in WordPress for more information. (This message was added in version 6.3.0.) in /home/aonyeani76/cryptocurrencypanther/wp-includes/functions.php on line 6131
After a week of notable crashes, Bitcoin has again seen life breathed into its price trajectory and has reclaimed its mark above $90,000. The major primer for the return of bullish momentum was the announcement of a US crypto strategic reserve by President Donald Trump over the weekend, which could be the beginning of an extended rally for Bitcoin and other cryptocurrencies.
With the return of bullish momentum, veteran financial analyst Peter Brandt listed six reasons Bitcoin has flipped bullish.
Peter Brandt Lists Six Reasons Bitcoin Has Turned Bullish
Bitcoin has seen its value rise by approximately 9% in the past 24 hours, adding about $166 billion to its market capitalization. This marks a swift change from the decline last week, which saw Bitcoin declining to fill a CME gap below $80,000.
Related Reading
Renowned for his deep technical expertise, Peter Brandt took to social media to outline six reasons why Bitcoin has now returned to a bullish trajectory. His observations are rooted on a series of technical developments that have unfolded over the past week.
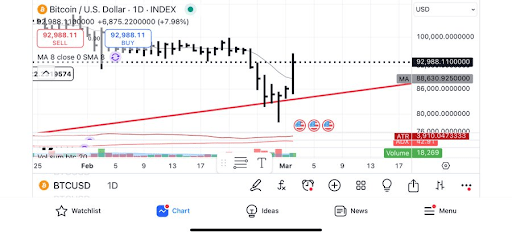
Brandt’s first key point is Bitcoin’s recent 30% correction. Notably, Bitcoin’s recent crash to a bottom at $78,900 marked a 30% correction from its January 30 all-time high of $108,786. This level of pullback is typical in strong bull markets and often precedes the next leg up. The second reason why Bitcoin has flipped bullish is its ability to find support along its parabolic advance despite the recent dip.
Another factor reinforcing Bitcoin’s bullish outlook is the successful retest of a CME futures gap below $80,000. Interestingly, this gap had been a key concern even as Bitcoin rallied to above $100,000 in January, with technical analysis warning of a drop toward this level. Now that the CME gap has been filled, the next step is the resumption of bullish momentum.
Brandt also highlighted the emergence of a “foot shot doji” candlestick pattern, which typically indicates the exhaustion of selling pressure and a potential reversal. Furthermore, he referenced the Factor three-day trailing stop rule to indicate that Bitcoin is regaining strength. Lastly, he pointed to a high-volume “puke out,” where sellers have exited Bitcoin in capitulation. Taken together, these signals suggest that Bitcoin’s latest rally is not just a temporary bounce but a confirmation of bullish momentum.
What’s Next For BTC As Bullish Signals Strengthen?
At the time of writing, Bitcoin is trading at $92,443 and everything surrounding its fundamentals now points to a continued move upwards in the coming weeks. Interestingly, you could argue that institutional invesments through Spot Bitcoin ETFs have yet to be factored into the price of Bitcoin following Trump’s announcement of a US crypto strategic reserve.
Related Reading
The announcement came over the weekend when traditional markets were closed, meaning the bullish momentum was largely driven by retail traders. With this, Bitcoin is likely to push past the $100,000 mark again before the end of the week as institutional inflows pick up.
Featured image from iStock, chart from Trsdingview.com
Dogecoin Price In Red: Is Trend Flipped To Bearish Or Just A Dip? The Coin Republic
Source link ]]>
Dogecoin (DOGE) Briefly Flipped Ripple (XRP) Following Meme Frenzy – Analysts Tip This AI Coin for Huge 50X Bitcoinist
Source link ]]>
Shiba Inu Trader Who Flipped $344 into $1.3M is Now Betting on This ‘SHIB Killer’ for 10066% Gains in Just Bitcoinist
Source link ]]>
Is It Shiba Inu? Former Goldman Sachs Predicts Dogecoin Will Be Flipped The Crypto Basic
Source link ]]>