Notice: Function _load_textdomain_just_in_time was called incorrectly. Translation loading for the updraftplus domain was triggered too early. This is usually an indicator for some code in the plugin or theme running too early. Translations should be loaded at the init action or later. Please see Debugging in WordPress for more information. (This message was added in version 6.7.0.) in /home/aonyeani76/cryptocurrencypanther/wp-includes/functions.php on line 6131
Notice: Function _load_textdomain_just_in_time was called incorrectly. Translation loading for the hustle domain was triggered too early. This is usually an indicator for some code in the plugin or theme running too early. Translations should be loaded at the init action or later. Please see Debugging in WordPress for more information. (This message was added in version 6.7.0.) in /home/aonyeani76/cryptocurrencypanther/wp-includes/functions.php on line 6131
Notice: Function _load_textdomain_just_in_time was called incorrectly. Translation loading for the wpforms-lite domain was triggered too early. This is usually an indicator for some code in the plugin or theme running too early. Translations should be loaded at the init action or later. Please see Debugging in WordPress for more information. (This message was added in version 6.7.0.) in /home/aonyeani76/cryptocurrencypanther/wp-includes/functions.php on line 6131 Forming – Cryptocurrencypanther
https://cryptocurrencypanther.com
Latest Crypto NewsWed, 01 Apr 2026 23:46:58 +0000en-US
hourly
1 https://wordpress.org/?v=6.9.4https://cryptocurrencypanther.com/wp-content/uploads/2021/07/cropped-Cryptocurrency-e1626714913653-32x32.pngForming – Cryptocurrencypanther
https://cryptocurrencypanther.com
3232Ethereum Price Is Now Forming A Counter-Trend Correction
https://cryptocurrencypanther.com/2026/04/01/ethereum-price-is-now-forming-a-counter-trend-correction/
https://cryptocurrencypanther.com/2026/04/01/ethereum-price-is-now-forming-a-counter-trend-correction/#respondWed, 01 Apr 2026 23:46:58 +0000https://cryptocurrencypanther.com/2026/04/01/ethereum-price-is-now-forming-a-counter-trend-correction/
Ethereum is trading just above the important $2,000 psychological level, but the apparent stabilization may be deceptive. According to a technical analysis published on TradingView by crypto analyst RLinda, what looks like a recovery attempt is, in fact, a counter-trend correction, a bear market bounce that could be setting bulls up for a painful flush lower.
Crypto Winter Tightens Its Grip
RLinda’s analysis opens with a direct assessment of how the crypto winter is still in play and support might break down around $2,000.
Technical analysis of the 2-hour timeframe chart shows that Ethereum has already printed a series of lower highs and lower lows following its rejection around $2,380 in mid-March. The most recent lower low saw the Ethereum price drop to the $1,960-$1,990 zone over the weekend, which confirms that sellers are still battling for control, forcing the market into what RLinda describes as a counter-trend correction.
Related Reading
This type of correction often creates the illusion of recovery. Price begins to grind upward or move sideways, but within the context of a broader bearish structure. The charts reflect this clearly, with Ethereum now attempting a modest rebound after establishing a local bottom just below $2,000 over the weekend.
Making matters worse is the macro backdrop relating to Bitcoin. Bitcoin, which had been staging what appeared to be a recovery attempt to $72,000 last week, has failed to hold those gains and reversed to as low as $65,810 over the weekend. Bears have reasserted control and Bitcoin’s weakness is cascading directly into altcoins. This, in turn, might cause the Ethereum price to bear the brunt of that spillover pressure in the coming days.
Price Battlegrounds To Watch Out For
The immediate focus on the 2-hour chart is a tight resistance cluster formed between $2,024 and $2,062. This zone coincides with multiple technical factors visible on the chart, including prior support turned resistance, Fibonacci retracement levels around 0.5 and 0.618, and a descending trendline pressing down on lower highs in March.
Related Reading
According to RLinda, Ethereum may test the 2025 to 2038 liquidity zones. A short squeeze would provide a good signal for a potential decline. Price resistance levels to watch in this case are at $2,025, $2,037, and $2,062. The point of interest (POI) at $2,062.50, which is also shown on the chart above, is the most important one.
A retest of this resistance zone, followed by a false breakout and consolidation in the short zone, will confirm bear dominance. Should that confirmation materialize, it could create a counter-trend correction that leads to a new round of selling pressure that pushes the Ethereum price to a support point of interest around $1,900. At the time of writing, Ethereum is trading at $2,050.
ETH trading at $2,053 on the 1D chart | Source: ETHUSDT on Tradingview.com
Featured image from Pixabay, chart from Tradingview.com
]]>https://cryptocurrencypanther.com/2026/04/01/ethereum-price-is-now-forming-a-counter-trend-correction/feed/0Ethereum Open Interest Plunges: Cooling Off Or Cracks Forming?
https://cryptocurrencypanther.com/2026/02/14/ethereum-open-interest-plunges-cooling-off-or-cracks-forming/
https://cryptocurrencypanther.com/2026/02/14/ethereum-open-interest-plunges-cooling-off-or-cracks-forming/#respondSat, 14 Feb 2026 19:07:03 +0000https://cryptocurrencypanther.com/2026/02/14/ethereum-open-interest-plunges-cooling-off-or-cracks-forming/
Ethereum climbed back above $2,000 after a softer-than-expected US CPI print, and the move has traders and analysts debating whether the worst is behind the coin or if this is a temporary relief rally.
Reports say futures open interest has fallen sharply over the last 30 days, funding rates have swung into deeply negative territory, and some on-chain metrics point to a clustered support zone below current prices.
Open Interest Drop Raises Questions
According to CryptoQuant, the headline figure showing an 80 million ETH decline in open interest across major venues grabbed attention. That number, if taken at face value, would be huge. It suggests large positions were closed rather than new ones being put on.
But the scale of the change also invites scrutiny; reporting errors or dollar-value comparisons mislabeled as ETH can happen. Still, a sizable pullback in futures exposure on exchanges including Binance, Gate, Bybit and OKX has been logged, and that much appears real.
Funding Rates And The Crowd
Funding rates on some platforms are pushing to levels not seen in roughly three years. When traders pay to hold short positions, it signals strong bearish conviction.
It is reported that such extremes tend to be followed by a sharp reversal as the crowd can become one-sided, and that leads to a quick reversal as the market sentiment changes.
This was seen at the end of 2022, where there was extreme shorting followed by a quick reversal. This does not mean that it will happen this time around as markets can remain one-sided for longer than expected.
Support Zones And Technical Targets
Glassnode’s on-chain data reveals a significant cost-basis area between $1,880 and $1,900, where about 1.3 million ETH was traded.
The $2,000 mark is acting as a psychological anchor and is reinforced by moving average clusters. A breakout from the recent falling wedge pattern points to an initial measured target near $2,150, a ceiling that would be tested before higher resistance near $2,260 and then $2,500.
Those levels are not certainties; broader market tone and Bitcoin’s direction will influence whether they are reached.
Reduced open interest lowers the risk of cascade liquidations for now, which can tame intraday volatility. At the same time, low funding rates show that bearish bets are still active and could be squeezed if momentum turns.
Reports say accumulation wallets increased inflows when prices dipped, hinting at longer-term conviction among some investors.
Featured image from Unsplash, chart from TradingView
Source link
]]>https://cryptocurrencypanther.com/2025/12/29/dogecoin-price-signals-potential-double-bottom-at-0-12-reversal-forming-crypto-news/feed/0The Case for Shiba Inu’s Final Push Is Quietly Forming – InteractiveCrypto
https://cryptocurrencypanther.com/2025/12/23/the-case-for-shiba-inus-final-push-is-quietly-forming-interactivecrypto/
https://cryptocurrencypanther.com/2025/12/23/the-case-for-shiba-inus-final-push-is-quietly-forming-interactivecrypto/#respondTue, 23 Dec 2025 20:40:23 +0000https://cryptocurrencypanther.com/2025/12/23/the-case-for-shiba-inus-final-push-is-quietly-forming-interactivecrypto/
Source link
]]>https://cryptocurrencypanther.com/2025/12/23/the-case-for-shiba-inus-final-push-is-quietly-forming-interactivecrypto/feed/0XRP Price Is Forming A Death Cross That Previously Led To A 15% Crash
https://cryptocurrencypanther.com/2025/11/26/xrp-price-is-forming-a-death-cross-that-previously-led-to-a-15-crash/
https://cryptocurrencypanther.com/2025/11/26/xrp-price-is-forming-a-death-cross-that-previously-led-to-a-15-crash/#respondWed, 26 Nov 2025 18:27:50 +0000https://cryptocurrencypanther.com/2025/11/26/xrp-price-is-forming-a-death-cross-that-previously-led-to-a-15-crash/
The XRP price is currently at risk of a crash as crypto analyst Umair has revealed that the altcoin has formed a death cross. Notably, this same pattern formed the last time that XRP suffered a 15% crash.
XRP Price At Risk With Death Cross Forming
In an X post, Umair stated that a death cross was forming on the daily chart for the XRP price. He further noted that the last time the altcoin printed this setup, it crashed by 15%, which, the analyst said, lines up perfectly with a potential decline to the $1.50 range. As such, he suggested that XRP could face the same outcome, since the same ingredients have formed.
Related Reading
Umair also mentioned that the chart was building a tight range between $1.90 and $2.08, a range which he described as the entire decision maker. He explained that if the XRP price can stay inside this band and spend time there, then it could form a month-long consolidation needed for a real base.
However, if the XRP price fails to hold this range, then there is nothing stopping it from crashing to the $1.50 zone, according to the crypto analyst. He noted that this is exactly where the previous breakdown logic pointed. He also raised the possibility of another scenario playing out for XRP.
Umair stated that if the XRP price wicks below $1.82 but snaps back inside the $1.90 and $2.08 range, then that could mark the bottom. However, if the altcoin closes below this range, then the range loses integrity, and XRP could begin its freefall. It is worth mentioning that XRP had dropped to as low as $1.8 last week but has since reclaimed the psychological $2 level.
$1.65 Could Mark The Bottom For XRP
Crypto analyst CasiTrades has predicted that the macro .618 support near $1.65 is likely to mark the bottom for the XRP price. This came as she noted that the altcoin was seeing a relief bounce for subwave 4. The analyst added that she expects XRP to backtest the $2 or $2.09 resistance before heading down to complete the final wave of this correction at $1.65.
Related Reading
CasiTrades noted that this aligns extremely cleanly with Bitcoin. She explained that the BTC price came close to its own macro .382 retracement but hasn’t fully made it yet. The analyst expects BTC to finish its correction at $80,000, as XRP price makes its last move to $1.65. Once those levels are hit, CasiTrades expects the structure to flip bullish fast.
The analyst predicts that Bitcoin will begin its Wave 5 into new highs while the XRP price and other altcoins kick off their macro Wave 3. She declared that they will begin their move together, but with different strengths because they are in different positions in the broader market cycle.
At the time of writing, the XRP price is trading at around $2.17, down over 3% in the last 24 hours, according to data from CoinMarketCap.
XRP trading at $2.20 on the 1D chart | Source: XRPUSDT on Tradingview.com
Featured image from Peakpx, chart from Tradingview.com
]]>https://cryptocurrencypanther.com/2025/11/26/xrp-price-is-forming-a-death-cross-that-previously-led-to-a-15-crash/feed/0Pi Coin Price Prediction: A Rare Pattern Is Forming – Could This Quiet Move Be the Start of Something Huge?
https://cryptocurrencypanther.com/2025/11/07/pi-coin-price-prediction-a-rare-pattern-is-forming-could-this-quiet-move-be-the-start-of-something-huge/
https://cryptocurrencypanther.com/2025/11/07/pi-coin-price-prediction-a-rare-pattern-is-forming-could-this-quiet-move-be-the-start-of-something-huge/#respondFri, 07 Nov 2025 19:14:46 +0000https://cryptocurrencypanther.com/2025/11/07/pi-coin-price-prediction-a-rare-pattern-is-forming-could-this-quiet-move-be-the-start-of-something-huge/
With momentum indicators hinting at subtle strength beneath the surface, Pi might be gearing up for an explosive breakout.
Mixed Signals in Money Flow – Accumulation or Distribution?
The recent Money Flow Index (MFI) reading of 56.67 places Pi in a neutral-to-bullish zone, suggesting moderate buying pressure without signs of overheating.
This level indicates that investors have been steadily accumulating since early October, maintaining healthy inflows.
Source: TradingView
However, the Chaikin Money Flow (CMF) sits at -0.14, implying that some capital continues to flow out of the asset.
This divergence suggests a tug-of-war between buyers and sellers. A move in the CMF back above zero could confirm a bullish shift in money flow.
PI Price Analysis: A Rare Falling Channel Pattern
The daily chart reveals Pi trading within a long-term falling channel pattern, typically considered a bullish reversal formation.
The price has tested the lower trendline multiple times while maintaining higher lows on the RSI.
Source: TradingView
If Pi manages to break above the upper boundary of the channel with volume confirmation, the first major resistance lies at $0.35, followed by $0.65.
A sustained breakout beyond these zones could open the door to a much larger move toward the $4 target, marking a potential multi-month reversal.
Beginning of Rally?
With the immediate support in the $0.17–$0.15 zone and short-term targets at $0.35 and $0.65, Pi Coin is currently in a state of quiet accumulation, supported by moderate money inflows and a technical setup that hints at a possible bullish breakout.
PI Eyes Comeback as PEPENODE Presale Explodes
As Pi Network gears up for a potential breakout, another project is also catching massive investor attention.
PEPENODE ($PEPENODE) is flipping the script on crypto mining, ditching expensive hardware setups in favor of a fully virtual, gamified experience anyone can join.
Users can create digital server rooms, purchase and upgrade nodes, and enhance their virtual facilities to maximize rewards.
PEPENODE has raised a substantial $2 million in its ongoing presale, boasting significant confidence and contributions from the community.
PEPENODE’s economy is built for growth, with a powerful deflationary system that burns up to 70% of tokens spent on rigs and upgrades.
This keeps supply tight, supports long-term value, and rewards early players as demand rises.
Early PEPENODE buyers can get up to 621% per annum in rewards.
Disclaimer: Coinspeaker is committed to providing unbiased and transparent reporting. This article aims to deliver accurate and timely information but should not be taken as financial or investment advice. Since market conditions can change rapidly, we encourage you to verify information on your own and consult with a professional before making any decisions based on this content.
A crypto journalist with over 5 years of experience in the industry, Parth has worked with major media outlets in the crypto and finance world, gathering experience and expertise in the space after surviving bear and bull markets over the years. Parth is also an author of 4 self-published books.
]]>https://cryptocurrencypanther.com/2025/11/07/pi-coin-price-prediction-a-rare-pattern-is-forming-could-this-quiet-move-be-the-start-of-something-huge/feed/0Dogecoin Dips Under Key Support – Yet a Breakout Pattern Is Forming – CryptoPotato
https://cryptocurrencypanther.com/2025/11/03/dogecoin-dips-under-key-support-yet-a-breakout-pattern-is-forming-cryptopotato/
https://cryptocurrencypanther.com/2025/11/03/dogecoin-dips-under-key-support-yet-a-breakout-pattern-is-forming-cryptopotato/#respondMon, 03 Nov 2025 18:03:42 +0000https://cryptocurrencypanther.com/2025/11/03/dogecoin-dips-under-key-support-yet-a-breakout-pattern-is-forming-cryptopotato/
Source link
]]>https://cryptocurrencypanther.com/2025/11/03/dogecoin-dips-under-key-support-yet-a-breakout-pattern-is-forming-cryptopotato/feed/0John Bollinger Sees ‘W’ Bottom Forming in Ethereum and Solana, Not Bitcoin
https://cryptocurrencypanther.com/2025/10/18/john-bollinger-sees-w-bottom-forming-in-ethereum-and-solana-not-bitcoin/
https://cryptocurrencypanther.com/2025/10/18/john-bollinger-sees-w-bottom-forming-in-ethereum-and-solana-not-bitcoin/#respondSat, 18 Oct 2025 21:42:51 +0000https://cryptocurrencypanther.com/2025/10/18/john-bollinger-sees-w-bottom-forming-in-ethereum-and-solana-not-bitcoin/
Famous technical analyst John Bollinger have found possible W bottoms in Ethereum (ETH) and Solana (SOL) charts. These are patterns often seen before bullish reversals. However, Bollinger, famous for creating the Bollinger Bands indicator noted that Bitcoin (BTC) is yet to display a similar setup. Bollinger Highlights Key Divergence Between Bitcoin and Altcoin Setups In
Bitcoin’s price action has managed to break above $115,000 after spending the majority of the past two weeks trading below this level. Bitcoin is now holding firm above $114,000, and the leading cryptocurrency has regained momentum over the past week that shows signs of renewed bullish strength.
According to technical analysis, a hidden bullish divergence is forming with the recent price action this week, and this could be the setup that pushes Bitcoin to new price highs.
Bitcoin Revealing Hidden Bullish Divergence
Technical analysis of Bitcoin’s weekly candlestick timeframe chart, which was posted on the social media platform X by crypto analyst CrypFlow, shows that Bitcoin could be on track to resume its journey of new all-time highs.
Related Reading
Last week’s close means that Bitcoin has confirmed a higher price low in the weekly timeframe following the pullback that began after its August all-time high. As shown in the weekly candlestick chart below, this low is a higher low compared to June’s low below $100,000.
On the other hand, while the price printed a higher low, the Relative Strength Index (RSI) posted a lower low in the same time frame. This mismatch between price and momentum creates what is called a hidden bullish divergence, which is a technical pattern that suggests bullish continuation.
The weekly candlestick chart shared by CrypFlow shows Bitcoin defending an important support level around $114,000 and is now on two bullish weekly candlesticks. According to the analyst, if this divergence is confirmed as expected, it could provide the foundation for Bitcoin to push to new highs again. At the time of writing, Bitcoin is trading 5.7% below its current all-time high of $124,128.
Stochastic RSI Flips Bullish
The stochastic RSI indicator on the weekly timeframe has just flipped bullish, though confirmation will depend on how Bitcoin closes in the coming sessions. The last time such a bullish flip occurred on the weekly timeframe was in April, just before Bitcoin kickstarted a run that saw it close at bullish prices for seven consecutive weeks. A similar playout could see Bitcoin register at least five more bullish weekly closes in the coming weeks.
Related Reading
The upcoming macroeconomic events could introduce volatility into the crypto industry, and this is worth keeping an eye on. The Federal Open Market Committee (FOMC) is set to meet on Wednesday, and expectations are running high that policymakers will announce an interest rate cut of 25 basis points or possibly even 50 basis points. An interest rate cut could have different effects, and history has shown that this could shift investor sentiment toward Bitcoin and other large-cap cryptocurrencies.
At the time of writing, Bitcoin is trading at $117,040, already playing out bullish continuation by being up by 9% from its September open.
BTC trading at $116,737 on the 1D chart | Source: BTCUSDT on Tradingview.com
Featured image from Pixabay, chart from Tradingview.com
]]>https://cryptocurrencypanther.com/2025/09/17/bitcoin-price-turns-bullish-above-114000-with-hidden-divergence-forming/feed/0Ethereum Price Forming Base – Key Levels That Could Trigger a Breakout
https://cryptocurrencypanther.com/2025/09/10/ethereum-price-forming-base-key-levels-that-could-trigger-a-breakout/
https://cryptocurrencypanther.com/2025/09/10/ethereum-price-forming-base-key-levels-that-could-trigger-a-breakout/#respondWed, 10 Sep 2025 08:22:34 +0000https://cryptocurrencypanther.com/2025/09/10/ethereum-price-forming-base-key-levels-that-could-trigger-a-breakout/
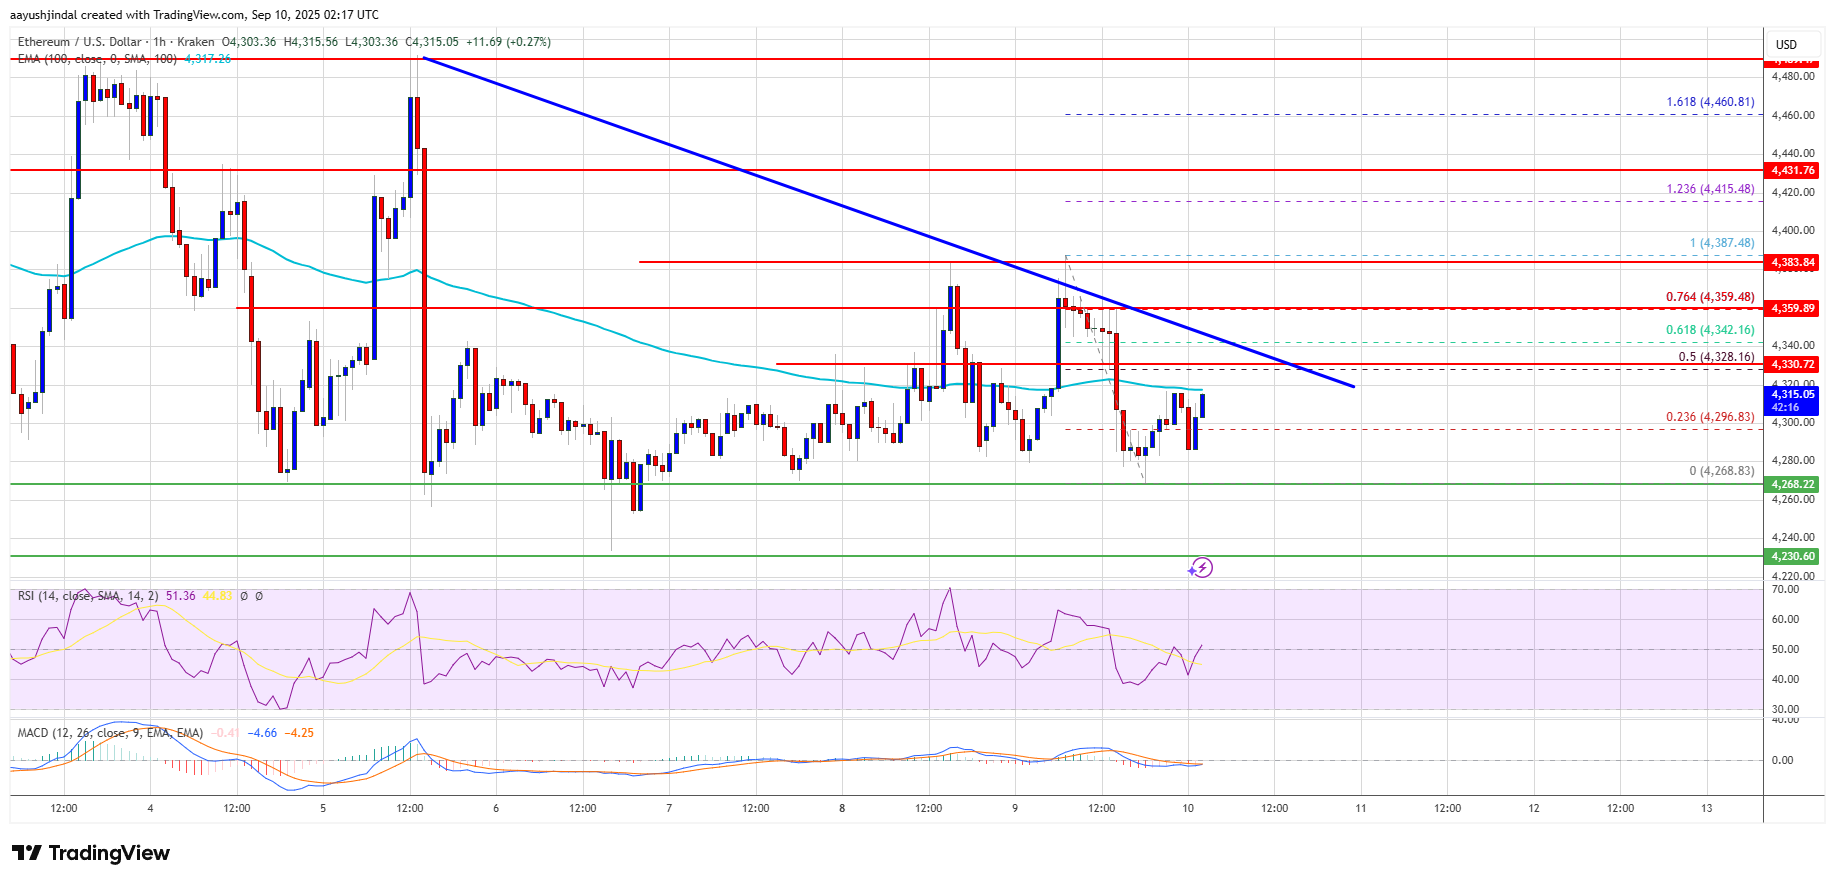
Ethereum price started a fresh decline below the $4,450 zone. ETH is now consolidating and might aim for a fresh increase if it clears $4,380.
Ethereum is still struggling to recover above the $4,400 zone.
The price is trading below $4,380 and the 100-hourly Simple Moving Average.
There is a key bearish trend line forming with resistance at $4,340 on the hourly chart of ETH/USD (data feed via Kraken).
The pair could start a recovery wave if it settles above $4,350 and $4,380.
Ethereum Price Faces Hurdles
Ethereum price started a recovery wave after it formed a base above the $4,260 zone, like Bitcoin. ETH price was able to climb above the $4,320 and $4,350 resistance levels before the bears appeared.
The price struggled to clear the $4,385 level. A high was formed at $4,3873 and the price started to decline again. There was a move below the $4,320 support level. The recent low was formed at $4,268 and the price is now consolidating losses above the 23.6% Fib retracement level of the recent decline from the $4,387 swing high to the $4,268 low.
Ethereum price is now trading below $4,350 and the 100-hourly Simple Moving Average. On the upside, the price could face resistance near the $4,340 level. Besides, there is a key bearish trend line forming with resistance at $4,340 on the hourly chart of ETH/USD.
The next key resistance is near the $4,360 level or the 76.4% Fib retracement level of the recent decline from the $4,387 swing high to the $4,268 low. The first major resistance is near the $4,385 level. A clear move above the $4,385 resistance might send the price toward the $4,420 resistance. An upside break above the $4,420 resistance might call for more gains in the coming sessions. In the stated case, Ether could rise toward the $4,500 resistance zone or even $4,550 in the near term.
More Downside In ETH?
If Ethereum fails to clear the $4,340 resistance, it could start a fresh decline. Initial support on the downside is near the $4,265 level. The first major support sits near the $4,220 zone.
A clear move below the $4,220 support might push the price toward the $4,200 support. Any more losses might send the price toward the $4,160 support level in the near term. The next key support sits at $4,120.
Technical Indicators
Hourly MACD – The MACD for ETH/USD is losing momentum in the bearish zone.
Hourly RSI – The RSI for ETH/USD is now near the 50 zone.