A wave of forced liquidations swept through crypto markets on Tuesday as traders who had bet against Bitcoin and Ether were caught off guard by a sharp price surge tied to hopes of a US-Iran agreement.
Related Reading
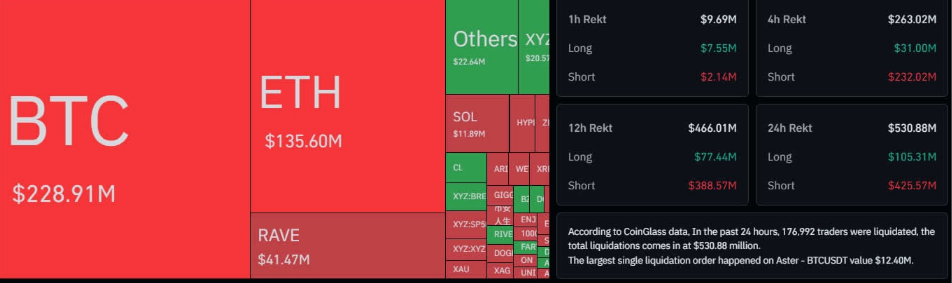
Around 80% of the $530 million in total liquidations over 24 hours — roughly $425 million — came from leveraged short positions in the two largest cryptocurrencies.
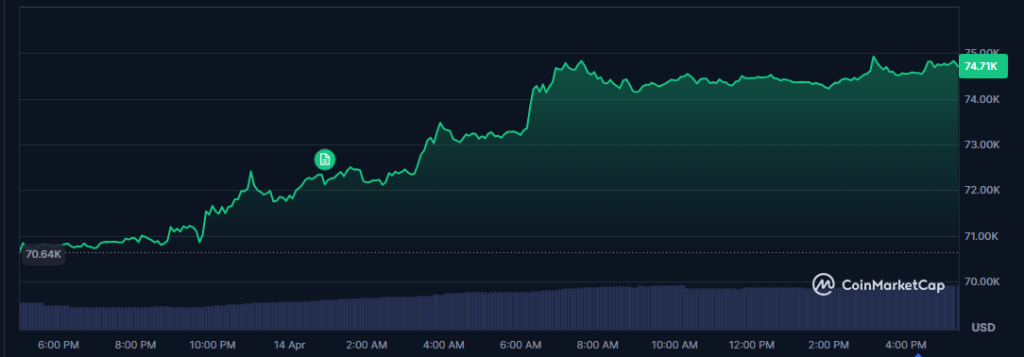
Bitcoin touched just under $75,000 on CoinMarketCap, a level not seen in nearly a month, before running into heavy resistance and retreating to about $74,655. Ether made an even bigger move, climbing 7% to reach $2,378 — its highest point since early February.
Geopolitical Hopes Fuel The Move
The rally came as markets began pricing in the possibility of a negotiated end to weeks of tension between Washington and Tehran. Jeff Mei, chief operating officer at crypto exchange BTSE, said traders believe the two sides are drawing closer to an agreement.
Iran’s oil exports are central to its economy, and a US blockade of the Strait of Hormuz shipping lane could put severe pressure on the country to come to the table.
“Now, it appears that Iran is frantically looking to broker a deal, and stock and crypto markets are rallying as a response,” Mei said.
US President Donald Trump confirmed Monday that a military blockade had begun. He threatened to eliminate any Iranian vessels that come near. Trump also told reporters Iran wants to reach a deal, but his administration will not sign anything that allows Tehran to pursue nuclear weapons.
The broader crypto market climbed to a total value of $2.6 trillion — its highest in a month — as the news spread. About 177,000 traders were liquidated across markets over a 24-hour period, according to data from CoinGlass.
Not Everyone Is Convinced
The rapid price jump did not go unquestioned. Valerius Labs, a market analyst, pushed back on the idea that the move signals a genuine recovery. “This isn’t a breakout,” the firm said. “It’s a short squeeze running into overhead supply. Real buyers show up above the 200-day simple moving average, not 15% below it.”
Related Reading
Some analysts reported that over $300 billion in crypto short positions were wiped out in just a few hours, adding more than $100 billion to the total market cap in the process.
Beyond the short squeeze, other forces may also be at work. Reports indicate that institutional buying through spot crypto exchange-traded funds, along with purchases by centralized exchanges, could be adding fuel to Bitcoin’s climb. Still, the rejection at $75,000 resistance kept the bulls from claiming a clean win.
Featured image from Getty Images, chart from TradingView
Dogecoin Price Prediction Stalls as DOGE ETF Filing Builds Hope and Pepeto Presale Fills Before Listing openPR.com
Source link ]]>
SHIB Price Prediction: Shiba Inu Tanks 6% But ‘Inverted Hammer’ Offers Hope to Bulls CoinDesk
Source link ]]>
The crypto market for the week of February 16-20 saw Bitcoin, ETH, XRP, and other cryptocurrencies pressured by macro and quantum computing fears. DATs continued accumulating as TradFi focused on tokenized assets, prediction markets, and the CLARITY Act. BTC stabilized after the early-month crash but stayed range-bound, with cautious sentiment driven by key U.S. economic
The post Crypto Market Weekly Recap: BTC Waver on Macro & Quantum Jitters, CLARITY Act Deadline Fuels Hope, Sui ETFs Go Live Feb 16-20 appeared first on CoinGape.
]]>Ethereum’s technical structure has weakened further after slipping decisively below the $2,100 level, reinforcing short-term bearish pressure. However, while the breakdown raises the risk of a deeper downside, a repeating fractal pattern on the higher timeframe offers a potential glimmer of hope, suggesting that a larger breakout could still emerge if history rhymes.
Key $2.3K–$2.1K Support Zone Lost
According to Crypto Candy, Ethereum has decisively lost its key daily support zone between $2,300 and $2,100, closing firmly below it and confirming a structural breakdown. This area had previously acted as a strong demand region, repeatedly absorbing selling pressure. Its failure marks an important technical shift, suggesting that the broader market structure has weakened.
With the breakdown confirmed, the former support zone has now flipped into a significant resistance area. ETH has already attempted to reclaim the $2,100–$2,300 range but has failed to regain acceptance above it. This rejection reinforces the idea that sellers are defending the level aggressively, keeping short-term momentum tilted to the downside.

If bearish momentum continues to build, the next major support region to watch sits between $1,700 and $1,500. A move into this range would align with typical continuation behavior following a failed reclaim of broken support.
For now, the bias remains bearish as long as Ethereum trades below the $2,300–$2,100 zone. Only a strong reclaim followed by sustained consolidation above that range would invalidate the downside scenario.
Ethereum Fractal Structure Mirrors Pre-Rally Setup
Providing a weekly Ethereum update, Trader Tardigrade pointed to a compelling fractal comparison that suggests a familiar structure may be unfolding. The expert’s analysis highlights the formation of a rectangular consolidation box, a setup that closely resembles the price behavior seen before Ethereum’s explosive rally in late 2025.
During that previous cycle, ETH spent weeks compressing within a clearly defined horizontal range, building energy before eventually breaking out with strong momentum. The current chart shows a nearly identical box pattern forming, positioned similarly within the broader ascending channel. The symmetry between the two structures strengthens the case that this may not be random consolidation, but rather a repeat of a larger cyclical pattern.
If the fractal continues to play out as it did before, a decisive breakout above the current range could trigger a powerful upside expansion. Just as in 2025, the longer the price compresses within the box, the more aggressive the eventual move could become. A confirmed break and sustained acceptance above the range would be the key signal that Ethereum is transitioning from accumulation to markup once again.
]]>Cardano Price Flashes 35% Rally Hope Despite This Weak Metric BeInCrypto
Source link ]]>
Cardano Price Flashes 32% Rebound Hope — But There’s A Catch BeInCrypto
Source link ]]>
Bitcoin, Ethereum, XRP Slide Further, Dogecoin Flat As Crypto Market Shivers In ‘Extreme Fear’ — Analyst Sees Hope For ‘Short-Term Relief Rally’ Benzinga
Source link ]]>
One Reversal Hope Explains Why Big Money Bought the 20% Cardano (ADA) Price Dip BeInCrypto
Source link ]]>
Cardano Stalls at Breakout Point: Holder Shifts Now Weaken The 50% Rally Hope Yahoo Finance
Source link ]]>